Journal of Analytical Sciences, Methods and Instrumentation
Vol. 3 No. 1 (2013) , Article ID: 29177 , 5 pages DOI:10.4236/jasmi.2013.31007
Distribution of Some Elements in the Egyptian Black Sands from Abu Khashaba Beach Area
![]()
1Central Laboratory for Elemental and Isotopic Analysis, Nuclear Research Center, Cairo, Egypt; 2Physics Department, Faculty of Science and Human Studies, Shaqra University, Shaqra, KSA.
Email: qesat_alams@yahoo.com
Received October 1st, 2012; revised November 9th, 2012; accepted November 21st, 2012
Keywords: Alkaline Fusion; Black Sand; ICP-MS; Rosetta Branch
ABSTRACT
Inductively Coupled Plasma-Mass Spectrometry (ICP-MS) technique was used to determine the concentrations of titanium (Ti), vanadium (V), Chromium (Cr), Manganese (Mn), iron (Fe), zinc (Zn), arsenic (As), zirconium (Zr), cadmium (Cd) and hafnium (Hf) in black sands samples. 18 black sands samples were collected from the Mediterranean coast-Abu Khashabou Rosetta area, Egypt. Alkaline fusion procedure using mixture of Li-meta borate and tetra borate was used for the digestion of black sands samples. The average concentrations of Ti, V, Cr, Mn, Fe, Zn, As, Zr, Cd and Hf were 435.06 ppm, 322.32 ppm, 2515.03 ppm, 596.45 ppm, 185894 ppm, 249.95 ppm,309.32 ppm, 1077.26 ppm, 33.56 ppm and 3520.32 ppm, respectively. The procedure was tested with Basalt Hawaiian Volcanic Observatory (BHVO-2) standard reference material.
1. Introduction
The Egyptian black sands [1-3] are the end products of the disintegrated materials from the igneous and metamorphic rocks. The Egyptian black sand deposits comprise huge reserves of the six common economic minerals [4-6] that include ilmenite (Fe2+TiO3), magnetite (Fe23+Fe2+O4), garnet (X3Y2Si3O12 where X-Mg, Fe, Ca and Y-Al, Fe, Cr), zircon (ZrSiO4), rutile (TiO2) and monazite (Ce, La, Nd, Th) PO4. The Rosetta black sands have been the subject of many articles [7,8] and dissertations, as well as technical reports by private firms. Many of these studies and reports dealt with the mineralogy of these black sands and discussion of their economics. In this work, we discuss the elemental composition of these black sands that collected from Abu Khashaba Beach Area.
The elements selected are chosen for their importance for the probability of their environmental impact in case of their presence with higher concentrations than the normal levels. These environmental impacts may be due to their toxicity [9,10] and other harmful effects associated with their higher concentrations.
For determination of the concentration of the elemental composition of the black sands samples various analytical techniques can be used such as atomic absorption spectrometry [11,12], graphite furnace atomic absorption spectrometry [13,14], inductively coupled plasma atomic emission spectrometry [15,16], inductively coupled plasmamass spectrometry [17,18], and laser ablation—inductively coupled plasma-mass spectrometry [19,20]. In this study ICP-MS technique is selected to be used for determining the concentration of elemental composition of black sands samples for its high efficiency of the detection of the trace elements.
2. Experimental Conditions
Samples
Samples are collected from Abu Khashaba beach area, Rosetta branch (Figure 1). This location extends parallel to the Mediterranean coast. It is an open area occupied mainly by sabkha. There is no human activity because it is considered a military zone. It is nearly flat and very gently dipping (nearly horizontal) to north.
Six sampling profiles (Figure 2) denoted by symbols A1, A2 to A6 from east to west) spaced in-between by about 600 m and extending into the land from the beach line for about 50 m or less. Along each profile, three black sand samples are collected, the first sample from the surface at the beach line (denoted by A1, A2, ××××××, and A6, the second sample from the end of the tidal area (the wet area by the high tide) at a depth of about 50 cm (denoted by A1’, A2’, ××××××, and A6’), and the third sample
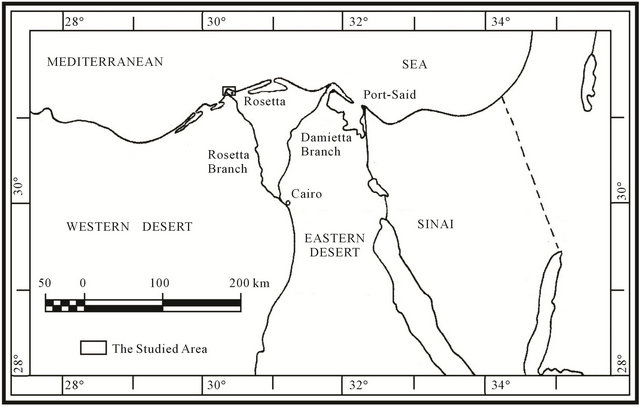
Figure 1. Location map of the studied area.
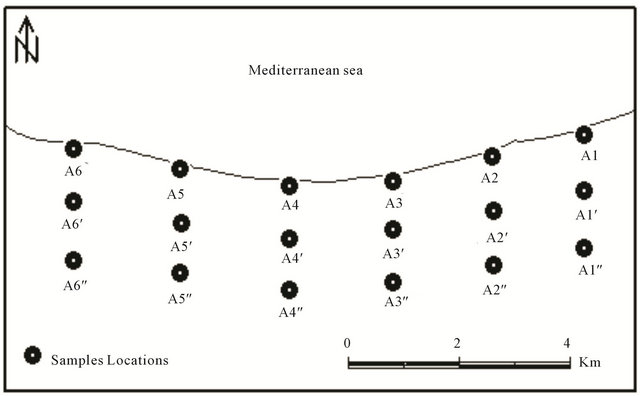
Figure 2. Map of the study area.
was taken from the dry area at a depth of about 1 m (denoted by A1”, A2”, ××××××, and A6”).
3. Sample Preparation
The samples were dried in an oven at 115˚C, mechanically crushed, and sieved through a 200 mesh sieve. All samples are treated by the process of an open-vessel acid digestion. The sequential steps of the alkaline fusion procedure for digestion of black sand samples are summarized in Scheme 1.
4. Reagents
Multi elements standard solution of the studied elements was prepared of analytical grade level. All solvents and chemicals were of high purity analytical grade. Ultra pure double deionized water (18 Ω ohm-cm) was used to dilute black sands samples and in the preparations of studied elements and reagents.
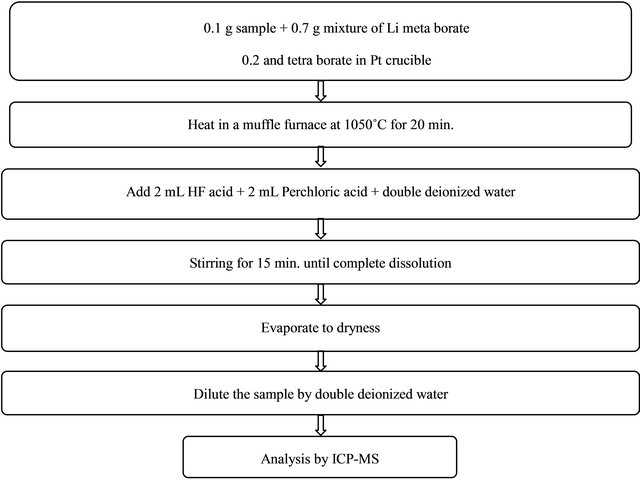
Scheme 1. Alkaline fusion procedure for digestion of black sand samples.
5. Instrumentation
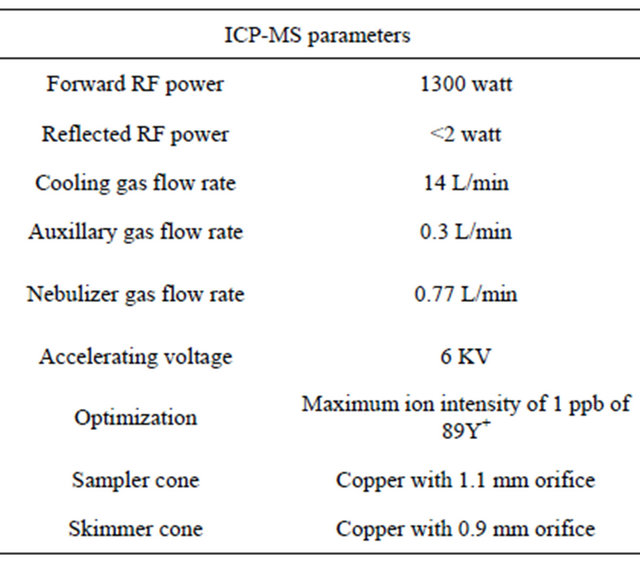
The high resolution inductively coupled plasma-mass spectrometry (JMS-PLASMAX2) technique is used for the elemental analysis of the collected black sands samples, where the experimental conditions are shown in Table 1.
Table 1. the experimental conditions for the high resolution inductively coupled plasma-mass spectrometry (JMSPLASMAX2).
6. Results and Discussion
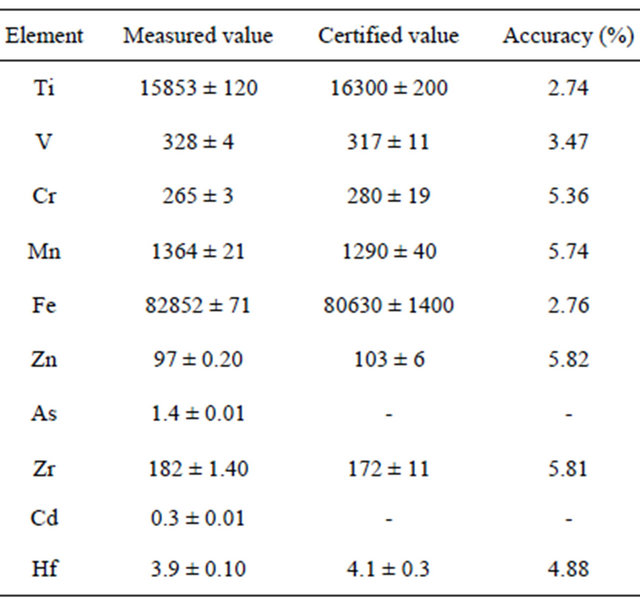
The validity of this method is confirmed by Basalt Hawaiian Volcanic Observatory (BHVO-2) as certified reference material. From Table 2 it is found that the obtained results and the certified reference values are close. Also the accuracy of each studied element is calculated.
Table 2. Elements concentration (ppm) of BHVO-2 by ICPMS.
Elemental analyses for 18 sediment samples were performed by using inductively coupled Plasma-mass spectrometer. Table 3 shows the elements concentrations for the analyzed black sand samples which collected from the Abu Khashabou beach area.
Ti ranges in concentration between 327.44 ppm and 538.05 ppm, with an average of 435.06 ppm in the collected sediment samples. V shows a general decrease in concentration from the sediment samples collected from the shore line backward into the land area behind, ranging between a minimum concentration of 268.74 ppm and a maximum concentration of 391.94 ppm, with an average of 322.32 ppm. A general decrease in Cr concentration through the collected sediment samples is noticed from the shore line backward into the land area behind varying from 2178.19 ppm to 2902.71 ppm, with an average of 2515.95 ppm. Like Cr and V, Mn concentration shows a general decrease from the sediment samples collected from the shore line backward to the samples collected from the land area behind, ranging between 501.23 ppm as a minimum amount of concentration and 610.80 ppm as a maximum amount of concentration, with an average of 596.45 ppm. Fe shows higher concentrations in the samples collected from the shore line area with a general decrease backward into the land area behind, ranging between 154,306 ppm and 218,425 ppm, with an average of 185,894 ppm. Zn ranges from 211.48 ppm to 298.50 ppm; with an average of 249.95 ppm through the collected sediment samples; with higher concentrations recorded in the samples collected from the shore line than those of the samples collected from the land. As shows an irregular pattern where it varies in concentration from 271.65 ppm to 352.65 ppm; with an average of 309.32 ppm through the collected sediment samples. Zr shows a general decrease in concentration from the shore line backward the land area behind through the collected sediment samples, ranging between 926.27ppm and 1616.77 ppm; with an average of 1077.26 ppm. Cd shows a nearly regular distribution with a general decrease in content from the sediment samples collected from the shore line backward through the samples collected from the land area behind. It ranges between 28.21ppm and 39.99 ppm; with an average of 33.56 ppm. The higher concentrations of Hf are recorded in the sediment samples collected from the shore line area; it ranges between 3081.69 ppm and 4599.19 ppm;
Table 3. Elements concentrations (ppm) of the black sand samples collected from Abu Khashaba beach area by ICP-MS.
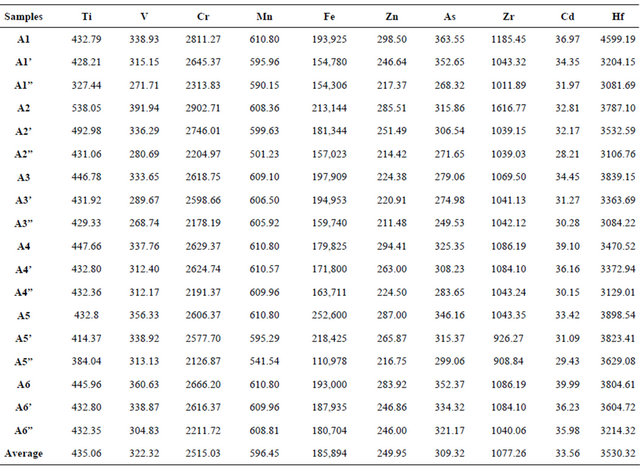
with an average of 3530.32 ppm.
7. Conclusion
Alkaline fusion method of black sand samples is a suitable method for the digestion of the samples due to eliminate of the matrix. ICP-MS is a good technique for its high efficiency of the detection of the trace elements. The concentration of the selected elements generally are decreased from the shore line backward the land area.
REFERENCES
- G. A. Dabbour, “Geological and Mineralogical Studies on Rutile in the Black Sand Deposits from the Egyptian Med. Coast,” Ph.D. Thesis, Cairo University, Giza, 1980.
- G. A. Dabbour, “Estimation of the Economic Minerals Reserves in Rosetta Beach Sands,” Egyptian Minerals, Vol. 7, 1995, pp. 1-6.
- Y. H. Dawod and M. H. Abd-Naby, “Mineral Chemistry of Monazite from the Black Sand Deposits, Northern Sinai, Egypt: A Provenance Perspective,” Mineralogical Magazine, Vol. 71, No.4, 2007, pp. 389-406.
- M. A. El-Askary and O. E. Frihy, “Mineralogy of the Subsurface Sediments at Rosetta and Damietta Promontories,” Egyptian Bulletin of the Institute of Oceanography and Fishery, Vol. 13, No. 2, 1987, pp. 111-120.
- A. F. A. El-Hadry, “Geologic and radiometric investigations on Abu Khashaba deposits, East Rosetta, Egypt,” M.Sc. Thesis, Cairo University, Giza, 1988.
- M. I. M. Ibrahim, “Investigation of Some Physical Properties of Zircon and Rutile to Prepare High Purity Mineral Concentrates from Black Sand Deposits,” M.Sc. Thesis, Mansoura University, Mansoura, 1995.
- M. N. El-Miligy and A. A. El-Azab, “Black Sand Project,” EGSA Annals, Paper No. 67, 1994, pp. 1-24.
- NMA, “International Report on Development of New Reserves for Black Sand Deposits,” Abu Khashaba Rosetta, Egypt, 1988.
- S. R. Taylor and S. M. McLennan, “The Continental Crust Its Composition and Evolution: An Examination of the Geochemical Record Preserved in Sedimentary Rocks,” Blackwell, Oxford, 1985.
- B. Anders, W. Junge, J. Knoth, W. Michaelis and J. R. Vogt, “Nuclear Methods in Environmental Research,” US-DOE, CONF-840408, 1984, p. 202.
- Standards Australia, “Australian Standard,” AAS 2912.2, 1994.
- G. Bumaa, G. Amar, S. V. Amosava and V. A. Potapov, Zhurnal Analiticheskoi Khimii, Vol. 47, 1992, p. 934.
- R. Boisvert, M. Bergeron and J. Tourcotte, “Re-Examination of the Determination of Palladium, Platinum and Rhodium in Rocks by Nickel Sulphide Fire Assay Followed by Graphite Furnace Atomic Absorption Measurements,” Analytica Chimica Acta, Vol. 246, No. 2, 1991, pp. 365-373. doi:10.1016/S0003-2670(00)80974-5
- J. Tilch, M. Schuster and M. Schwarzer, “Determination of Palladium in Airborne Particulate Matter in a German City,” Fresenius’ Journal of Analytical Chemistry, Vol. 367, No. 5, 2000, pp. 450-453. doi:10.1007/s002160000380
- L. P. Kolosova, A. E. Aladyshkina, L. A. Ushinskaya and T. N. Kopylova, Zhurnal Analiticheskoi Khimii, Vol. 46, 1991, p. 1386.
- O. I. Artem, V. M. Stepanov, S. L. Terekhovich and B. M. Karater, Zhurnal Analiticheskoi Khimii, Vol. 48, 1993, p. 91.
- G. E. M. Hall and J. C. Pelchat, “Analysis of Geological Materials for Gold, Platinum and Palladium at Low ppb Levels by Fire Assay-ICP Mass Spectrometry,” Chemical Geology, Vol. 115, No. 1-2, 1994, pp. 61-72. doi:10.1016/0009-2541(94)90145-7
- M. E. Farago, P. Kavanagh, R. Blanks, J. Kelly, et al., “Platinum Metal Concentrations in Urban Road Dust and Soil in the United Kingdom,” Fresenius’ Journal of Analytical Chemistry, Vol. 354, No. 5-6, 1996, pp. 660-663.
- E. K. Shibuya, J. E. S. Sarkis, J. Enzweiler, A. P. S. Jorge and A. M. G. Figueiredo, “Determination of Platinum Group Elements and Gold in Geological Materials Using an Ultraviolet Laser Ablation High-Resolution Inductively Coupled Plasma Mass Spectrometric Technique,” Journal of Analytical Atomic Spectrometry, Vol. 13, No. 9, 1998, pp. 941-944. doi:10.1039/a801477i
- A. P. S. Jorge, J. Enzweiler, E. K. Shibuya, J. E. S. Sarkis and A. M. G. Figueiredo, “Platinum-Group Elements and Gold Determination in NiS Fire Assay Buttons by UV Laser Ablation ICP-MS,” Geostandards Newsletter, Vol. 22, No. 1, 1998, pp. 47-55. doi:10.1111/j.1751-908X.1998.tb00544.x