Paper Menu >>
Journal Menu >>
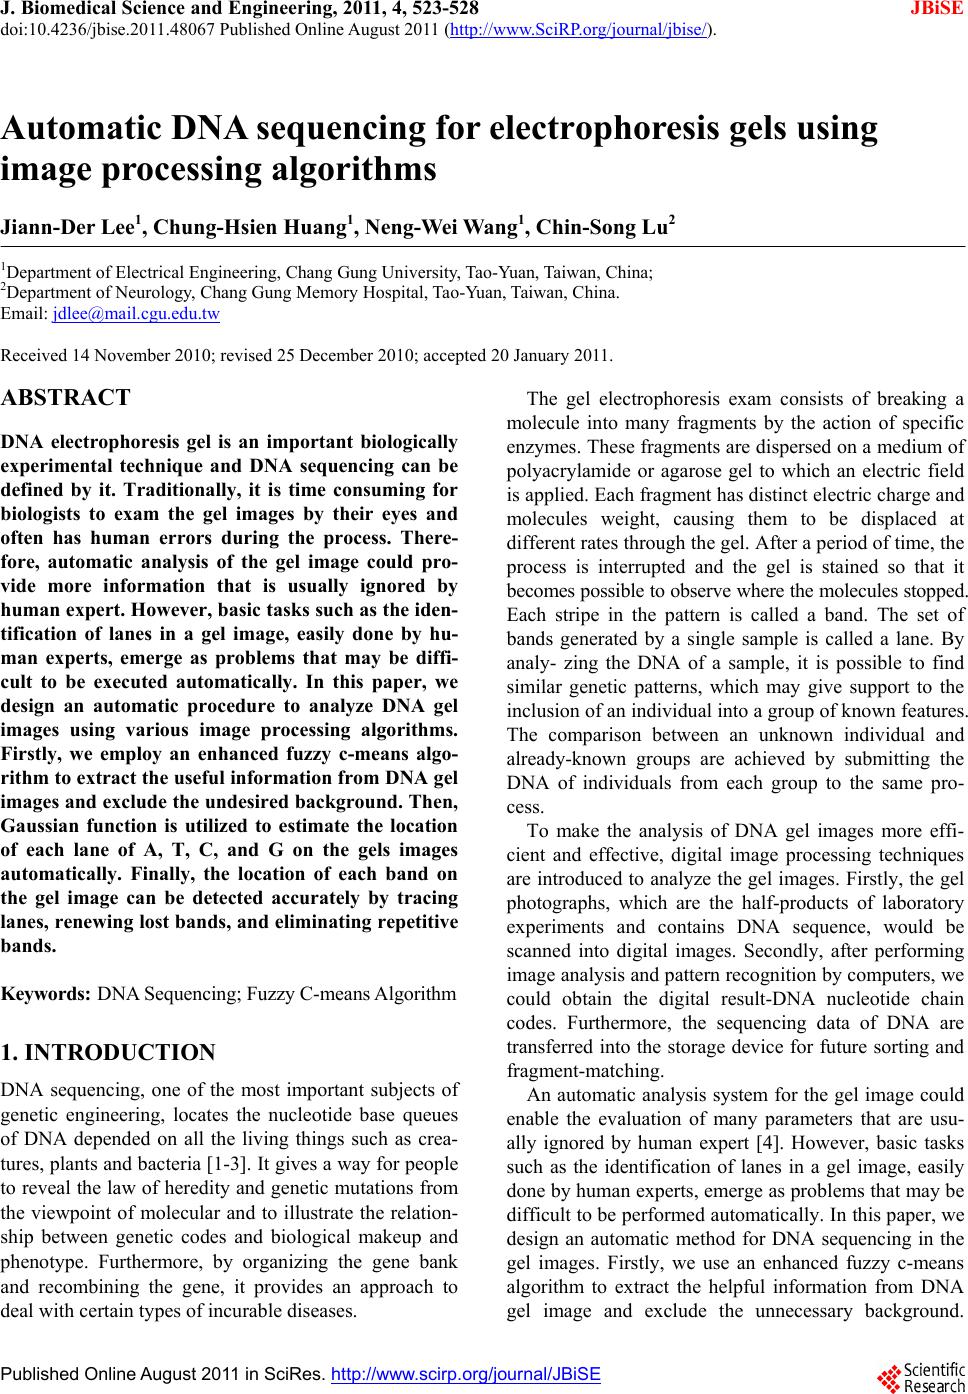 J. Biomedical Science and Engineering, 2011, 4, 523-528 doi:10.4236/jbise.2011.48067 Published Online August 2011 (http://www.SciRP.org/journal/jbise/ JBiSE ). Published Online August 2011 in SciRes. http://www.scirp.org/journal/JBiSE Automatic DNA sequencing for electrophoresis gels using image processing algorithms Jiann-Der Lee1, Chung-Hsien Huang1, Neng-Wei Wang1, Chin-Song Lu2 1Department of Electrical Engineering, Chang Gung University, Tao-Yuan, Taiwan, China; 2Department of Neurology, Chang Gung Memory Hospital, Tao-Yuan, Taiwan, China. Email: jdlee@mail.cgu.edu.tw Received 14 November 2010; revised 25 December 2010; accepted 20 January 2011. ABSTRACT DNA electrophoresis gel is an important biologically experimental technique and DNA sequencing can be defined by it. Traditionally, it is time consuming for biologists to exam the gel images by their eyes and often has human errors during the process. There- fore, automatic analysis of the gel image could pro- vide more information that is usually ignored by human expert. However, basic tasks such as the iden- tification of lanes in a gel image, easily done by hu- man experts, emerge as problems that may be diffi- cult to be executed automatically. In this paper, we design an automatic procedure to analyze DNA gel images using various image processing algorithms. Firstly, we employ an enhanced fuzzy c-means algo- rithm to extract the useful information from DNA gel images and exclude the undesired background. Then, Gaussian function is utilized to estimate the location of each lane of A, T, C, and G on the gels images automatically. Finally, the location of each band on the gel image can be detected accurately by tracing lanes, renewing lost bands, and eliminating repetitive bands. Keywords: DNA Sequencing; Fuzzy C-means Algorithm 1. INTRODUCTION DNA sequencing, one of the most important subjects of genetic engineering, locates the nucleotide base queues of DNA depended on all the living things such as crea- tures, plants and bacteria [1-3]. It gives a way for people to reveal the law of heredity and genetic mutations from the viewpoint of molecular and to illustrate the relation- ship between genetic codes and biological makeup and phenotype. Furthermore, by organizing the gene bank and recombining the gene, it provides an approach to deal with certain types of incurable diseases. The gel electrophoresis exam consists of breaking a molecule into many fragments by the action of specific enzymes. These fragments are dispersed on a medium of polyacrylamide or agarose gel to which an electric field is applied. Each fragment has distinct electric charge and molecules weight, causing them to be displaced at different rates through the gel. After a period of time, the process is interrupted and the gel is stained so that it becomes possible to observe where the molecules stopped. Each stripe in the pattern is called a band. The set of bands generated by a single sample is called a lane. By analy- zing the DNA of a sample, it is possible to find similar genetic patterns, which may give support to the inclusion of an individual into a group of known features. The comparison between an unknown individual and already-known groups are achieved by submitting the DNA of individuals from each group to the same pro- cess. To make the analysis of DNA gel images more effi- cient and effective, digital image processing techniques are introduced to analyze the gel images. Firstly, the gel photographs, which are the half-products of laboratory experiments and contains DNA sequence, would be scanned into digital images. Secondly, after performing image analysis and pattern recognition by computers, we could obtain the digital result-DNA nucleotide chain codes. Furthermore, the sequencing data of DNA are transferred into the storage device for future sorting and fragment-matching. An automatic analysis system for the gel image could enable the evaluation of many parameters that are usu- ally ignored by human expert [4]. However, basic tasks such as the identification of lanes in a gel image, easily done by human experts, emerge as problems that may be difficult to be performed automatically. In this paper, we design an automatic method for DNA sequencing in the gel images. Firstly, we use an enhanced fuzzy c-means algorithm to extract the helpful information from DNA gel image and exclude the unnecessary background. 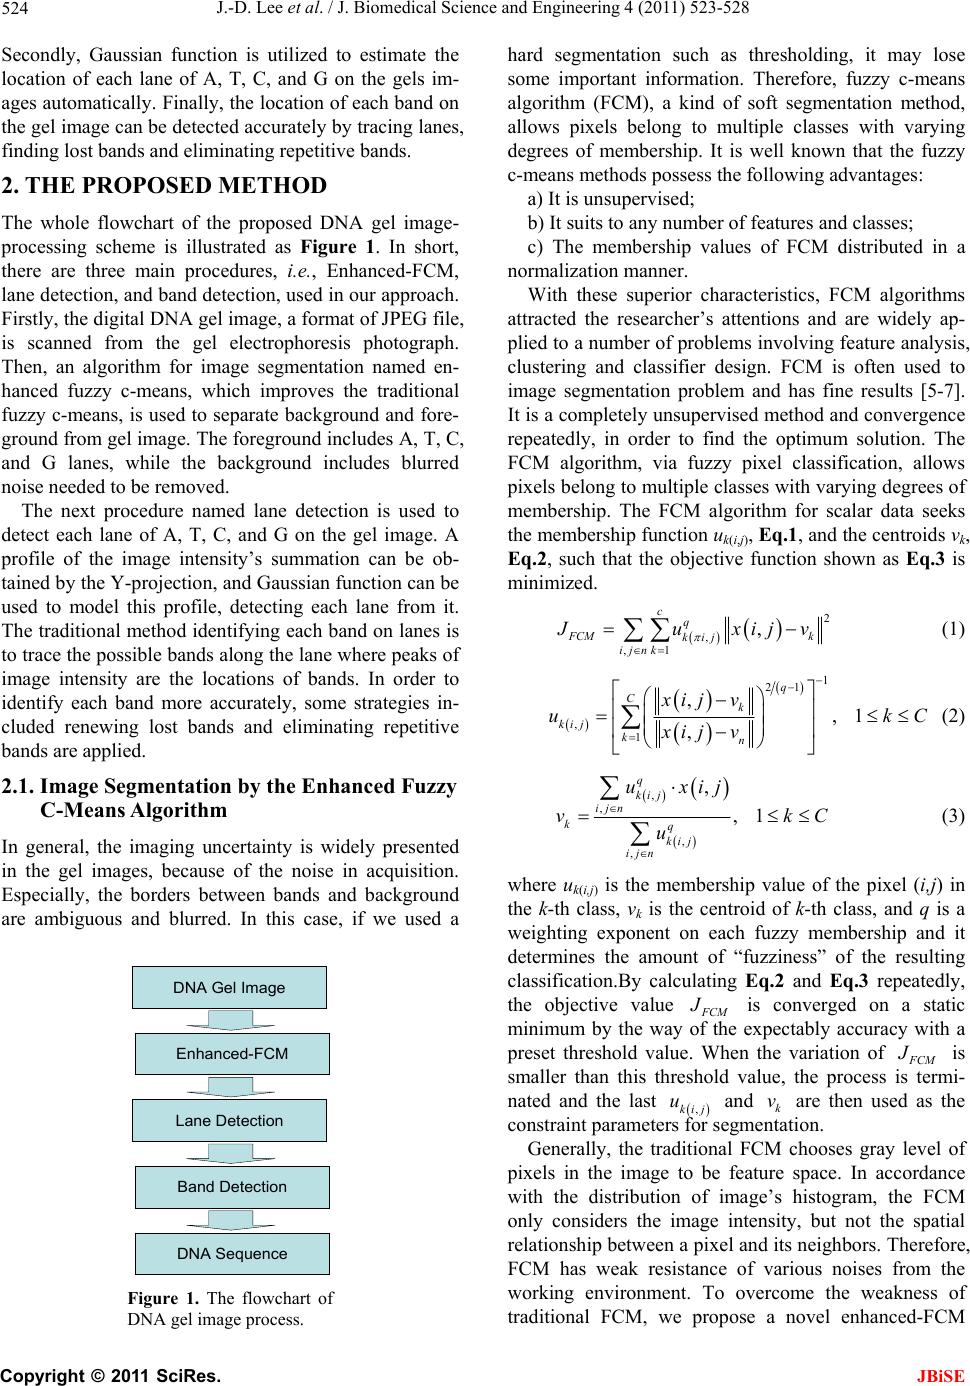 J.-D. Lee et al. / J. Biomedical Science and Engineering 4 (2011) 523-528 524 Secondly, Gaussian function is utilized to estimate the location of each lane of A, T, C, and G on the gels im- ages automatically. Finally, the location of each band on the gel image can be detected accurately by tracing lanes, finding lost bands and eliminating repetitive bands. 2. THE PROPOSED METHOD The whole flowchart of the proposed DNA gel image- processing scheme is illustrated as Figure 1. In short, there are three main procedures, i.e., Enhanced-FCM, lane detection, and band detection, used in our approach. Firstly, the digital DNA gel image, a format of JPEG file, is scanned from the gel electrophoresis photograph. Then, an algorithm for image segmentation named en- hanced fuzzy c-means, which improves the traditional fuzzy c-means, is used to separate background and fore- ground from gel image. The foreground includes A, T, C, and G lanes, while the background includes blurred noise needed to be removed. The next procedure named lane detection is used to detect each lane of A, T, C, and G on the gel image. A profile of the image intensity’s summation can be ob- tained by the Y-projection, and Gaussian function can be used to model this profile, detecting each lane from it. The traditional method identifying each band on lanes is to trace the possible bands along the lane where peaks of image intensity are the locations of bands. In order to identify each band more accurately, some strategies in- cluded renewing lost bands and eliminating repetitive bands are applied. 2.1. Image Segmentation by the Enhanced Fuzzy C-Means Algorithm In general, the imaging uncertainty is widely presented in the gel images, because of the noise in acquisition. Especially, the borders between bands and background are ambiguous and blurred. In this case, if we used a DNA Gel Image Enhanced-FCM Lane Detection Band Detection DNA Sequence Figure 1. The flowchart of DNA gel image process. hard segmentation such as thresholding, it may lose some important information. Therefore, fuzzy c-means algorithm (FCM), a kind of soft segmentation method, allows pixels belong to multiple classes with varying degrees of membership. It is well known that the fuzzy c-means methods possess the following advantages: a) It is unsupervised; b) It suits to any number of features and classes; c) The membership values of FCM distributed in a normalization manner. With these superior characteristics, FCM algorithms attracted the researcher’s attentions and are widely ap- plied to a number of problems involving feature analysis, clustering and classifier design. FCM is often used to image segmentation problem and has fine results [5-7]. It is a completely unsupervised method and convergence repeatedly, in order to find the optimum solution. The FCM algorithm, via fuzzy pixel classification, allows pixels belong to multiple classes with varying degrees of membership. The FCM algorithm for scalar data seeks the membership function uk(i,j), Eq.1, and the centroids vk, Eq.2, such that the objective function shown as Eq.3 is minimized. 2 , ,1 , cq FCM k kij ij nk J uxijv (1) 1 21 , 1 ,,1 , q Ck kij kn xij v uk xij v C (2) , , , , , ,1 q kij ijn kq kij ij n uxij vk u C (3) where uk(i,j) is the membership value of the pixel (i,j) in the k-th class, vk is the centroid of k-th class, and q is a weighting exponent on each fuzzy membership and it determines the amount of “fuzziness” of the resulting classification.By calculating Eq.2 and Eq.3 repeatedly, the objective value F CM is converged on a static minimum by the way of the expectably accuracy with a preset threshold value. When the variation of J F CM is smaller than this threshold value, the process is termi- nated and the last ,kij and k are then used as the constraint parameters for segmentation. J u v Generally, the traditional FCM chooses gray level of pixels in the image to be feature space. In accordance with the distribution of image’s histogram, the FCM only considers the image intensity, but not the spatial relationship between a pixel and its neighbors. Therefore, FCM has weak resistance of various noises from the working environment. To overcome the weakness of traditional FCM, we propose a novel enhanced-FCM C opyright © 2011 SciRes. JBiSE 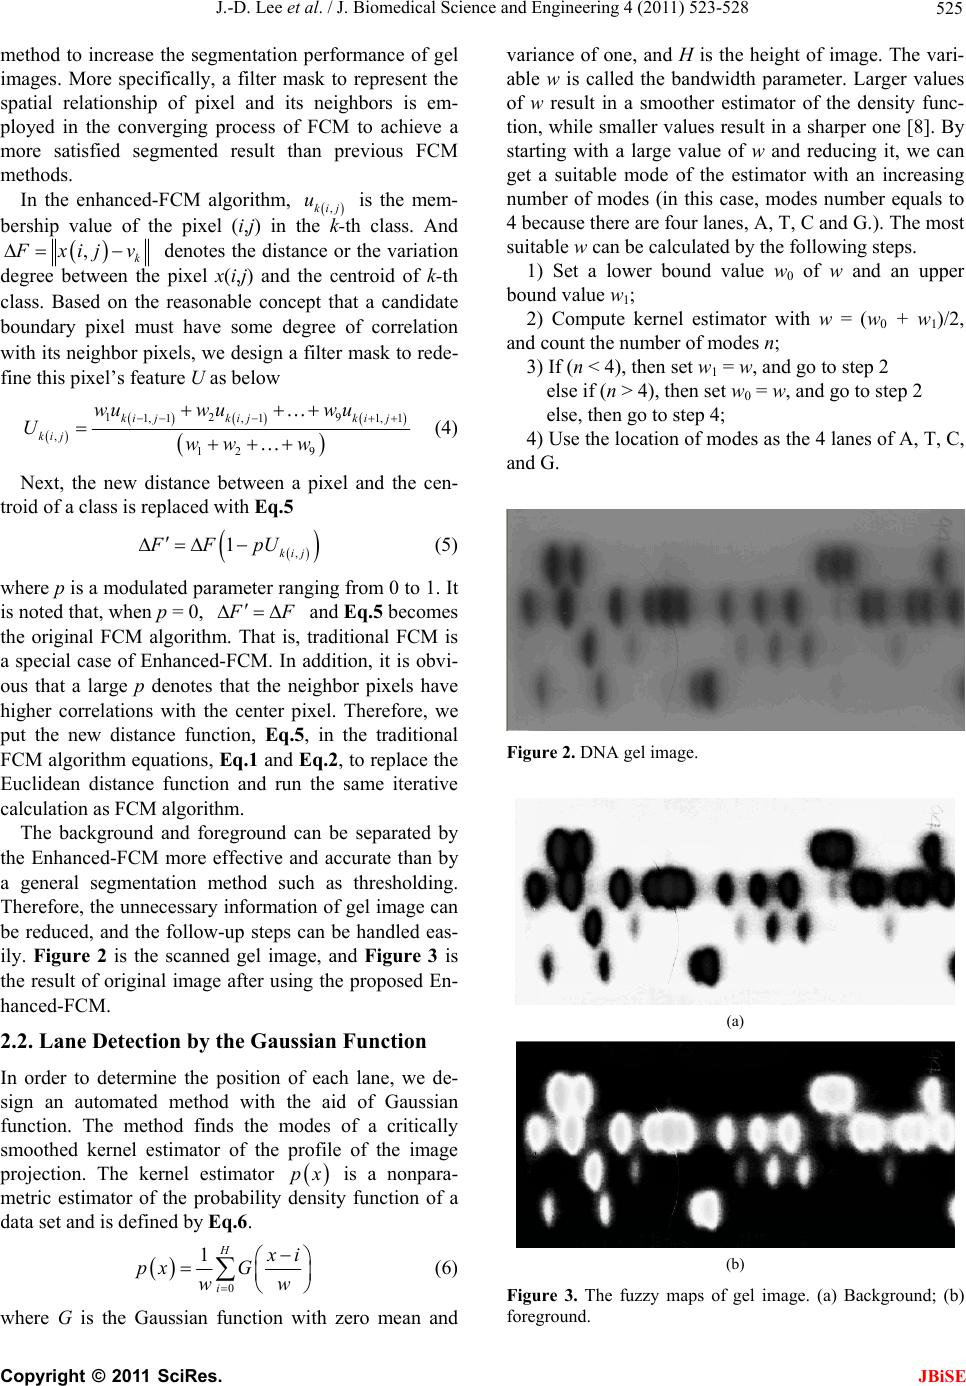 J.-D. Lee et al. / J. Biomedical Science and Engineering 4 (2011) 523-528 525 method to increase the segmentation performance of gel images. More specifically, a filter mask to represent the spatial relationship of pixel and its neighbors is em- ployed in the converging process of FCM to achieve a more satisfied segmented result than previous FCM methods. In the enhanced-FCM algorithm, ,kij is the mem- bership value of the pixel (i,j) in the k-th class. And u ,k F xij v denotes the distance or the variation degree between the pixel x(i,j) and the centroid of k- th class. Based on the reasonable concept that a candidate boundary pixel must have some degree of correlation with its neighbor pixels, we design a filter mask to rede- fine this pixel’s feature U as below 12 9 1, 1, 11, 1 , 12 9 ki jkijki j kij wuw uw u Uww w (4) Next, the new distance between a pixel and the cen- troid of a class is replaced with Eq.5 , 1kij FFpU (5) where p is a modulated parameter ranging from 0 to 1. It is noted that, when p = 0, F F and Eq.5 becomes the original FCM algorithm. That is, traditional FCM is a special case of Enhanced-FCM. In addition, it is obvi- ous that a large p denotes that the neighbor pixels have higher correlations with the center pixel. Therefore, we put the new distance function, Eq.5, in the traditional FCM algorithm equations, Eq.1 and Eq.2, to replace the Euclidean distance function and run the same iterative calculation as FCM algorithm. The background and foreground can be separated by the Enhanced-FCM more effective and accurate than by a general segmentation method such as thresholding. Therefore, the unnecessary information of gel image can be reduced, and the follow-up steps can be handled eas- ily. Figure 2 is the scanned gel image, and Figure 3 is the result of original image after using the proposed En- hanced-FCM. 2.2. Lane Detection by the Gaussian Function In order to determine the position of each lane, we de- sign an automated method with the aid of Gaussian function. The method finds the modes of a critically smoothed kernel estimator of the profile of the image projection. The kernel estimator is a nonpara- metric estimator of the probability density function of a data set and is defined by Eq.6. px 0 1H i x i px G ww (6) where G is the Gaussian function with zero mean and variance of one, and H is the height of image. The vari- able w is called the bandwidth parameter. Larger values of w result in a smoother estimator of the density func- tion, while smaller values result in a sharper one [8]. By starting with a large value of w and reducing it, we can get a suitable mode of the estimator with an increasing number of modes (in this case, modes number equals to 4 because there are four lanes, A, T, C and G.). The most suitable w can be calculated by the following steps. 1) Set a lower bound value w0 of w and an upper bound value w1; 2) Compute kernel estimator with w = (w0 + w1)/2, and count the number of modes n; 3) If (n < 4), then set w1 = w, and go to step 2 else if (n > 4), then set w0 = w, and go to step 2 else, then go to step 4; 4) Use the location of modes as the 4 lanes of A, T, C, and G. Figure 2. DNA gel image. (a) (b) Figure 3. The fuzzy maps of gel image. (a) Background; (b) foreground. C opyright © 2011 SciRes. JBiSE 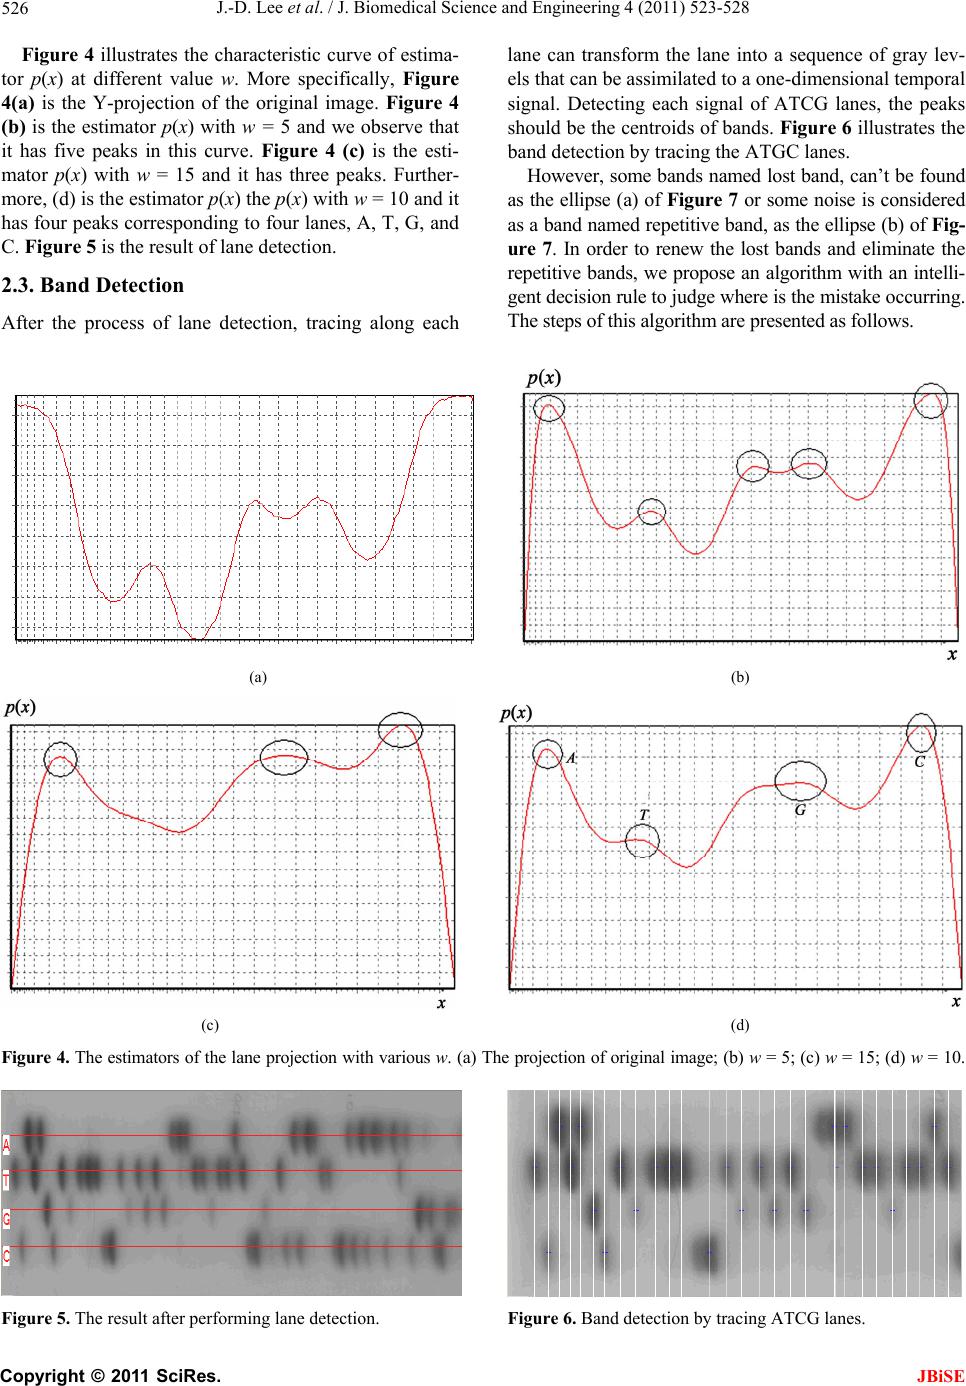 J.-D. Lee et al. / J. Biomedical Science and Engineering 4 (2011) 523-528 Copyright © 2011 SciRes. 526 Figure 4 illustrates the characteristic curve of estima- tor p(x) at different value w. More specifically, Figure 4(a) is the Y-projection of the original image. Figure 4 (b) is the estimator p(x) with w = 5 and we observe that it has five peaks in this curve. Figure 4 (c) is the esti- mator p(x) with w = 15 and it has three peaks. Further- more, (d) is the estimator p(x) the p(x) with w = 10 and it has four peaks corresponding to four lanes, A, T, G, and C. Figure 5 is the result of lane detection. lane can transform the lane into a sequence of gray lev- els that can be assimilated to a one-dimensional temporal signal. Detecting each signal of ATCG lanes, the peaks should be the centroids of bands. Figure 6 illustrates the band detection by tracing the ATGC lanes. However, some bands named lost band, can’t be found as the ellipse (a) of Figure 7 or some noise is considered as a band named repetitive band, as the ellipse (b) of Fig- ure 7. In order to renew the lost bands and eliminate the repetitive bands, we propose an algorithm with an intelli- gent decision rule to judge where is the mistake occurring. The steps of this algorithm are presented as follows. 2.3. Band Detection After the process of lane detection, tracing along each (a) (b) (c) (d) Figure 4. The estimators of the lane projection with various w. (a) The projection of original image; (b) w = 5; (c) w = 15; (d) w = 10. Figure 5. The result after performing lane detection. Figure 6. Band detection by tracing ATCG lanes. JBiSE 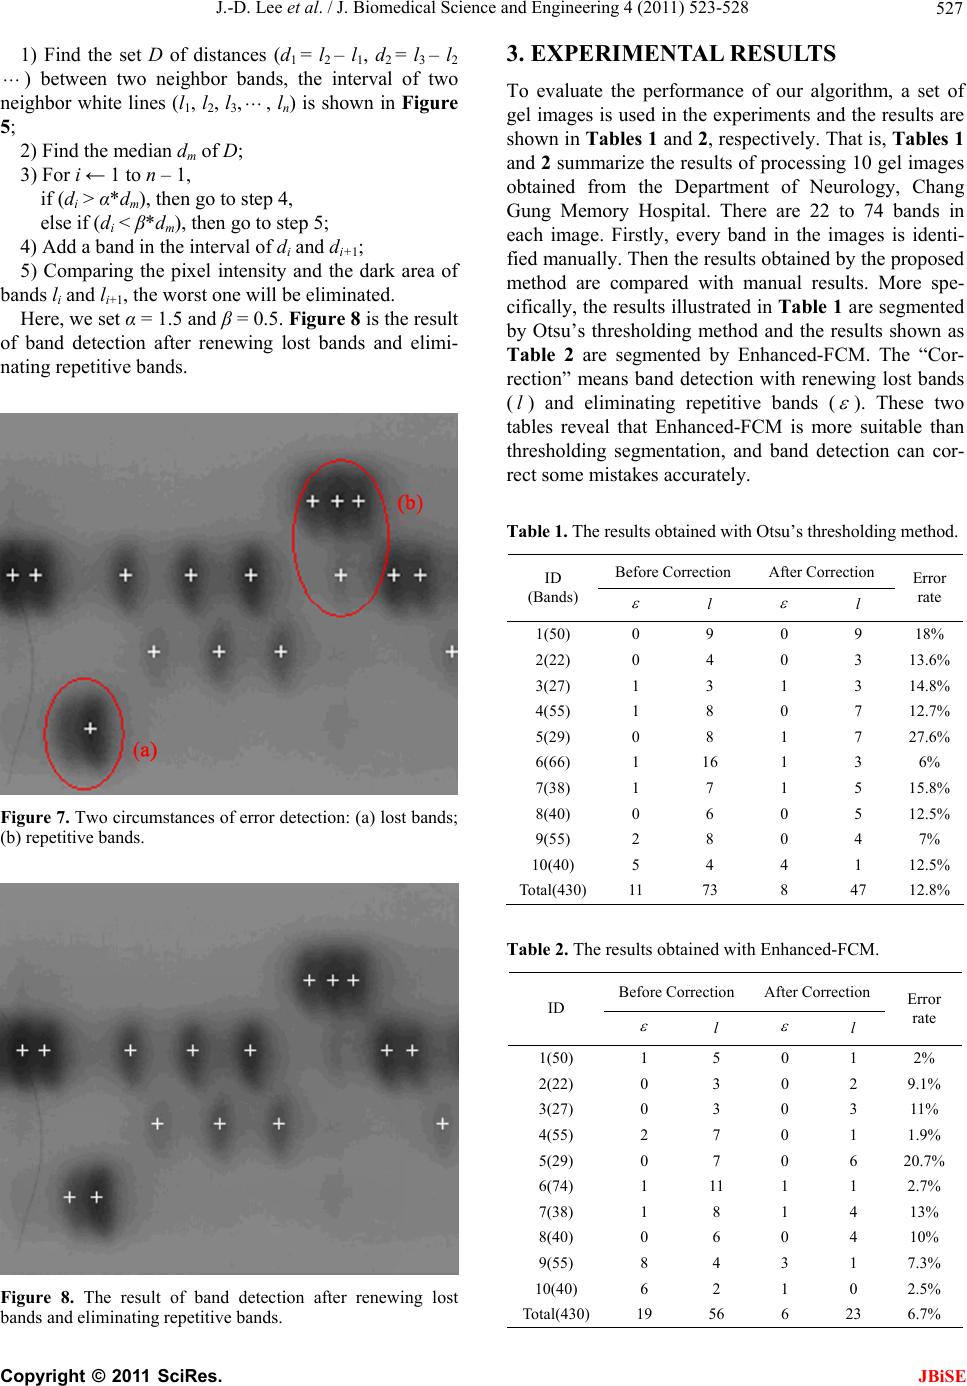 J.-D. Lee et al. / J. Biomedical Science and Engineering 4 (2011) 523-528 527 1) Find the set D of distances (d1 = l2 – l1, d2 = l3 – l2 ) between two neighbor bands, the interval of two neighbor white lines (l1, l2, l3,, ln) is shown in Figure 5; 2) Find the median dm of D; 3) For i ← 1 to n – 1, if (di > α*dm), then go to step 4, else if (di < β*dm), then go to step 5; 4) Add a band in the interval of di and di+1; 5) Comparing the pixel intensity and the dark area of bands li and li+1, the worst one will be eliminated. Here, we set α = 1.5 and β = 0.5. Figure 8 is the result of band detection after renewing lost bands and elimi- nating repetitive bands. Figure 7. Two circumstances of error detection: (a) lost bands; (b) repetitive bands. Figure 8. The result of band detection after renewing lost bands and eliminating repetitive bands. 3. EXPERIMENTAL RESULTS To evaluate the performance of our algorithm, a set of gel images is used in the experiments and the results are shown in Tables 1 and 2, respectively. That is, Tables 1 and 2 summarize the results of processing 10 gel images obtained from the Department of Neurology, Chang Gung Memory Hospital. There are 22 to 74 bands in each image. Firstly, every band in the images is identi- fied manually. Then the results obtained by the proposed method are compared with manual results. More spe- cifically, the results illustrated in Table 1 are segmented by Otsu’s thresholding method and the results shown as Table 2 are segmented by Enhanced-FCM. The “Cor- rection” means band detection with renewing lost bands (l) and eliminating repetitive bands ( ). These two tables reveal that Enhanced-FCM is more suitable than thresholding segmentation, and band detection can cor- rect some mistakes accurately. Table 1. The results obtained with Otsu’s thresholding method. Before Correction After Correction ID (Bands) l l Error rate 1(50) 0 9 0 9 18% 2(22) 0 4 0 3 13.6% 3(27) 1 3 1 3 14.8% 4(55) 1 8 0 7 12.7% 5(29) 0 8 1 7 27.6% 6(66) 1 16 1 3 6% 7(38) 1 7 1 5 15.8% 8(40) 0 6 0 5 12.5% 9(55) 2 8 0 4 7% 10(40) 5 4 4 1 12.5% Total(430)11 73 8 47 12.8% Table 2. The results obtained with Enhanced-FCM. Before Correction After Correction ID l l Error rate 1(50) 1 5 0 1 2% 2(22) 0 3 0 2 9.1% 3(27) 0 3 0 3 11% 4(55) 2 7 0 1 1.9% 5(29) 0 7 0 6 20.7% 6(74) 1 11 1 1 2.7% 7(38) 1 8 1 4 13% 8(40) 0 6 0 4 10% 9(55) 8 4 3 1 7.3% 10(40) 6 2 1 0 2.5% Total(430)19 56 6 23 6.7% C opyright © 2011 SciRes. JBiSE  J.-D. Lee et al. / J. Biomedical Science and Engineering 4 (2011) 523-528 Copyright © 2011 SciRes. 528 4. CONCLUSIONS In this approach, we have proposed a scheme for the gel image analysis which includes an efficient segmentation method named Enhanced-FCM, lane detection utilizing Gaussian function, and band detection by tracing each lane, renewing lost bands and eliminating repetitive bands. Here, Enhanced-FCM, which improves the tradi- tional fuzzy c-means is used to separate background and foreground from gel image. Then, lane detection is used to detect each lane of A, T, C, and G on the gel image. A profile of the image intensity’s summation can be ob- tained by the Y-projection of the origin image, and Gaussian function can be used to model this profile and detect each lane from it. Furthermore, in order to iden- tify each band belonging to each lane more accurately, some strategies included renewing lost bands and elimi- nating repetitive bands are also presented. JBiSE REFERENCES [1] Griffiths, A.J.F., Miller, J.M. and Suzuki, D.T. (2000) An introduction to genetic analysis. WH Freeman & Co., New York. [2] Moore, S.M. (2000) Understanding human genome. IEEE Spectrum, 37, 33-35. doi:10.1109/6.880951 [3] Patel, D. (1994) Gel electrophoresis: Essential data. Wiley, New York. [4] Umesh, P.S. and Flint, J. (2003) An efficient tool for genetic experiments: Agarose gel image analysis. Pattern Recognition, 36, 2453-2461. [5] Lim, Y.W. and Lee, S.U. (1990) On the color image seg- mentation algorithm based on the thresholding and the fuzzy c-means techniques. Pattern Recognition, 23, 935- 952. doi:10.1016/0031-3203(90)90103-R [6] Suckling, J., Sigmundsson, T., Greenwood, K. and Bull- more, E.T. (1999) A modified fuzzy clustering algorithm for operator independent brain tissue classification of dual echo MR images. Magnetic Resonance Imaging, 17, 1065-1076. doi:10.1016/S0730-725X(99)00055-7 [7] Phillips, W.E., Velthuizen, R.P., Phuphanich, S., Hall, L.O., Clarke, L.P. and Silbiger, M.L. (1995) Application of fuzzy c-means segmentation technique for differentia- tion in MR images of a hemorrhagic glioblastoma multi- forme. Magnetic Resonance Imaging, 13, 277-290. doi:10.1016/0730-725X(94)00093-I |