Open Access Library Journal
Vol.03 No.06(2016), Article ID:69439,8 pages
10.4236/oalib.1102727
Applying the DRC (Domestic Resource Cost) Index to Evaluate the Competitive Advantage of Dak Lak Coffee
Hoang Tuan Minh1, Doan Thi Nhu Trang2, Jiancheng Chen3
1Beijing Forestry University, Beijing, China
2University of Science and Technology Beijing, Beijing, China
3Economic and Management School, Beijing Forestry University, Beijing, China

Copyright © 2016 by authors and OALib.
This work is licensed under the Creative Commons Attribution International License (CC BY).
http://creativecommons.org/licenses/by/4.0/


Received 25 May 2016; accepted 26 June 2016; published 29 June 2016

ABSTRACT
In the past few years, the volatility of the world price market and the intrinsic weaknesses of production coupled with skepticism from experts as well as households had effects of coffee production [1] , that’s why the purpose of the article is to use index DRC (Domestic Resource Cost) to confirm the effectiveness of the coffee plantations in Dak Lak, through DRC index we not only assess competitive advantage of the coffee over other crop products in Dak Lak but also can find agents that affect competitiveness and find a way to enhance the competitiveness of products. The result of the research confirms that comparative advantages of coffee products are very sensitive to fluctuations in the price of coffee exports.
Keywords:
DRC Index, Evaluate the Competitive Advantage, Dak Lak, Coffee
Subject Areas: Statistics and Econometrics

1. Introduction
Vietnam coffee industry in general and Dak Lak coffee sector in particular have developed rapidly over time, significantly contributing to the development of Dak Lak Province, Central Highlands region and as well as the country.
Over the last 40 years, economic development in Central Highlands in general and the Dak Lak Province in particular is outstanding in terms of both scale and structure. Agribusiness in which major crops with high economic value, such as coffee, rubber, pepper, etc.… have highlighted Central Highland as a special image. Vietnamese coffee has played an important role in the global coffee market. Central Highlands and Buon Ma Thuot have become special places for local marketing strategies and are known as one of the largest coffee producing localities over the world [2] .
2. Method to Determining the Competitive Advantages of Coffee
Firstly, the competitive advantage indicates whether a country can compete successfully on certain commodity products on the world market or not.
A measure, in terms of real resources, of the opportunity cost of producing or saving foreign exchange. It is an ex ante measure of comparative advantage, used to evaluate projects and policies. The term was introduced to the economics literature by Bruno (1963, 1972). (As discussed by Michael Bruno [3] ).
Coefficient of domestic resource costs (DRC―Domestic Resource Cost) is used to determine the competitive advantage of DAK LAK coffee. This coefficient is used not only to estimate the comparative advantages but also used to calculate competitive advantage. Comparative advantage using economic price (social price or shadow price) and shadow exchange rate (SER―Shadow Exchange Rate) to calculate the DRC, while the competitive advantage using financial price (current price or market price) and the official exchange rate (OER―Office Exchange Rate).
The mathematical formula for calculating the DRC:


When: Qdi is the volume of domestic inputs used to produce a unit of product (1 tons of coffee beans);
Ø Pdi is a social price/real price of domestic inputs.
Ø Qfi the volume of imported inputs used to produce a unit of product (1 tons of coffee beans);
Ø Pfi is a social price/real price of imported inputs; Py is the product exported.
After calculating the DRC, comparing this with the official exchange rate (OER) and the shadow price of foreign exchange rates [1] (SER, the SER = OER * (1 + FX premium)) to determine the competitive advantages and comparative advantages. For developing countries, the World Bank (WB) proposed coefficient FX premium is 20% (0.2).
Significance of DRC
A well-established method of presenting comparative advantage is to measure domestic resource cost (DRC). DRC compares the opportunity costs or shadow prices of domestic resources used in production with the value added that they generate, that is:
Ø If DRC/OER = 1, then the economy is not conducive and foreign currency savings is not equal to domestic production (products produced beneficial neutrality).
Ø If DRC/OER < 1, the value of domestic resources for smaller production value net foreign savings (products with a competitive advantage on the international market), vice versa.
Ø If DRC/OER > 1, the value of domestic resources for greater production value net foreign savings (product no competitive advantage on the international market).
Similarly, if the DRC/SER < 1, the product has a comparative advantage; but if DRC/SER > 1, the product does not have a comparative advantage. (As discussed by J. P. Estudillo, M.Fujumura, and M.Hossain [4] ).
Outlining scenarios of the sensitivity of the DRC
Under the impact of the integration process, the factors in the DRC may change. So to calculate the impact of such changes on the competitiveness of research products. For example:
Ø The cost of domestic resources and domestic production costs increased by 5%, 10%,etc.
Ø Import costs rose by 5%, 10%, etc.
Ø Prices of export products decreased by 5%; ten%,etc.
Ø The cost of domestic and import costs rose by 5%, 10%, etc., while prices of export products decreased by 5%, 10%, etc.
Given the above assumptions, are recalculated only sub DRC and analyze the competitiveness of coffee products.
3. Analyze the Competitiveness of the Dak Lak’s Coffee
There are many methods and indicators to assess the competitiveness of the coffee sector in Dak Lak province. One such method is a comparative advantage. To determine the comparative advantages of coffee production, the estimated coefficient of domestic resource costs (DRC) [5] . To determine the DRC, it is necessary to identify internal resource costs (opportunity) to produce one finished ton of coffee, the export price in dollars and costs in USD foreign sources. This fee includes two phases: the cost of the production phase (coffee products) and expenses for the period to export processing at domestic ports. The cost of each item in the stage production is accounted in the total cost of the item for 1 ha of coffee tree life cycle divided by the total production of 1 ha in the whole lifecycle.
Cost of land: To determine the cost of land, people use the opportunity cost of land. Within the topic, the opportunity cost of land is determined by household land rent prices to coffee growers. All land costs are calculated as internal resource costs.
Labor costs are divided into two stages: The first stage is between coffee planting and harvesting at household level; the second phase is the cost of wages and insurance costs incurred in the processing of the coffee processing company. The opportunity cost of labor in the production phase is measured in real prices paid by households, assuming the labor market is relatively perfect. The opportunity cost of labor in processing are determined by wages, social insurance and other labor allowances.
The cost of fertilizer is divided into two power sources are the internal costs and external costs sources. The main fertilizer formanuring and tending annual trading period in the household is manure and NPK fertilizer. The fertilizers are partly imported fertilizers from abroad, some local produced. However, the domestic fertilizer producers still have to use some raw materials and machinery and equipment imports. Therefore, the cost of synthetic fertilizers NPK was identified as an external cost source, while the cost of organic fertilizers is internal source. Assuming, organic fertilizers market today is perfect, the real cost spent on compost is also the opportunity cost. Foreign source fertilizer costs are calculated by CIF [6] . All additional costs to be charged to household internal source cost. (This part explain why in Figure 1 the fertilizer factor appears twice time).
Insect powder costs, elding costs are also divided into two categories: internal and external power source costs. The opportunity cost of insect powder, elding import finished products from abroad are CIF [6] , insect powder, elding produced domestically but overseas import of raw materials, the cost charged on foreign sources, the transportation costs and other expenses are counted as internal cost source and retrieve the actual price rise as opportunity costs. (This part explain why in Figure 1 the elding factor appears twice time).
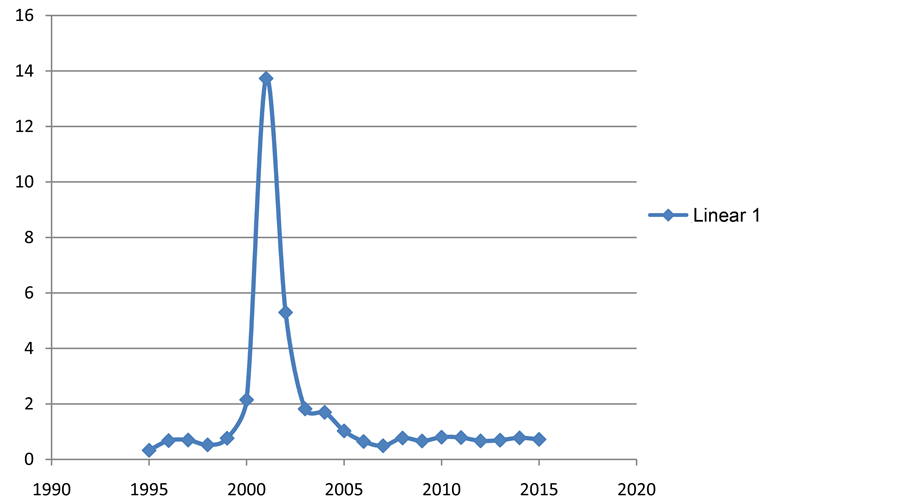
Figure 1. Changes in domestic resource cost, DRC.
The opportunity cost of these types of tools, instruments such as gloves, canvas, and other care tools in the initial stage and the exploitation of coffee farmers is determined by the purchase price in the market. Most types of tools, tooling costs are internal sources. Other expenses include transportation costs, rent securities, packaging, fees, charges ... all these costs were calculated as domestic source cost.
Official exchange rate (OER―Official Exchange Rate), 2011 (published by the State Bank of Vietnam) is 19,517 VND /USD. According to Le Thanh Industrial &C. Rola Agnes (2011), the exchange rate SER = OER dim *(1 + FX premium). With FX premium is the coefficient reflecting the difference between the official exchange rate and the opportunity cost (shadow price) of it. For developing countries, the World Bank (WB) proposed coefficient FX premium is 20% (0.2). So dim the exchange rate SER [3] (Shadow Exchange Rate) = 1.2 *OER = 23.420 VND/USD. Figure 1 shown that results source identified internal cost, the domestic factors of production, import factors and cost coefficients calculated resources DRC for 1 ton of finished coffee of households.
3.1. Coefficient of Domestic Resource Costs DRC
Calculation results in Table 1 shows that the index DRC/SER of coffee production in Dak Lak province was 0.7766 < 1, indicating if spend $0.7766 internal source cost to planting, processing and exporting coffee, it will
 “Calculated on 1 ton of coffee beans for export”
Table 1. Comparableness advantage of Dak Lak’s households coffe production and exporting.
Source: compiled from survey data and calculations by the author in 2014 [7] .
earn a foreign currency value of 1 US dollar. This estimated results have proved the cultivation and export of coffee in Dak Lak province has comparative advantages, brought foreign exchange into the country.
If we compare the competitiveness of coffee production in Dak Lak province with some products like perennial crops (rubber trees), cash crops (rice) and livestock products (dairy) is a limp issue and difficult in finding similarities. If in a case, coffee production has poor comparative advantages over rubber at a certain time period to recommend restructuring of crops from coffee production to rubber production is non-scientific jobs. It cannot restructure production from coffee production to the production of rice and dairy farming on coffee land where coffee production less competitive advantages over these products are.
3.2. Analysis of Factors Affecting the DRC Index
3.2.1. By Means of the Script
Comparative advantages of a country, an industry or a product can only make sense in a certain time period and levels usually change if conditions warrant comparative advantage is not maintained. Normally the input price of the production process and the product is constantly fluctuating, besides the policies and institutions often change over time. When coffee prices or the prices of input factors change, changes in exchange rates, etc. would make the DRC fluctuations. To assess the changing comparative advantage of the coffee industry, we use methods of analysis of factors affecting the DRC index under various scenarios in order to find solutions to stabilize and improve comparative advantages of coffee products [8] [9] . The scripts and calculated results are shows in Table 2.
“Calculated on 1 ton coffee beans for export on average”
Table 2. Scenarios of the domestic resource cost-DRC of Dak Lak’s coffee.
Source: Survey data and self calculation of crop year 2014.
Analysis results showed that, compared to the baseline scenario, in terms of other factors constant, if:
1) The cost of internal resources increased by 25%, DRC/SER = 0.9547.
2) The expenses of external sources increased by 25%, DRC/SER = 1.0597.
3) The exchange rate fell by 20%, DRC/SER = 0.9707.
4) The price of coffee exports fell 10% DRC/SER = 0.9791.
Thus, the coffee sector in Dak Lak has the ability to withstand the volatility of the prices of input factors (including the costs of internal and external sources) with an increase of 25% compared to the baseline scenario. For over two decades, the inflation rate in Vietnam is usually one figure, the highest rate was approximately 20% (2008) and 18% (2011). This demonstrates that, in two decades, Dak Lak coffee can still compete in the context of the price of input factors to rise.
According to the analysis on the exchange rate decreased approximately by 25% compared to the baseline scenario, DRC/SER = 1. Table 3 shows that,in the past decades, the exchange rate between VND and USD is always increasing. This trend increases the competitiveness of Vietnamese coffee in general and Dak Lak coffee in particular.
However, while coffee export prices decreased by 10%, coffee industry almost lost competitiveness (DRC/ SER = 0.9791). This analysis shows that the competitiveness of the coffee sector are significantly dependent on the volatility of prices.
From the results of the analysis showed that DRC/SER very sensitive to export coffee prices. In the past, the coffee price was down to a record low (compared with the price of coffee in the first months of the year 2014 have dropped to 1/5). Data Table 3 will be analyzed to further clarify the impact of price sensitive coffee exports to index DRC/SER.
“Calculated on 1 ton coffee beans for export on average”
Table 3. Volatility of DRC (Domestic resource cost) coefficient of Dak Lak coffee.
Source: International Coffee Organization ICO (2015), compiled from survey data and calculations by the author in 2016 [7] .
3.2.2. By Analytical Methods of the Time Series
The analysis of the factors affecting the DRC coefficient by using scenarios method can occur unrealistic situations. There are scripts given to analyze unlikely to happen. To stick to more realistic issue, we analyzed the factors affecting the DRC coefficient through time series in internal resource costs, the cost of foreign resources, export coffee prices and exchange rates [10] . In this analysis the above targets are estimated as follows: Cost of internal sources are volatile indicator of annual GDP deflator of Vietnam, foreign resource expenses calculated based on fluctuations in the GDP deflator index of US; according to statistics of the World Bank [11] [12] , the price of coffee exports calculated according to average export of international coffee organization (ICO), fluctuations in exchange rates notification based on average exchange rates of the interbank.
Table 3 and Figure 1 shows that, in the past 20 years (1995-2015), the coffee sector in Dak Lak province has undergone three phases of ups and downs.
In the period 1995-1999, world coffee prices are relatively high, while the price of internal cost factors, external sources are less volatile. Therefore, the DRC/SER always less than 1, especially in 1995 DRC/SER = 0.3264, coffee production in Dak Lak province has had a high comparative advantage.
The period of 2000-2005 is the most dramatic phase of the coffee industry in Vietnam in general and Dak Lak coffee sector in particular. During this period, due to supply-demand relationship of world coffee, it occurred adversely to coffee producing countries (oversupply), and made world coffee prices fall to their lowest level in 20 years last period past, while price factors of internal cost resources tend to rise. Therefore, the DRC/SER is always greater than 1 (Figure 1 shows that). Particularly in 2001-2002, world coffee prices fell to historic lows (302 USD/ton and 363 USD/ton), made the DRC index/SER spike (13.7343 and 5.2971), Dak Lak coffee industry lost competitiveness, household coffee production losses, clearing coffee fields to growing of other crops.
In recent years (2006-2015), although the cost of internal and external sources tends to increase due to inflation, but the coffee industry still produces effectively in a relatively long time period. That is because the world price of coffee rose sharply, the index DRC/SER always less than one. Especially in 2007, when prices rose to 1615 USD/ton, DRC/SER = 0.4924, Dak Lak coffee have had a high competitiveness, the coffee industry earned huge profits.
4. Conclusions
Through research and analysis, we can draw some comments on the competitiveness of the coffee in Dak Lak province is as follows.
Comparative advantages of coffee products are very sensitive to fluctuations in the price of coffee exports. When coffee export prices just reduce 10% compared to the baseline scenario, the coffee industry almost lost competitiveness (DRC/SER = 0.9791). Meanwhile, the coffee sector in Dak Lak province has the ability to withstand the volatility of the price of input factors (including the costs of internal and external sources) with an increase of up to 25% compared to the baseline scenario. As these costs increase less than 25% compared to the baseline scenario, export coffee production in Dak Lak always have a comparative advantage.
Research on volatility of index DRC/SER of Dak Lak coffee in the recent 20 years (1995-2015) shows more clearly the very large dependence of the comparative advantage of the coffee in the volatility of export coffee price: period 2000-2005, when world coffee prices were down too low (302-830 USD/ton), index DRC/SER was always greater than 1, the coffee sector in Dak Lak province had no comparative advantage during this period. The other phases, when coffee prices recovered, the index DRC/SER was less than 1, the province’s coffee sector had comparative advantage. Even in 2015 there were signs of the volatility of coffee prices (export price 1700 USD/ton) while the exchange rate rose to 22,420 (Dong/USD) but the DRC/SER still by 0.7217, planting and coffee exports still make profits.
Thus, competitiveness of Dak Lak coffee withstands volatility internal and external pricing sources with moderate inflation levels, less than 1 figure. However, price fluctuations of export coffee is the most notable factor because it has fluctuated greatly, again just very erratic but the factors themselves in coffee sectors are difficult in intervention. Therefore, the overall paper proposing one of effective measures to solve the immediate problem is too deep dependence on the world market and the volatility of the export price which is focusing on promoting domestic consumption. To do that, the coffee industry has to enhance the advertising of products, improve the quality of coffee, and strengthen services during and after the sale.
According to the World Bank’s statistics [11] , about 10% of coffee production is processed and consumed in domestic region (about 0.5 kg/person/year), equivalent to about 70,000 tons/year. Meanwhile in 2006 the consumption of coffee per capita in the EU is 5 kg/person/year, the highest of 13,49 kg Luxembourg, Finland and Denmark 11.92 kg 9.19 kg. The increase rate of domestic coffee consumption is a significant factor contributing to the development of sustainable coffee in Dak Lak province [12] - [14] .
Thus, analyzing the scenarios DRC showed that coffee exports of Dak Lak province have more advantages in the future. Therefore, the development of the province’s coffee production for export is inevitable. However, due to the product chain from materials and input services to growers, collectors, export processors without specific binding mechanisms so coffee growers still suffer, especially by market and input prices, output.
While there have been ups and downs, but in general, the Dak Lak province has a comparative advantage in coffee production for export. Production of coffee exports brings in foreign currency, contributing to economic development and improves the living standards of the people. It is also one of the factors contributing to the development of sustainable coffee in Dak Lak province.
Cite this paper
Hoang Tuan Minh,Doan Thi Nhu Trang,Jiancheng Chen, (2016) Applying the DRC (Domestic Resource Cost) Index to Evaluate the Competitive Advantage of Dak Lak Coffee. Open Access Library Journal,03,1-8. doi: 10.4236/oalib.1102727
References
- 1. Nhan, D.T. (2005) Five-Year Coffee Industry through the Crisis and Directions for the Future, Brand Development Workshop “Buon Ma Thuot Coffee”, Buon Ma Thuot.
- 2. Hong, T. (2011) Research on Raw Materials Coffee Production Solutions in High Quality in the Central Highlands, the Synthesis Subject Report, the Institute of Tay Nguyen Science and Technology, Agriculture Forestry.
- 3. Bruno, M. (1972) Domestic Resource Costs and Effective Protection: Clarification and Synthesis. Journal of Political Economy, 80, 16-33.
https://academiccommons.columbia.edu/download/.../9767.pdf
http://dx.doi.org/10.1086/259858 - 4. Estudillo, J.P., Fujumura, M. and Hossain, M. The Comparative Advantage of Rice Production in the Philippines, 1966-1991. 386-387.
http://www.tandfonline.com/doi/abs/10.1080/00220389908422596?journalCode=fjds20 - 5. Son, L. The Ministry of Agriculture and Rural Development (1990) The Economic Cycle and the Business Cycle Some Perennial Crops, According to Standards-Norms for Agricultural Planning. Publisher Agriculture, Hanoi.
- 6. Nga, D.T. (2012) Research on Competitive Advantage of Coffee Products on the Economic Organizations in Dak Lak. Economics Doctoral Dissertation, University of Agriculture in Hanoi.
- 7. Dak Lak Statistical Year Book 2011, 2012, 2013, 2014, 2015.
- 8. Van Tuan, D., The Ministry of Agriculture and Rural Development (2010) Development Planning Vietnam Coffee Industry up to 2020 and Vision to 2030, Hanoi.
- 9. Findlay, R. (1971) Comparative Advantage, Effective Protection and the Domestic Resource Cost of Foreign Exchange. Journal of International Economics, 1, 189-204.
http://www.sciencedirect.com/science/article/pii/0022199671900559
http://dx.doi.org/10.1016/0022-1996(71)90055-9 - 10. Hallam, D. (2003) Falling Commodity vi Prices and Industry Responses: Some Lessons from the International Coffee Crisis, in Commodity vi Market Review 2003-2004. FAO, Rome.
http://www.fao.org/docrep/006/y5117e/y5117e03.htm#fnB13 - 11. Daniele, G. (2001) Sustainable Coffee Survey of the North American Specialty vi Coffee Industry. The World Bank.
- 12. Giovannucci, D. and Koekoek, F.J. (2003) The State of Sustainable Coffee: A Study of Twelve Major Markets. International Coffee Organization, London.
www.cec.org/.../1700-sustainable-coffee-survey-north-american-specialty-coffee-industry-en.pdf - 13. Starbucks Corporation (2009) Fiscal 2009 Annual Report.
http://media.corporate-ir.net/media_files/irol/99/99518/SBUX_AR.pdf - 14. Rice, R. (1996) Coffee Modernization and Ecological Changes in Northern Latin America. Tea and Coffee Trade Journal, 104-113.