 Vol.1, No.2, 13- 19 (2011) doi:10.4236/ojpm.2011.12003 Copyright © 2011 SciRes. Openly accessible at http://www.scirp.org/journal/OJPM/ Open Journal of Preventive Medicine Demograph ic variations in discrepancies between objective and subjective measures of physical activity Lisa M. Mackay *, Melody Oliver, Grant M. Schofield Centre for Physical Activity and Nutrition, Auckland University of Technology, Auckland, New Zealand; *Corresponding author: lmackay@aut.ac.nz Received 17 May 2011; revised 29 June 2011; accepted 29 July 2011. AB S TRAC T Demographic effects (sex and parenthood status) on the level of association between self-re- ported and accelerometer assessed physical activity were examined among a large diverse sample of adults. Participant s (N = 1249, aged 20 - 65 years) wore accelerometers (Actical) for 7 days and completed an interviewer-adminis- tered physical activity recall questionnaire (IP A Q- LF) for the same period. Mean daily minutes of moderate physical activity (MPA) and moderate to vigorous physical activity (MVPA) were used in analyses. Linearity between methods was explored by regressing mean minutes of activity and Pearson’s correlations were performed. A weak association between IPAQ-LF and Actical minutes of MPA and MVPA per day was shown for the whole sample (rs = 0.216 - 0.260). The magnitud e of association v aried between males (rs = 0.265 - 0.366) and females (rs = 0.124 - 0.167), although no obvious variations in asso- ciations were evident for parenting status. The IPAQ-LF produced substantially greater varia- tions in estimates of physical activity than that recorded by the Actical a ccel ero mete r an d la rg e discrepancies between methods were observed at an individual level. Self-report tools provide a poor proxy of overall human movement, par- ticularly among females. Inferences made at an individual level from self-reported data, such as intervention efficacy or health outcomes, may have substantial error. Keywords: Sex; Parent; IPAQ; Accelerometer 1. INTRODUCTION Physical activity is an essential behavioral element in maintaining good health, preventing disease, and pro- longing longevity [1]. The epidemiology of physical activity considers the association physical activity and inactivity have with chronic diseases, and the mecha- nisms to prevent and control these diseases. Accurate monitoring of physical activity engagement in free-liv- ing populations is central to correctly determining the direction and magnitude of these associations and me- chanisms. Conventionally emphasis has been placed on measuring moderate and vigorous physical activities performed in leisure domains, although more recently non-leisure domains (e.g., occupational, transport, house- hold) have featured. In response to growing evidence for the poor health outcomes associated with sedentary be- haviors [2,3] and the positive health effects of low-level activity [4,5], a call has been made to incorporate these behaviors in measures of physical activity so that they may be tracked and health outcomes determined [6,7]. In the absence of an agreed-upon criterion for quanti- fying physical activity many types of measures are ap- plied [8]. Self-report tools (e.g., questionnaires, diaries) are the most widely-used measure of physical activity at a population level. Inherently, these tools rely on par- ticipants’ ability to accurately recall, quantify, and cate- gorize their physical activity behaviors according to the framework of the self-report tool. Conversely, motion sensors (e.g., accelerometers, some pedometers) can be used to provide an objective assessment of the accumu- lation of activity movement (commonly lower body movements) throughout a period of time. Accelerome- ters (e.g., Actigraph, Actical, Caltrac) use piezoelectric- ity to register acceleration, recording detailed temporal data across the spectrum of activity intensity, including sedentary behaviors and low-level activity. Many epidemiological studies using self-report meas- ures have shown women to be less active than men [9]. Moreover, some sub-groups of women, such as women with young children (WYC), are thought to be even less active [10]. In part, this may be due differences in the way physical activity is performed and thus measured.  L. M. Mac kay et al. / Open Journal of Preventive Medicine 1 (2011) 13-19 Copyright © 2011 SciRes. Openly accessible at http://www.scirp.org/journal/OJPM/ 14 Firstly, planned activities and those performed at vigor- ous-intensity are most memorable and are therefore more likely to be accurately recalled. Whereas, WYC are known to spend longer durations in total work (paid and unpaid) each day than men with young children (MYC) and women without young children (WNYC), poten- tially leaving less time for planned leisure [11]. This may also be the case for MYC compared to those without children (MNYC). Additionally, activities of WYC are often sporadic and performed simultaneously with other tasks, for example, carrying a child whilst vacuuming. These types of activities are regularly interrupted with needs of young children that need tending, and difficult to categorize and quantify through self-report [12]. Yet, accelerometers have the ability to record movement re- gardless of duration, intensity or purpose. It is possible therefore, that systematic differences in the validity of self-report tools may be present across major demo- graphics. A variety of self-report tools exist, and many studies have examined the validity of self-report tools using accelerometry as the criterion, or objective, measure of physical activity. Previously, discrepancies between ob- jective and subjective measures of physical activity have been shown within adult populations [13,14]; however it is unknown whether these discrepancies vary by certain demographic variables. If this were the case, it would have significant bearing on the selection of measurement tools dependent upon the population being studied. The International Physical Activity Questionnaire (IPAQ) was developed following an international collaboration to develop a standardized self-report measure of physical activity suitable for population-wide assessments of physical activity [15]. The IPAQ long form (IPAQ-LF) requires recall of physical activity engagement at mod- erate and vigorous intensities for occupational, transport, household, and leisure domains for a 7-day period (ei- ther usual or previous). This study examines the association between activity derived from the IPAQ-LF and concurrent accelerometer derived activity, and, the potential methodological im- pact on mis-measurement imposed by differences in sex and adults’ parenting status. The aims of this study were therefore to: 1) examine the level of association between self-reported and accelerometer assessed physical activ- ity engagement in a large sample of adults, and 2) de- termine differences in the level of association between measures among men and women with and without young children (aged 0 - 4 years). 2. METHODS Participants were part of the Understanding the Rela- tionship between Activity and Neighborhoods (URBAN) Study, a multi-centered, stratified, cross-sectional study of associations between physical activity, health, and the built environment in adults and children residing in New Zealand [16]. Objective and self-reported physical activ- ity engagement, neighborhood perceptions, demograph- ics, and body size measures were collected, along with built environment variables. The study contributes to a larger, international collaborative project where similar procedures are utilized across eight countries (www. ipenproject.org). 2.1. Participants Adults aged 20 to 65 years were recruited randomly from 48 neighborhoods (stratified by high/low walkabil- ity, high/low Māori population) across four New Zealand cities during 2008-2010. Trained interviews followed pre-determined walk paths for each neighborhood and approached every nth house, according to the neighbor- hood household sampling rate. One adult from each household was invited to participate. Further details of the neighborhood selection, recruitment methods, and sample power calculations have been described else- where [16]. 2.2. Data Collection Trained interviewers gained written informed consent and delivered accelerometers and travel/compliance logs during the first home visit. Eight days later, the inter- viewer visited the home a second time to collect the ac- celerometer and travel/compliance log, measure partici- pants’ height, weight, waist, and hip circumferences, and to administer the study questionnaire. 2.3. Measures A range of measures were utilized in the URBAN study. Those relevant to the current study are outlined below: 2.3.1. Objectively Assessed Physical Activity Hip-mounted Actical accelerometers (Mini-Mitter, Sunriver, OR) were used to objectively measure partici- pants’ physical activity. The units have been shown to be a reliable and valid measure of physical activity in adult populations [17,18]. Accelerometers were prepared to record physical activity and step counts in 30-second epochs. Participants were instructed to wear the unit for all waking hours (excluding water-based activities) for seven consecutive days. Participants self-completed a compliance log of wear-time and activities the partici- pant engaged in whilst not wearing units, for the dura- tion of accelerometer data collection period. The infor- mation derived from the log was checked and matched  L. M. Mac kay et al. / Open Journal of Preventive Medicine 1 (2011) 13-19 Copyright © 2011 SciRes. Openly accessible at http://www.scirp.org/journal/OJPM/ 15 15 against accelerometer data. 2.3.2. Self-Reported Physical Activity The International Physical Activity Questionnaire in long form (IPAQ-LF) was administered via interview at the second home visit to capture adults’ self-reported physical activity for the previous seven days (the period when the accelerometer was worn). The IPAQ-LF as- sesses frequency (days), duration (minutes), and inten- sity (walking, moderate, vigorous) of physical activity engagement across four domains: occupation, transpor- tation, household, and leisure. Moderate physical activ- ity was defined as “those activities that take moderate physical effort and make you breathe somewhat harder than usual”; vigorous physical activity as “those activi- ties that take hard physical effort and make you breathe much harder than normal” [19]. Evidence for the reli- ability and validity of this tool has been provided for 744 adults across 12 countries [15]. 2.3.3. Demographics Participants completed a demographic survey that in- cluded: gender, age, ethnicity, marital status, household income, academic qualifications, occupation, dwelling type, and the number and ages of children living in the dwelling. 2.4. Data Treatment 2.4.1. Self-Reported Physical Activity According to the IPAQ scoring protocol (www.ip aq . k i. se/), minutes of physical activity engagement from the IPAQ-LF were summed across activity domains for each level of intensity (walking, moderate, and vigorous). Mean daily minutes of moderate (sum of walking and moderate, MPA), vigorous (VPA), and sum of MPA and VPA (MVPA) activity engagement were calculated to minimize the effect of missing days of accelerometer data. 2.4.2. Objectively Assessed Physical Activity Accelerometer data were downloaded using Actical® version 2.04 (Mini-Mitter Co., Inc., Bend, OR, USA). Thresholds for MPA and VPA were generated by the Actical software and were based on MET-value based cutpoints. Data were prepared for analysis using SAS (version 9.1, SAS Institute Inc., Cary, NC, USA) and Microsoft Excel. Bouts of 60 or more consecutive min- utes of zero counts were considered non-wear-time and extracted prior to analysis [20]. Wear-time criteria for inclusion were defined as having five or more days of 10 or more hours of wear-time per day. Mean daily minutes of MPA, VPA, and MVPA activity were used in all ana- lyses to ensure comparability across the sample. Mean values for individuals were calculated using the number of days of accelerometer wear that met wear- time crite- ria. 2.5. Statistical An alyses All analyses were undertaken using SPSS (version 18) and statistical significance was set at α = 0.05. Shapiro- Wilk’s test of normality was conducted for both physical activity measures, and non-normal distributions were log transformed to achieve normality. Means and standard deviations were used to describe both methods of meas- urement for the whole sample and each demographic (WYC, women with young children [children aged 0 - 4 years]; MYC, men with young children; WNYC, women with no young children; MNYC, men with no young children). Commonly, correlation coefficients are used as a sin- gle score of validity between measures however it is appropriate to explore associations with a broader view. Firstly, a test of the differences between measurement means allows quantitative assessment of whether meth- ods are significantly different from each other. Secondly, a scatter plot of the two measures with the line of iden- tity provides visual assessment of linearity and system- atic or random bias in the relationship between measures. The correlation coefficient can then be calculated as a summary of the overall scatter between measures, indi- cating the strength of the linear relationship [21]. There- fore, paired t tests were used to compare means between methods, and linearity was explored by regressing mean minutes of activity at each intensity derived using the IPAQ-LF against mean minutes of Actical. Evaluation of linear relationships between Actical and IPAQ-LF using Pearson’s correlation were performed. Results are pre- sented for the whole sample and comparisons made be- tween demographic groups (WYC, MYC, WNYC, MNYC). 3. RESULTS 3.1. Participants A total of 2013 adults aged 20 to 65 years participated in the URBAN study between April 2008 and September 2010. Participants with missing demographic (n = 4) or IPAQ-LF (n = 5) data were excluded, as were partici- pants who did not meet criteria for accelerometer wear-time (n = 731). Outliers in IPAQ-LF data were calculated using interquartile range (IQR) computation, where any value more than 3 IQR above the third quar- tile were considered a problematic outlier (n = 24). Therefore data from 1249 participants were included in  L. M. Mac kay et al. / Open Journal of Preventive Medicine 1 (2011) 13-19 Copyright © 2011 SciRes. http://www.scirp.org/journal/OJPM/ 16 these analyses (Table 1). 3.2. Moderate Physical Activity Descriptive statistics, presented in Table 1, indicate that the IPAQ-LF reported significantly higher means of MPA engagement than the Actical (t = 2.104, p = 0.036). Additionally, standard deviations of the means were substantially greater for the IPAQ-LF indicating greater variance in self-reported activity levels. The scatter plot demonstrated a weak relationship between measures, as can be observed in Figure 1; whilst the regression line passes the line of identity (logny = lognx) near the means for both measures, the scatter indicates significant random bias. Further, evaluation of the linear relation- ship between methods indicated a weak association (r = 0.216, p = 0.000). Openly accessible at All demographic groups reported higher mean esti- mates of MPA by IPAQ-LF than measured by Actical, however these differences were only significant in MNYC (t = 2.680, p = 0.008). Weak associations be- tween methods were found for both WYC and WNYC (r = 0.124, p = 0.164 and r = 0.130, p = 0.002 respectively), while for MYC and MNYC a linear (albeit weak-mod- erate) relationship was found between measures (r = 0.265, p = 0.015 and r = 0.331, p < 0.001, respectively). 3.3. Moderate-to-Vigorous Physical Activity Actical derived MVPA increased marginally from MPA whereas IPAQ-LF MVPA values increased dispro- portionately indicating much greater vigorous activity via self-report compared with objective measurement (Ta b l e 1 ). As was observed with MPA, paired t test re- sults revealed significant differences between method means (t = –3.385, p = 0.001) and weak association be- tween methods (r = 0.260, p = 0.000). Scatter plots con- tinued to show significant random bias in self-report (Figure 2). All demographic groups self-reported more MVPA than recorded by accelerometer, and both male groups self-reported substantially greater VPA than either fe- male group. Significant differences were observed be- tween methods for MVPA means for MYC, and WNYC, but not for WYC or MNYC. Methods were moderately correlated for MVPA for both male groups (r = 0.337, p = 0.002 and r = 0.366, p < 0.001, respectively) yet both female groups showed similarly weak associations (r = Figure 1. Association between self-report and ac- celerometer derived MPA for the whole sample. Note: dashed line represents line of identity; solid line represents linear regression line. Table 1. Participant characteristics and descriptive statistics of IPAQ-LF and Actical measures. 8 Total sample N = 1249 WYC N = 128 MYC N = 84 WNYC N = 588 MNYC N = 449 Age 18 - 25 121 10 8 50 53 26 - 35 254 52 32 93 77 36 - 45 353 55 34 161 103 46 - 55 301 6 9 175 111 56 - 65 213 4 1 106 102 Missing 7 1 0 3 3 Height cm* 169.32 ± 9.83 164.80 ± 6.96 177.99 ± 6.12 163.55 ± 7.70 176.53 ± 7.41 Weight kg* 76.51 ± 17.24 72.31 ± 18.42 85.67 ± 13.53 70.16 ± 15.62 84.15 ± 15.68 BMI kg/m2* 26.70 ± 8.26 26.49 ± 5.85 26.90 ± 3.81 26.52 ± 10.98 26.95 ± 4.51 Moderate physical activity Actical (min·day–1)* 106.51 ± 57.61 104.79 ± 56.79 114.31 ± 56.79 101.31 ± 53.60 112.36 ± 62.33 IPAQ-LF (min·day–1)* 134.91 ± 128.35 132.05 ± 111.40 180.65 ± 185.37 125.36 ± 137.90 139.68 ± 137.90 Correlation R = 0.216, p < 0.001 R = 0.124, p = 0.164R = 0.265, p = 0.015R = 0.130, p = 0.002 R = 0.331, p < 0.001 T-test t = 2.104, p = 0.036 t = –0.205, p = 0.838t = –0.111, p = 0.912t = 0.893, p = 0.372 t = 2.680, p = 0.008 Moderate-vigorous physical activity Actical (min·day–1)* 106.75 ± 57.91 104.93 ± 56.86 114.52 ± 57.04 101.48 ± 53.77 112.72 ± 62.85 IPAQ-LF (min·day–1)* 160.66 ± 157.98 140.21 ± 115.72 227.24 ± 234.39 140.56 ± 122.96 180.36 ± 184.03 Correlation R = 0.260, p = 0.000 R = 0.161, p = 0.069R = 0.337, p = 0.002R = 0.167, p = 0.000 R = 0.366, p = 0.000 T-test t = –3.385, p = 0.001 t = –1.144, p = 0.255t = –2.533, p = 0.013t = –2.060, p = 0.040 t = –1.596, p = 0.111 *Values are presented as Mean ± Standard Deviation. 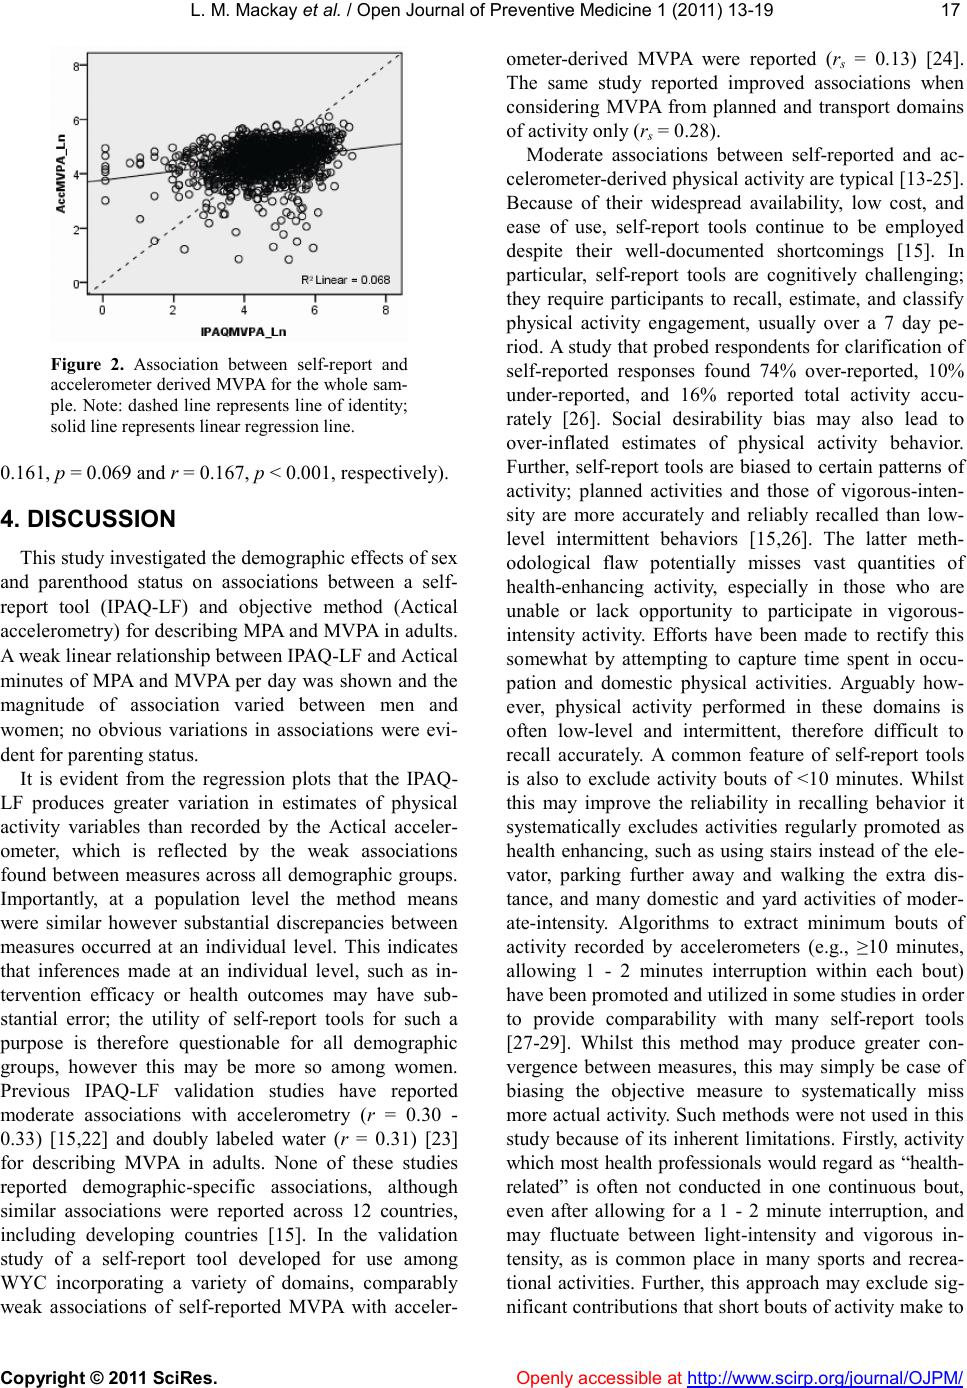 L. M. Mac kay et al. / Open Journal of Preventive Medicine 1 (2011) 13-19 Copyright © 2011 SciRes. Openly accessible at http://www.scirp.org/journal/OJPM/ 17 17 Figure 2. Association between self-report and accelerometer derived MVPA for the whole sam- ple. Note: dashed line represents line of identity; solid line represents linear regression line. 0.161, p = 0.069 and r = 0.167, p < 0.001, respectively). 4. DISCUSSION This study investigated the demographic effects of sex and parenthood status on associations between a self- report tool (IPAQ-LF) and objective method (Actical accelerometry) for describing MPA and MVPA in adults. A weak linear relationship between IPAQ-LF and Actical minutes of MPA and MVPA per day was shown and the magnitude of association varied between men and women; no obvious variations in associations were evi- dent for parenting status. It is evident from the regression plots that the IPAQ- LF produces greater variation in estimates of physical activity variables than recorded by the Actical acceler- ometer, which is reflected by the weak associations found between measures across all demographic groups. Importantly, at a population level the method means were similar however substantial discrepancies between measures occurred at an individual level. This indicates that inferences made at an individual level, such as in- tervention efficacy or health outcomes may have sub- stantial error; the utility of self-report tools for such a purpose is therefore questionable for all demographic groups, however this may be more so among women. Previous IPAQ-LF validation studies have reported moderate associations with accelerometry (r = 0.30 - 0.33) [15,22] and doubly labeled water (r = 0.31) [23] for describing MVPA in adults. None of these studies reported demographic-specific associations, although similar associations were reported across 12 countries, including developing countries [15]. In the validation study of a self-report tool developed for use among WYC incorporating a variety of domains, comparably weak associations of self-reported MVPA with acceler- ometer-derived MVPA were reported (rs = 0.13) [24]. The same study reported improved associations when considering MVPA from planned and transport domains of activity only (rs = 0.28). Moderate associations between self-reported and ac- celerometer-derived physical activity are typical [13-25]. Because of their widespread availability, low cost, and ease of use, self-report tools continue to be employed despite their well-documented shortcomings [15]. In particular, self-report tools are cognitively challenging; they require participants to recall, estimate, and classify physical activity engagement, usually over a 7 day pe- riod. A study that probed respondents for clarification of self-reported responses found 74% over-reported, 10% under-reported, and 16% reported total activity accu- rately [26]. Social desirability bias may also lead to over-inflated estimates of physical activity behavior. Further, self-report tools are biased to certain patterns of activity; planned activities and those of vigorous-inten- sity are more accurately and reliably recalled than low- level intermittent behaviors [15,26]. The latter meth- odological flaw potentially misses vast quantities of health-enhancing activity, especially in those who are unable or lack opportunity to participate in vigorous- intensity activity. Efforts have been made to rectify this somewhat by attempting to capture time spent in occu- pation and domestic physical activities. Arguably how- ever, physical activity performed in these domains is often low-level and intermittent, therefore difficult to recall accurately. A common feature of self-report tools is also to exclude activity bouts of <10 minutes. Whilst this may improve the reliability in recalling behavior it systematically excludes activities regularly promoted as health enhancing, such as using stairs instead of the ele- vator, parking further away and walking the extra dis- tance, and many domestic and yard activities of moder- ate-intensity. Algorithms to extract minimum bouts of activity recorded by accelerometers (e.g., ≥10 minutes, allowing 1 - 2 minutes interruption within each bout) have been promoted and utilized in some studies in order to provide comparability with many self-report tools [27-29]. Whilst this method may produce greater con- vergence between measures, this may simply be case of biasing the objective measure to systematically miss more actual activity. Such methods were not used in this study because of its inherent limitations. Firstly, activity which most health professionals would regard as “health- related” is often not conducted in one continuous bout, even after allowing for a 1 - 2 minute interruption, and may fluctuate between light-intensity and vigorous in- tensity, as is common place in many sports and recrea- tional activities. Further, this approach may exclude sig- nificant contributions that short bouts of activity make to  L. M. Mac kay et al. / Open Journal of Preventive Medicine 1 (2011) 13-19 Copyright © 2011 SciRes. Openly accessible at http://www.scirp.org/journal/OJPM/ 18 overall daily physical activity. It is likely that patterns of activity may contribute to the sex effects observed in this study. Particularly, women (both with and without young children) may be more likely to perform low-level intermittent activity than engage in planned bouts of vigorous-intensity activ- ity, potentially producing greater variability in reporting. It appears that sex has a greater effect on self-report ac- curacy than parent status; this may be due to the pres- ence of confounding factors such as parental employ- ment, presence of older children, socioeconomic status, and marital status. The IPAQ battery of questionnaires were developed in an attempt to provide a standardized self-report tool suitable for population estimates of the prevalence of physical activity so that comparisons be- tween countries may be made [15]. Whilst there is some merit in this purpose at a population level, the applica- tion of self-report tools to determine health outcomes of physical activity behavior is inappropriate. The present study has concurred with previous research demonstrat- ing a weak-to-moderate association between self-re- ported and accelerometer derived behavior [13,14]. Im- portantly however, this research further shows that the ability of self-report tools to capture overall activity is particularly weak among women, probably due to lower levels of planned moderate- to vigorous-intensity activity. With greater emphasis now being placed on measuring physical activity across the spectrum it is important that measurement tools are capable of doing so accurately. The strengths of this study include its large heteroge- neous sample with a spread of demographics providing adequate variations in physical activity for exploring associations across a full range of activity levels. It ap- pears that the sample in this study were highly active, although this is an acknowledged outcome of the IPAQ- LF given the number of domains considered [15]. A li- mitation of the study is that it was not methodologically designed for measurement tool validation, reflected by the high proportion of participants that were excluded due to inadequate accelerometer wear-time. This study demonstrates substantial discrepancies between self- report tools (specifically the IPAQ-LF) and accelerome- ter derived physical activity. Findings indicate that self- report tools provide a poor proxy of human movement, especially among women. Careful consideration must be given to the patterns of activity in the intended study population and the purpose of measurement. 5. ACKNOWLEDGEMENTS The URBAN study was supported by a three-year research grant from the Health Research Council of New Zealand. At the time of writing, MO was supported by a National Heart Foundation of New Zealand Research Fellowship. REFERENCES [1] Warburton, D., Charlesworth, S., Ivey, A., et al. (2010) A systematic review of the evidence for Canada’s Physical Activity Guidelines for Adults. International Journal of Behavioral Nutrition and Physical Activity, 7, 39. doi:10.1186/1479-5868-7-39 [2] Hamilton, M.T., Hamilton, D.G. and Zderic, T.W. (2007) Role of low energy expenditure and sitting in obesity, metabolic syndrome, type 2 diabetes, and cardiovascular disease. Diabetes, 56, 2655-2667. do i:1 0. 23 37 / db 07 - 08 82 [3] Katzmarzyk, P.T., Church, T.S., Craig, C.L., et al. (2009) Sitting time and mortality from all causes, cardiovascular disease, and cancer. Medicine and Science in Sports and Exercise, 41, 998-1005. doi:10.1249/MSS.0b013e3181930355 [4] Levine, J.A., McCrady, S.K., Lanningham-Foster, L.M., et al. (2008) The role of free-living daily walking in hu- man weight gain and obesity. Diabetes, 57, 548-554. do i:1 0. 23 37 / db 07 - 08 15 [5] Levine, J.A., Schleusner, S.J. and Jensen, M.D. (2000) Energy expenditure of nonexercise activity. American Journal of Clinical Nutrition, 72, 1451-1454. [6] Brown, W.J., Bauman, A.E. and Owen, N. (2009) Stand up, sit down, keep moving: Turning circles in physical activity research? British Journal of Sports Medicine, 43, 86-88. doi:10.1136/bjsm.2008.055285 [7] Hallal, P. and Ekelund, U. (2010) CRF, MVPA, NEAT, PAEE, and now sedentary time: Will the pendulum swing back again? Journal of Physical Activity and Health, 7, 569-570. [8] Welk, G.J. (2002) Physical activity assessments for health- related research. Human Kinetics, Champaign. [9] Bauman, A., Bull, F., Chey, T., et al. (2009) The interna- tional prevalence study on physical activity: Results from 20 countries. International Journal of Behavioral Nutri- tion and Physical Activity, 6, 21. doi:10.1186/1479-5868-6-21 [10] Bellows-Riecken, K.H. and Rhodes, R.E. (2008) A birth of inactivity? A review of physical activity and parent- hood. Preventive Medicine, 46, 99-110. doi:10.1016/j.ypmed.2007.08.003 [11] Craig, L. and Bittman, M. (2008) The incremental time costs of children: An analysis of children’s impact on adult time use in Australia. Feminist Economics, 14, 59-88. doi:10.1080/13545700701880999 [12] Collins, B.S., Marshall, A.L. and Miller, Y.D. (2007) Physical activity in women with young children: How can we assess “anything that’s not sitting”? Women and Health, 45, 95-116. doi:10.1300/J013v45n02_06 [13] Prince, S.A., Adamo, K.B., Hamel, M.E., et al. (2008) A comparison of direct versus self-report measures for as- sessing physical activity in adults: A systematic review. International Journal of Behavioral Nutrition and Phys- ical Activity, 5, 56. doi:10.1186/1479-5868-5-56 [14] Mackay, L.M., Schofield, G.S. and Schluter, P.J. (2007) Validation of self-report measures of physical activity: A case study using the New Zealand Physical Activity  L. M. Mac kay et al. / Open Journal of Preventive Medicine 1 (2011) 13-19 Copyright © 2011 SciRes. http://www.scirp.org/journal/OJPM/Openly accessible at 19 19 Questionnaire. Research Quarterly for Exercise and Sport, 78, 189-196 [15] Craig, C.L., Marshall, A.L., Sjostrom, M., et al. (2003) International physical activity questionnaire: 12-country reliability and validity. Medicine and Science in Sports and Exercise, 35, 1381-1395. doi:10.1249/01.MSS.0000078924.61453.FB [16] Badland, H., Schofield, G., Witten, K., et al. (2009) Under- standing the Relationship between Activity and Neigh- bourhoods (URBAN) Study: Research design and meth- odology. BMC Public Health, 9, 224. doi:10.1186/1471-2458-9-224 [17] Heil, D.P. (2006) Predicting activity energy expenditure using the Actical activity monitor. Research Quarterly for Exercise and Sport, 77, 64-80. [18] Welk, G.J. (2002) Use of accelerometry-based activity monitors to assess physical activity. In: Welk, G.J. Ed., Use of accelerometry-based activity monitors to assess physical activity, Human Kinetics, Champaign, 125-142. [19] IPAQ Group (2002) International Physical Activity Questionnaire: Long last 7 days telephone format. www.ipaq.ki.se [20] Oliver, M., Schofield, G.M., Badland, H., et al. (in press) Identification of non-wear time and sedentary behavior using accelerometry. Research Quarterly for Exercise and Sport. [21] Hopkins, W.G. (2010) A Socratic dialogue on comparison of measures. Sport Science, 14, 15. [22] Boon, R.M., Hamlin, M.J., Steel, G.D., et al. (2010) Va- lidation of the New Zealand Physical Activity Question- naire (NZPAQ-LF) and the International Physical Activ- ity Questionnaire (IPAQ-LF) with accelerometry. British Journal of Sports Medicine, 44, 741-746. doi:10.1136/bjsm.2008.052167 [23] Maddison, R., Ni M., C., Jiang, Y., et al. (2007) Interna- tional Physical Activity Questionnaire (IPAQ) and New Zealand Physical Activity Questionnaire (NZPAQ): A doubly labelled water validation. International Journal of Behavioral Nutrition and Physical Activity, 4, 62. doi:10.1186/1479-5868-4-62 [24] Fjeldsoe, B.S., Marshall, A.L. and Miller, Y.D. (2009) Measurement properties of the Australian Women’s Ac- tivity Survey. Medicine and Science in Sports and Exer- cise, 41, 1020-1033. doi:10.1249/MSS.0b013e31819461c2 [25] Sallis, J.F. and Saelens, B.E. (2000) Assessment of phys- ical activity by self-report: Status, limitations, and future directions. Research Quarterly for Exercise and Sport, 71, 1-14. [26] Rzewnicki, R., Vanden Auweele, Y. and De Bourdeaud- huij, I. (2003) Addressing overreporting on the Interna- tional Physical Activity Questionnaire (IPAQ) telephone survey with a population sample. Public Health Nutrition, 6, 299-305. doi:10.1079/PHN2002427 [27] Masse, L., Fuemmeler, B.F., Anderson, C., et al. (2005) Accelerometer data reduction: A comparison of four re- duction algorithms on select outcome variables. Medicine and Science in Sports and Exercise, 37, S544-S554. doi:10.1249/01.mss.0000185674.09066.8a [28] Troiano, R.P., Berrigan, D., Dodd, K.W., et al. (2008) Physical activity in the United States measured by accel- erometer. Medicine and Science in Sports and Exercise, 40, 181-188. [29] Ward, D.S., Evenson, K.R., Vaughn, A., et al. (2005) Accelerometer use in physical activity: Best practices and research recommendations. Medicine and Science in Sports and Exercise, 37, S582-S588. doi:10.1249/01.mss.0000185292.71933.91
|