 Vol.1, No.2, 25-33 (2011) doi:10.4236/ojpm.2011.12005 Copyright © 2011 SciRes. Openly accessible at http://www.scirp.org/journal/OJPM/ Open Journal of Preventive Medicine Obesogenic behaviors in US school children across geographic regions from 2003-2007 Susan B. Sisson1*, Stephanie T. Broyles2, Danielle R. Brittain3, Kevin Short1 1University of Oklahoma Health Sciences Center, Oklahoma City, USA; *Corresponding author: susan-sisson@ouhsc.edu 2Pennington Biomedical Research Center, Baton Rouge, USA; 3University of Northern Colorado, Greeley, USA. Received 5 May 2011; revised 14 July 2011; accepted 31 July 2011. ABSTRACT Background: increasing levels of obesity are likely associated with obesogenic behaviors such as physical activity (PA) and media time. Examination of regional and state differences in meeting recommendations for obesogenic be- haviors would be useful for understanding con- current variations in prevalence of childhood obesity. Therefore the purpose of this study was to analyze the prevalence of boys and girls meeting vigorous physical activity (VPA), daily media (TV/video viewing/video game playing) recommendations, and association with over- weight and obesity across regions of the US between 2003 and 2007. Methods: data from the 2003 and 2007 National Survey of Children’s Health (n = 109,151; 55,540 in 2003 and 53,611 in 2007; 51.3% boys, mean (SE) age 11.5 (0.02) years) were used. Prevalence of meeting week- day media (≤2 hr/day) and VPA (≥3 days/week of minimum 20 minutes) recommendations were calculated. Logistic regression analyses were used to examine differences across regions, dates, sexes, and obesity status. Results: in 2007, the range for met the recommendations among regions was 74.2% - 82.1% for VPA and 77.2% - 83.7% for media viewing. The regions with the highest positive behavior levels were Alaska and Hawaii for VPA and both the North- east and West regions for media viewing. In 2007 fewer children met media viewing recom- mendations than in 2003 (78.3% versus 83.6%, respectively, p < 0.0001) but those meeting VPA recommendations increased (74.6% versus 79.2%, p < 0.0001). In most states girls were less likely to meet VPA guidelines, and boys were less likely to meet media guidelines. The adjusted odds of being overweight or obese, in those children aged 10 years and older, were 1.13 (95% CI: 1.05, 1.21) for 0 - 2 days/wk of VPA versus 3 - 7 days/wk and 1.27 (1.17, 1.37) for > 2hr/day ver- sus ≤ 2 hr/day of media time. Further, the inter- action between media time and VPA had a sig- nificant (p < 0.0001) association with being overweight or obese. Conclusions: obesogenic behaviors vary by region in the US, appear to be changing over time, and are associated over- weight and obesity status, though differences between boys and girls are stable. Keywords: Media Time; Vigorous Physical Activity; Behavioral Epidemiology; Trends; Geographic Diff er ences 1. INTRODUCTION In 2007-2008, nearly one-third (31.7%) of children in the US were overweight or obese (≥85th percentile for height and weight), a significant increase from previous decades [1,2]. The prevalence of overweight status var- ies across geographical regions, with higher rates in Southeastern states (41.3%) and lower rates in the Cen- tral Rocky Mountain states (28.1%) [3]. The differences in obesity rates across regions may reflect corresponding variation in obesogenic behaviors. Behaviors such as physical activity (PA) [4-6] and television (TV) viewing [7-10] have been shown to have independent and combined [11-14] impacts on over- weight and obesity. Examination of regional and state differences in meeting recommendations for obesogenic behaviors would be useful for understanding concurrent variations in prevalence of childhood obesity and pro- viding support for lifestyle behavior change research and interventions [3]. Daily lifestyle behaviors such as PA and TV viewing are often used in obesity prevention strategies. Differences in PA and TV between boys and girls have been well established [15,16] and may play  S. B. Sisson et al. / Open Journal of Preventive Medicine 1 (2011) 25-33 Copyright © 2011 SciRes. Openly accessible at http://www.scirp.org/journal/OJPM/ 26 critical roles in the targeted health behavior change. Re- cent research from Whitt-Glover [17] reports sex differ- ences in the social-ecological correlates of PA and sed- entary behaviors. With different individual, family and community variables associated with participation in obesogenic behaviors between boys and girls, interven- tions must be designed to address the appropriate target behaviors, policies and environmental constructs. To examine whether children’s PA, operationalized as vigorous physical activity (VPA), and TV viewing vary among regions of the US and whether these behaviors have changed, at the population level, over time, we analyzed data from the National Survey of Children’s Health (NSCH). NSCH was designed to produce state and national prevalence estimates for a variety of physi- cal, emotional, and behavioral health indicators in chil- dren 0 to 18 years of age [18]. Separate surveys were administered in a similar manner in 2003 and 2007, permitting a cross-sectional examination of changes in obesogenic behaviors over this time. The purpose of this study was to determine the prevalence of children ages 6 to 18 years old in the NSCH who achieved the recom- mended amount of weekly VPA and/or daily media (TV/ video viewing/video game playing). Further, we exam- ined whether the prevalence of these behaviors varied 1) across geographic regions of the US, 2) between boys and girls, and 3) between 2003 and 2007, and 4) their association with overweight status. We hypothesize that there will be geographic, gender and survey year differ- ences in obesogenic behaviors. Since the prevalence of obesity has been reported to be on the rise [1,2] it is logical to presume that from 2003 to 2007 changes in obesogenic behaviors would support this shift (i.e., higher daily media and lower VPA). 2. METHODS Data from the 2003 and 2007 National Survey of Children’s Health (NSCH) were used for this study. The NSCH was sponsored by the Maternal and Child Health Bureau and the National Center for Health Statistics [18-21]. Telephone interviews were conducted using computer assisted telephone interviewing technology between January 2003 and July 2004 and April 2007 and July 2008 with the parent or guardian who knew most about a specific randomly-selected child. The NSCH data are freely available online (http://www.cdc.gov/ nchs/about/major/slaits/nsch.htm) [19,20]. NCHS Re- search Ethics Review Board approved these procedures. The analytic sample size for the current study was 109,151 children (55,540 in 2003 and 53,611 in 2007; 51.3% boys, mean (SE) age 11.5 (0.02) years). Inclusion criteria were being six years of age or older, attending public or private school (i.e., not home-schooled or not enrolled in school), and having no missing values for variables of interest. Demographic and descriptive char- acteristics used as covariates included age, sex, ethnicity (Non-Hispanic White [NHW], Non-Hispanic Black [NHB], Hispanic, and other), poverty (≤100%, 101% - 299%, ≥300%), family structure (two parent biologi- cal/adopted, two parent step family, single mother, other). Parent-reported body mass index (BMI) data were available only on those aged 10 and older [18] and were classified according to Center for Disease Control per- centiles for overweight (≥85th percentile) and obesity (≥ 95th percentile) [22]. There were minor changes in the questions used to query daily behaviors over time. In 2003, the daily me- dia question was: “On an average school day, about how many hours does [child] usually watch TV, watch videos, or play video games?” In 2007, the wording of the ques- tion was revised to ask: “On an average weekday, about how many hours does [child] usually watch TV, watch videos, or play video games?” Responses were in num- ber of hours per day in both surveys. The American Academy of Pediatrics’ media recommendation of ≤2 hr/day was used for the current analyses [23]. In both 2003 and 2007, the question on VPA was: “During the past week, on how many days did [child] exercise or participate in a physical activity for at least 20 minutes that made [him/her] sweat and breathe hard?” In 2003, some examples of activities were included along with the question, but in 2007 the list of activities was used only in case of extra explanation. Responses for the VPA question were recorded as the number of days per week. The VPA recommendation level for the current analyses was defined as ≥3 days/week of at least 20 minutes of activity. We chose this criterion to be congruent with the recommendation for vigorous PA in the Federal Physical Activity Guidelines, which is 60 minutes per week [24]. The region of the country was recorded as Northeast, Midwest, South-Atlantic, South-Central, West, Alaska, and Hawaii. This assignment was based primarily on the four areas defined by the US Census Bureau [25]. There was a sum of 50 states plus Washington DC yielding 51 municipalities. Data analyses were performed using logistic regres- sion (PROC SURVEY LOGISTIC) to account for com- plex sampling designs and participant weights. A series of logistic regression models were used to answer whether there was regional variation in obesogenic be- haviors. Since boys and girls have different patterns of VPA and media as previously reported [15,16], all analyses were conducted stratified by sex. The first model produced crude odds ratios by examining only the obesogenic behavior (i.e., media or VPA) and correlate (i.e., region of U.S.) of interest. Model 2 adjusted for  S. B. Sisson et al. / Open Journal of Preventive Medicine 1 (2011) 25-33 Copyright © 2011 SciRes. Openly accessible at http://www.scirp.org/journal/OJPM/ 27 27 potential confounders—age, ethnicity, sex, poverty level and survey year (2003 and 2007). The referent region was selected to be that with the highest prevalence of meeting the recommendation. For VPA, the referent was Alaska and for media, the referent was the West region. Wald Chi Square tests generated were used to determine if obesogenic behaviors varied across regions, between 2003 and 2007, and between boys and girls, and if there was a year-by-sex interaction. To examine the associa- tion of these obesogenic behaviors with weight status, adjusted odds of being overweight or obese were calcu- lated for those 10 years and older (BMI was only avail- able for 10 - 18 year olds; total n = 75,427, 2003 n = 38,081, 2007 n = 37,346) for the interaction between media time and VPA for each state. Additionally, ad- justed prevalence of combined overweight and obesity was calculated. SAS 9.2 software and procedures were used with weights and complex study design strata and cluster variables provided by NSCH. To geographically examine the relationship between the prevalence of meeting media or VPA recommenda- tions and whether or not that prevalence changed from 2003 to 2007, each state was classified discretely into one of six categories by subtracting the 2003 prevalence from the 2007 prevalence. A high or low prevalence of meeting media and VPA recommendations in 2007 was defined by being above or below the median prevalence for each behavior. Having a stable prevalence from 2003 to 2007 was defined as being within two percentage points, while increasing or decreasing prevalence was defined as a change of more than two percentage points. Each discrete category of high or low prevalence and change from 2003 to 2007 was calculated for boys and girls and media and VPA separately and integrated with ArcGIS to create four maps that present each state’s prevalence of obesogenic behavior and how that behav- ior has changed from 2003 to 2007. 3. RESULTS Descriptive characteristics of the total sample for 2003 and 2007 are available in Tab le 1. The prevalence of children in the U.S. meeting the American Academy of Pediatrics recommendations for media time (≤2 hr/day) on weekdays was 80.9% for the combined sam- ple, and decreased from 83.6% in 2003 to 78.3% in 2007 (p < 0.0001; Figure 1). For VPA, 76.9% of the com- bined sample met the recommendation (≥3 days/week of minimum 20 minutes of vigorous activity), although this prevalence increased from 74.6% in 2003 to 79.2% in 2007 (p < 0.0001; Figure 1). When meeting VPA and media recommendations were combined for 2007, 63.7% of children met both media and VPA recommend- dations while 6.2% met neither. Approximately 16% met Table 1. Descriptive characteristics of the combined sample, 2003 survey and 2007 survey for children aged 6 - 18 in the National Survey of Children’s Health. Va ri ab le Total Sample (n = 109,151) 2003 only (n = 55,540) 2007 only (n = 53,611) Age yr (SE) 11.5 (0.02) 11.5 (0.02) 11.6 (0.04) Male (%) 51.3 51.4 51.3 Ethnicity (%) NHW 66.1 69.4 63.0 NHB 15.6 14.9 16.2 Hispanic 9.9 8.1 11.7 Other 8.4 7.6 9.1 Poverty level (%) <100% 13.9 13.4 14.4 100% - 299% 38.2 38.8 37.6 ≥300% 47.9 47.8 48.0 Family structure (%) 2 biological or adop- tive parents 60.8 58.7 62.7 2 parent-blended families 11.6 12.4 10.7 Single parent 21.7 23.9 19.6 Other 6.0 5.0 7.0 Volume of media per day (%) None/day 6.4 7.2 5.6 <1 hour/day 16.1 16.8 15.4 ≥1 hr and ≤2 hr/day58.4 59.6 57.2 >2 hr/day 19.1 16.4 21.7 Meeting media recommendation (%) ≤2 hr/day (yes) 80.9 83.6 78.3 >2 hr/day (no) 19.1 16.4 21.7 Child has rules about TV (%) 86.3 86.1 86.6 Vigorous physical activity per week (%) 0 - 1 days/week 13.4 14.9 12.0 2 - 3 days/week 23.5 25.2 21.9 4 - 5 days/week 29.3 29.3 29.4 6 - 7 days/week 33.8 30.7 36.7 Meeting Vigorous physical activity recommendation (%) 0 - 2 days/week (no)23.1 25.4 20.9 3 - 7 days/week (yes)76.9 74.6 79.2 the VPA recommendations but not the media and 15% met the media recommendations but not the VPA. The prevalence of children meeting VPA and media recommendations ranged from 74.2% - 82.1% and 77.2% - 83.7%, respectively, across regions of the coun- try (Ta bl e 2). Table 2 also contains the prevalence esti- mates and odds ratios (95% confidence intervals) for the crude and adjusted (age, ethnicity, sex, poverty level, survey year) logistic regression models for each region of the US for both obesogenic behaviors. For VPA, at the population level (Model 1), Midwest (OR; 95% CI; 0.76; 0.65 - 0.88), Northeast (0.63; 0.54 - 0.73), South Atlantic (0.70; 0.60, 0.81), South Central (0.76; 0.65, 0.89), and West regions (0.79; 0.67, 0.94) had a lower likelihood of meeting recommendations of being active for at least 20 minutes ≥3 days per week compared with Alaska  S. B. Sisson et al. / Open Journal of Preventive Medicine 1 (2011) 25-33 Copyright © 2011 SciRes. Openly accessible at http://www.scirp.org/journal/OJPM/ 28 Figure 1. Prevalence of meeting me- dia and activity recommendation by gender in 2003 and 2007. Table 2. Prevalence estimates and odds ratios for meeting vig- orous physical activity (≥3 day/wk) and media (≤2 hr/day) recommendations by region of the US for children. Va ri ab le s Prevalence Estimate Model 1 OR (95% CI) Model 2 OR (95% CI) 3 – 7 day/wk physical activity Region Alaska 82.1% referent referent Hawaii 80.5% 0.90 (0.75, 1.09) 0.97 (0.79, 1.19) West 78.4% 0.79 (0.67, 0.94)* 0.79 (0.66, 0.94)* South Central 77.7% 0.76 (0.65, 0.89)* 0.77 (0.65, 0.91)* Midwest 77.6% 0.76 (0.65, 0.88)* 0.69 (0.59, 0.81)* South Atlantic 76.2% 0.70 (0.60, 0.81)* 0.67 (0.57, 0.78)* Northeast 74.2% 0.63 (0.54, 0.73)* 0.57 (0.49, 0.67)* ≤2 hr media Region West 83.7% referent referent Northeast 83.3% 0.97 (0.85, 1.11) 0.98 (0.85, 1.11) Alaska 83.1% 0.96 (0.80, 1.16) 0.97 (0.80, 1.17) Midwest 81.0% 0.83 (0.74, 0.94)* 0.85 (0.75, 0.96)* Hawaii 80.9% 0.83 (0.69, 0.99)* 0.84 (0.69, 1.02) South Atlantic 78.9% 0.73 (0.64, 0.83)* 0.88 (0.77, 1.01) South Central 77.2% 0.66 (0.58, 0.75)* 0.81 (0.70, 0.93)* *Denotes significance. Listed in order of highest to lowest prevalence of meeting VPA or media recommendations. Model 1 includes region of coun- try only for crude odds ratios. Model 2 includes region of country and covariates (age, ethnicity, sex, poverty level, survey year) for adjusted odds ratios. States in the West include AZ, CA, CO, ID, MT, NV, NM, OR, UT, WA, and WY; Northeast include ME, NH, VT, MA, RI, CT, NY, NJ, and PA; Midwest include IL, IN, IA, KS, MI, MN, MO, NE, ND, SD, OH, and WI; South Atlantic include FL, GA, NC, SC, VA, WV, MD, DC, and DE; South Central include AL, KY, MS, TN, AR, LA, OK and TX. (referent). These findings were similar even after ac- counting for regional differences in the demographic characteristics of the children sampled (Model 2). For media, at the population level (Model 1), Midwest (0.83; 0.74 - 0.94), Hawaii (0.83; 0.69 - 0.99), South Atlantic (0.73; 0.64 - 0.83) and South Central (0.66; 0.58 - 0.75) regions had lower likelihood of meeting recommenda- tions of ≤2 hr/day compared to the West (referent). However, after adjusting for regional demographic dif- ferences (Model 2), only Midwest (0.85; 0.75 - 0.96) and South Central (0.81; 0.70 - 0.93) had lower likelihood of meeting recommendations. Figure 2 depicts, for each state, the 2007 prevalence of meeting media (panels A-B) and VPA recommenda- tions (panels C-D) and change in prevalence from 2003 to 2007 for boys and girls separately. The state-by-state prevalence estimates of meeting VPA and media rec- ommendations for boys and girls and by year are shown in Ta b l e 3 (VPA) and Ta bl e 4 (media). The prevalence of children meeting media recommendations decreased in most states (34/51 states for girls and 40/51 states for boys), while the prevalence of meeting VPA recommen- dations was either stable (11/51 states for girls and 19/51 states for boys) or increasing (39/51 states for girls and 31/51 states for boys) from 2003 to 2007. For both sur- vey years combined, girls were more likely than boys to meet media recommendations (i.e., boys were more likely to exceed 2 hours per day, p < 0.0001). This dif- ference between girls and boys in media time did not change over the two survey years (p = 0.59). In contrast, girls were less likely to meet VPA recommendations (i.e., girls were more likely to perform less than 3 days per week of VPA, p < 0.0001). This difference between boys versus girls in meeting VPA recommendations did not change over the two survey years (p = 0.62), as depicted in Figure 1. Within individual states, the interaction between sex and survey year only reached significance for South Carolina for prevalence of meeting VPA recommenda- tions and in Virginia for prevalence of meeting media recommendations. In South Carolina, the prevalence of meeting VPA recommendations increased from 2003 to 2007 for girls (63.3% to 76.6%) and slightly decreased for boys (80.2% to 79.9%). In Virginia, the prevalence of meeting media recommendations increased (80.4% to 81.5%) for boys and decreased for girls (86.3% to 77.4%). There were no significant interactions between sex and survey year within any of the national regions. The adjusted odds of being overweight or obese, in those children aged 10 years and older, were 1.13 (95% CI: 1.05,1.21) for 0 - 2 days/wk of VPA versus 3 - 7 days/wk and 1.27 (95% CI: 1.17,1.37) for >2hr/day ver- sus ≤2 hr/day of media time. Prevalence of overweight and obesity is presented along state-by-state obesogenic behaviors in Table 3. Further, the interaction between media time and VPA had a significant (β = 0.40 ± 0.06 SE, χ2 = 39.95, p < 0.0001) association with being over- eight or obese for the nation. When each state was w  S. B. Sisson et al. / Open Journal of Preventive Medicine 1 (2011) 25-33 Copyright © 2011 SciRes. http://www.scirp.org/journal/OJPM/ 29 29 Figure 2. Change in meeting media and vigorous physical activity recommendations in boys (A&C) and girls (B&D) from 2003- 2007. examined individually, 13 of the 51 states had a signifi- cant interaction between media and VPA on overweight and obesity status; available for relevant states in Table Openly accessible at 5. 4. DISCUSSION The primary finding of this study was that there are regional and gender differences in the prevalence of meeting VPA (≥3 days/week of minimum 20 minutes) and media (≤2 hr/day) recommendations in children aged 6 to 18 years in the US Girls were more likely to meet the media recommendation but not VPA. Further- more, there were changes in the prevalence of meeting media and VPA recommendations between survey years 2003 and 2007. Generally, the prevalence of meeting VPA recommendations was stable or increased while the prevalence of meeting media recommendations de- creased. Obesogenic behaviors were also significantly associated with overweight status for the nation as a whole and for some individual states. These obesogenic behaviors individually and com- bined were associated with overweight status for the nation as a whole and for some states, but not every in- dividual state. These findings support some, [10,11,13] but not all, previous studies [26]. The regional differ- ences in obesogenic behaviors shown in the present study may partially explain the geographic variations in children’s overweight status; states that have a higher prevalence of meeting recommendations may have lower levels of overweight and obesity [3]. For example, in 2007 69% boys in Mississippi, met TV viewing and 81% met VPA recommendations concurrent prevalence of overweight of obesity was 45.1% (approximately 15% higher than the national average). In 2007, 85% of boys in Vermont met media and 87% met VPA recommenda- tions. Concurrent prevalence of overweight and obesity was 25.1% (approximately 6% lower than national av- erage). These data are examples of the geographic dis- parities in obesogenic behavior associated with over-  S. B. Sisson et al. / Open Journal of Preventive Medicine 1 (2011) 25-33 Copyright © 2011 SciRes. Openly accessible at http://www.scirp.org/journal/OJPM/ 30 Table 3. Prevalence estimates of meeting vigorous physical activity recommendations by state for 2003 & 2007. 2007 2007 2003 Prevalence ≥ 3day/wk ≥3 day/wk Overweight & Vigorous Physical Activity Vigorous Physical Activity State Obesity Boys Girls Boys Girls United States 30.8 83.0 75.1 a 79.6 69.4 a Alaska 34.2 90.1 82.7 a 79.8 75.4 a Alabama 36.5 86.8 79.4 b 85.4 76.3 b Arkansas 36.5 85.2 72.5 a 83.6 67.3 a Arizona 27.8 79.4 72.0 a 80.1 73.0 b California 26.9 81.7 77.3 81.2 75.2 Colorado 25.2 86.0 75.8 a 79.4 72.3 b Connecticut 26.4 81.8 70.7 a 75.7 65.7 a Washington, DC 35.1 72.7 64.5 a 75.9 59.3 a Delaware 31.7 79.3 69.9 a 77.3 64.0 a Florida 33.3 81.1 70.8 b 81.5 67.9 a Georgia 35.4 82.5 70.1 a 82.2 69.0 a Hawaii 28.2 84.9 82.2 a 82.9 71.8 a Iowa 26.6 82.5 76.6 82.5 71.5 a Idaho 27.4 83.8 74.7 a 75.8 73.4 Illinois 35.4 81.7 76.5 77.7 69.9 b Indiana 29.2 84.9 76.6 b 75.7 70.5 Kansas 32.0 84.7 74.5 a 83.9 75.4 a Kentucky 36.2 78.6 72.8 79.4 66.2 a Louisiana 36.6 83.4 73.3 a 82.4 73.3 a Massachusetts 31.0 84.7 74.8 a 76.0 67.5 a Maryland 29.2 81.5 74.6 73.4 62.3 a Maine 28.5 85.1 82.3 77.2 68.4 a Michigan 30.4 83.7 74.1 a 78.4 65.0 Minnesota 21.5 88.9 79.8 a 79.9 74.4 Missouri 30.5 83.4 80.4 80.5 72.4 a Mississippi 45.1 81.7 70.5 a 78.0 70.5 b Montana 25.4 84.6 82.1 81.4 76.2 North Carolina 33.9 86.2 80.4 82.3 70.1 a North Dakota 26.5 87.0 79.1 a 81.5 74.7 b Nebraska 30.5 87.6 76.6 a 81.2 75.7 New Hampshire 29.8 82.7 75.3 b 76.0 65.5 a New Jersey 31.8 82.5 75.1 77.6 58.7 a New Mexico 32.5 78.5 74.0 80.0 66.1 a Nevada 31.4 82.3 71.8 b 79.8 74.3 New York 32.7 79.9 72.3 b 78.7 61.4 a Ohio 33.2 86.2 75.8 a 77.6 66.3 a Oklahoma 39.6 83.2 75.3 b 83.6 70.6 a Oregon 23.0 83.9 79.6 83.1 77.2 b Pennsylvania 28.0 82.1 76.9 75.8 63.2 a Rhode Island 25.9 84.2 76.7 a 70.3 64.4 South Carolina 32.7 79.9 76.6 80.2 63.3 a South Dakota 27.7 82.3 76.7 77.3 69.6 b Tennessee 37.3 82.2 77.0 77.0 63.8 a Texas 29.4 83.3 74.0 81.0 74.1 b Utah 21.7 84.3 67.1 a 77.9 66.9 a Virginia 30.1 80.2 72.2 b 80.8 71.4 a Vermont 25.1 87.4 82.4 82.7 69.9 a Washington 29.1 86.6 76.8 a 79.5 72.6 b Wisconsin 28.2 87.4 77.6 a 79.3 74.9 West Virginia 37.1 84.0 75.7 a 84.5 74.8 a Wyoming 25.5 87.0 80.8 b 81.6 73.8 a Sex differences (Wald Chi Square): a p < 0.01, b p < 0.05. The analytic sample size for each state ranged from 754 in Utah to 1326 in Missouri for 2003 and from 832 in California to 1173 in New Hampshire for 2007. The sample for calculation of prevalence of overweight and obesity was limited to those 10 years of age and older (n = 37,346 in 2007 vs. 55,540 in 2003 and 53,611 in 2007). Table 4. Prevalence estimates of meeting media (TV/video viewing/video game playing) recommendations by state for 2003 & 2007. 2007 2003 ≤2 hr/day TV/viedo ≤2 hr/day TV/viedo State Boys Girls Boys Girls United States 75.7 81.0a 81.8 85.6a Alaska 79.7 82.9 81.5 88.7b Alabama 72.1 76.6 80.7 77.2 Arkansas 73.3 74.7 76.4 82.4 Arizona 75.8 79.8 83.3 87.2 California 78.5 82.9 83.2 88.2 Colorado 81.6 85.2 86.7 91.2 Connecticut 81.3 85.2 87.2 89.4 Washington, DC70.5 72.9 76.5 74.1 Delaware 79.7 79.9 80.1 85.5b Florida 64.5 77.4b 82.3 85.8 Georgia 71.5 77.5 83.9 83.9 Hawaii 77.7 84.4b 80.4 81.5 Iowa 77.2 82.5 84.1 89.2b Idaho 85.3 86.5 87.0 89.4 Illinois 79.2 79.7 79.2 84.3 Indiana 74.9 78.7 79.7 84.8 Kansas 78.6 78.7 87.4 87.0 Kentucky 76.7 80.4 76.4 82.2 Louisiana 69.6 69.6 73.8 76.0 Massachusetts 81.7 87.0 82.7 88.1b Maryland 76.2 85.6a 82.4 85.8 Maine 82.3 83.8 86.3 92.6a Michigan 73.9 77.7 80.3 84.9 Minnesota 83.7 90.5b 88.1 90.6 Missouri 75.4 85.4a 79.1 83.6 Mississippi 69.0 68.2 79.4 71.8b Montana 81.7 89.9a 86.3 91.0b North Carolina78.1 81.4 79.7 80.7 North Dakota 81.1 85.5 87.3 87.7 Nebraska 77.8 86.1b 86.8 90.5 New Hampshire81.6 90.3a 85.6 90.0 New Jersey 78.1 83.3 83.9 85.5 New Mexico 76.6 85.3 86.3 85.4a Nevada 73.6 79.9 75.3 85.4 New York 77.3 84.0 84.7 88.5 Ohio 73.9 75.2 78.6 82.4 Oklahoma 73.6 79.7 76.9 83.6b Oregon 78.0 86.3b 82.7 88.4b Pennsylvania 73.9 82.7 79.9 84.0 Rhode Island 84.0 87.5 85.0 88.3 South Carolina68.7 76.8b 76.7 79.3 South Dakota 82.6 81.7 84.8 87.6 Tennessee 66.5 79.3a 78.6 85.3b Texas 70.8 80.2 80.8 84.6 Utah 80.5 90.9a 84.2 92.5a Virginia 81.5 77.4 80.4 86.3 Vermont 85.0 89.9 90.2 90.9 Washington 79.2 87.4b 85.8 91.1b Wisconsin 81.0 83.2 86.0 89.1 West Virginia 75.1 78.6 76.8 85.4a Wyoming 87.2 88.3 88.0 88.0 Sex differences (Wald Chi Square): a p<0.01, b p<0.05. The analytic sample size for each state ranged from 754 in Utah to 1326 in Missouri for 2003 and from 832 in California to 1173 in New Hampshire for 2007. The sam- ple for calculation of prevalence of overweight and obesity was limited to those 10 years of age and older (n = 37,346 in 2007 vs. 55,540 in 2003 and 53,611 in 2007). weight and obesity status. The interaction of VPA and media had a significant association with overweight and 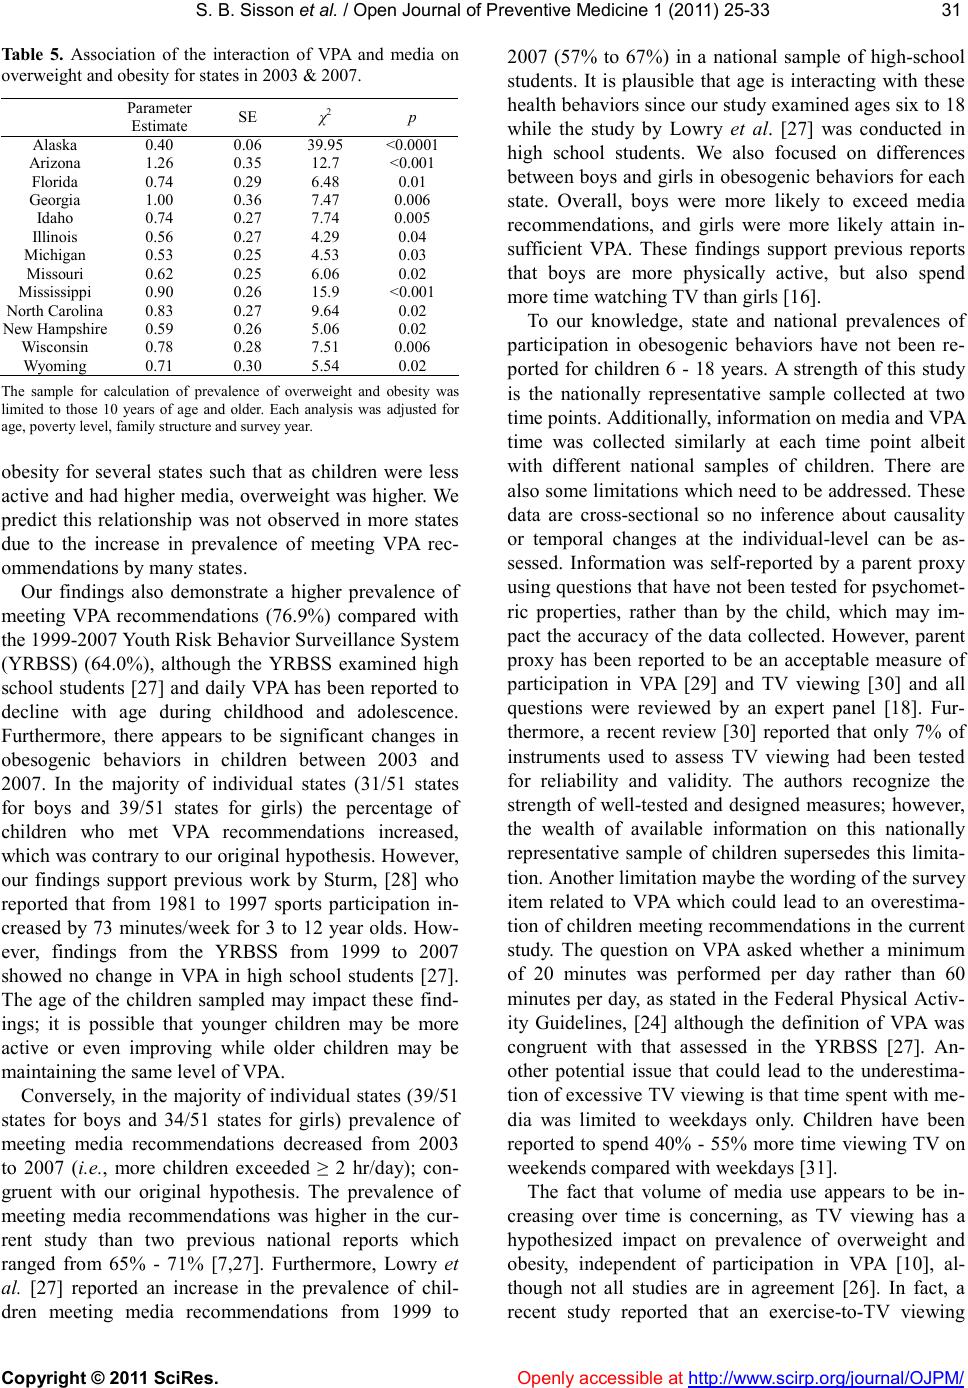 S. B. Sisson et al. / Open Journal of Preventive Medicine 1 (2011) 25-33 Copyright © 2011 SciRes. Openly accessible at http://www.scirp.org/journal/OJPM/ 31 31 Tab le 5 . Association of the interaction of VPA and media on overweight and obesity for states in 2003 & 2007. Parameter Estimate SE χ2 p Alaska 0.40 0.06 39.95 <0.0001 Arizona 1.26 0.35 12.7 <0.001 Florida 0.74 0.29 6.48 0.01 Georgia 1.00 0.36 7.47 0.006 Idaho 0.74 0.27 7.74 0.005 Illinois 0.56 0.27 4.29 0.04 Michigan 0.53 0.25 4.53 0.03 Missouri 0.62 0.25 6.06 0.02 Mississippi 0.90 0.26 15.9 <0.001 North Carolina 0.83 0.27 9.64 0.02 New Hampshire 0.59 0.26 5.06 0.02 Wisconsin 0.78 0.28 7.51 0.006 Wyoming 0.71 0.30 5.54 0.02 The sample for calculation of prevalence of overweight and obesity was limited to those 10 years of age and older. Each analysis was adjusted for age, poverty level, family structure and survey year. obesity for several states such that as children were less active and had higher media, overweight was higher. We predict this relationship was not observed in more states due to the increase in prevalence of meeting VPA rec- ommendations by many states. Our findings also demonstrate a higher prevalence of meeting VPA recommendations (76.9%) compared with the 1999-2007 Youth Risk Behavior Surveillance System (YRBSS) (64.0%), although the YRBSS examined high school students [27] and daily VPA has been reported to decline with age during childhood and adolescence. Furthermore, there appears to be significant changes in obesogenic behaviors in children between 2003 and 2007. In the majority of individual states (31/51 states for boys and 39/51 states for girls) the percentage of children who met VPA recommendations increased, which was contrary to our original hypothesis. However, our findings support previous work by Sturm, [28] who reported that from 1981 to 1997 sports participation in- creased by 73 minutes/week for 3 to 12 year olds. How- ever, findings from the YRBSS from 1999 to 2007 showed no change in VPA in high school students [27]. The age of the children sampled may impact these find- ings; it is possible that younger children may be more active or even improving while older children may be maintaining the same level of VPA. Conversely, in the majority of individual states (39/51 states for boys and 34/51 states for girls) prevalence of meeting media recommendations decreased from 2003 to 2007 (i.e., more children exceeded ≥ 2 hr/day); con- gruent with our original hypothesis. The prevalence of meeting media recommendations was higher in the cur- rent study than two previous national reports which ranged from 65% - 71% [7,27]. Furthermore, Lowry et al. [27] reported an increase in the prevalence of chil- dren meeting media recommendations from 1999 to 2007 (57% to 67%) in a national sample of high-school students. It is plausible that age is interacting with these health behaviors since our study examined ages six to 18 while the study by Lowry et al. [27] was conducted in high school students. We also focused on differences between boys and girls in obesogenic behaviors for each state. Overall, boys were more likely to exceed media recommendations, and girls were more likely attain in- sufficient VPA. These findings support previous reports that boys are more physically active, but also spend more time watching TV than girls [16]. To our knowledge, state and national prevalences of participation in obesogenic behaviors have not been re- ported for children 6 - 18 years. A strength of this study is the nationally representative sample collected at two time points. Additionally, information on media and VPA time was collected similarly at each time point albeit with different national samples of children. There are also some limitations which need to be addressed. These data are cross-sectional so no inference about causality or temporal changes at the individual-level can be as- sessed. Information was self-reported by a parent proxy using questions that have not been tested for psychomet- ric properties, rather than by the child, which may im- pact the accuracy of the data collected. However, parent proxy has been reported to be an acceptable measure of participation in VPA [29] and TV viewing [30] and all questions were reviewed by an expert panel [18]. Fur- thermore, a recent review [30] reported that only 7% of instruments used to assess TV viewing had been tested for reliability and validity. The authors recognize the strength of well-tested and designed measures; however, the wealth of available information on this nationally representative sample of children supersedes this limita- tion. Another limitation maybe the wording of the survey item related to VPA which could lead to an overestima- tion of children meeting recommendations in the current study. The question on VPA asked whether a minimum of 20 minutes was performed per day rather than 60 minutes per day, as stated in the Federal Physical Activ- ity Guidelines, [24] although the definition of VPA was congruent with that assessed in the YRBSS [27]. An- other potential issue that could lead to the underestima- tion of excessive TV viewing is that time spent with me- dia was limited to weekdays only. Children have been reported to spend 40% - 55% more time viewing TV on weekends compared with weekdays [31]. The fact that volume of media use appears to be in- creasing over time is concerning, as TV viewing has a hypothesized impact on prevalence of overweight and obesity, independent of participation in VPA [10], al- though not all studies are in agreement [26]. In fact, a recent study reported that an exercise-to-TV viewing  S. B. Sisson et al. / Open Journal of Preventive Medicine 1 (2011) 25-33 Copyright © 2011 SciRes. Openly accessible at http://www.scirp.org/journal/OJPM/ 32 ratio of 2.5:7 hours/week was necessary to protect against developing overweight in adolescents [32]. Some recent interventions to decrease TV viewing in children were successful and resulted in reduced body mass index, even in the absences of an increase in moderate-to-vig- orous PA [33,34]. The hypothesized pathways whereby TV viewing impacts overweight status are still being investigated and include 1) decreased PA, as media time may displace time that would otherwise be used for sports or other forms of active play, 2) promotion of snacking during TV time, 3) increased daily caloric con- sumption and consumption of fast food spurred by ex- posure to child-focused advertising, and 4) lowered metabolic rate during TV viewing compared to sponta- neous play [30,35]. In conclusion we found significant geographic differ- ences in the prevalence of meeting VPA and media rec- ommendations in US children and that these behaviors were associated with higher odds of overweight or obe- sity status. Additionally, the present study shows that the prevalence of meeting obesogenic behavior recommen- dations changed from 2003 to 2007. In general, more states met VPA recommendations in 2007 than in 2003 while fewer states met the media recommendations in 2007 than in 2003. Understanding state and regional prevalence and trends could be used by public health researchers and practitioners to create regionally tailored interventions and monitor progress over time. However, approaches should address the unique correlates of ac- tivity and sedentary behaviors [17]. Further work is now needed to understand why the prevalence of obesogenic behaviors is shifting and how they affect health and dis- ease. 5. ACKNOWLEDGEMENTS There was no funding for this project. Declaration of Competing Interests There are no conflicts of interest. Author’s Contributions SBS was involved with the conception, design, data acquisition, ana- lyses and interpretation of the data as well as manuscript preparation. STB was involved with the conception, design, analyses and interpre- tation of the data as well as manuscript preparation. KRS and DRB were involved in interpretation and presentation of data and analyses as well as manuscript preparation. REFERENCES [1] Ogden, C.L., Carroll, M.D., Curtin, L.R., Lamb, M.M. and Flegal, K.M. (2010) Prevalence of high body mass index in US children and adolescents, 2007-2008. The Journal of the American Medical Association, 303, 242-249. doi:10.1001/jama.2009.2012 [2] Ogden, C.L., Carroll, M.D. and Flegal, K.M. (2008) High body mass index for age among US children and adolescents, 2003-2006. The Journal of the American Medical Association, 299, 2401-2405. doi:10.1001/jama.299.20.2401 [3] Tudor-Locke, C., et al. (2007) A geographical compari- son of prevalence of overweight school-aged children: the National Survey of Children’s Health 2003. Pediat- rics, 120, e1043-e1050. doi:10.1542/peds.2007-0089 [4] Fulton, J.E., et al. (2009) Physical activity, energy intake, sedentary behavior, and adiposity in youth. American Journal of Preventive Medicine, 37, S40-S49. doi:10.1016/j.amepre.2009.04.010 [5] Kim, Y. and Lee, S. (2009) Physical activity and ab- dominal obesity in youth. Applied Physiology, Nutrition, Metabolism, 34, 571-81. doi:10.1139/H09-066 [6] Wittmeier, K.D., Mollard, R.C. and Kriellaars, D.J. (2008) Physical activity intensity and risk of overweight and adiposity in children. Obesity, 16, 415-420. doi:10.1038/oby.2007.73 [7] Fulton, J.E., et al. (2009) Television viewing, computer use, and BMI among US children and adolescents. Jour- nal of Physical Activity & Health, 6, S28-S35. [8] Jackson, D.M., et al. (2009) Increased television viewing is associated with elevated body fatness but not with lower total energy expenditure in children. The American Journal of Clinical Nutrition, 89, 1031-1036. doi:10.1038/oby.2007.73 [9] Hume, C., Singh, A., Brug, J., W. Van Mechelen, W. and Chinapaw, M.(2008) Dose-response associations be- tween screen time and overweight among youth. Inter- naotional Journal of Pediatric Obesity, 4, 61-64. [10] Crespo, C.J., et al. (2001) Television watching, energy intake, and obesity in US children: Results from the Third National Health and Nutrition Examination Survey, 1988-1994. Archives of Pediatrics & Adolescent Medi- cine, 155, 360-365. [11] Sisson, S.B., et al. (2010) Screen Time, Physical Activity, and Overweight in US Youth: National Survey of Chil- dren’s Health 2003. Journal of Adolescent Health, 47, 309-311. doi:10.1016/j.jadohealth.2010.02.016 [12] Eisenmann, J.C., et al. (2008) Combined influence of physical activity and television viewing on the risk of overweight in US youth. International Journal of Obesity, 32, 613-618. doi:10.1038/sj.ijo.0803800 [13] Laurson, K.R., et al. (2008) Combined influence of physical activity and screen time recommendations on childhood overweight. The Journal of Pediatrics, 153, 209-214. doi:10.1016/j.jpeds.2008.02.042 [14] Wosje, K.S., et al. (2009) Adiposity and TV viewing are related to less bone accrual in young children. The Jour- nal of Pediatrics, 154, 79-85.e2. [15] Sisson, S.B., et al. (2009) Profiles of sedentary behavior in children and adolescents: The US National Health and Nutrition Examination Survey, 2001-2006. International Journal of Pediatric Obesity, 4, 353-359. doi:10.3109/17477160902934777 [16] Jago, R., et al. (2005) Adolescent patterns of physical activity differences by gender, day, and time of day. American Journal of Preventive Medicine, 28, 447-452. doi:10.1016/j.amepre.2005.02.007 [17] Whitt-Glover, M.C., et al. (2009) Disparities in physical activity and sedentary behaviors among US children and adolescents: Prevalence, correlates, and intervention im-  S. B. Sisson et al. / Open Journal of Preventive Medicine 1 (2011) 25-33 Copyright © 2011 SciRes. http://www.scirp.org/journal/OJPM/Openly accessible at 33 33 plications. Journal of Public Health Policy, 30, S309- S334. doi:10.1057/jphp.2008.46 [18] Blumberg, S.J., et al. (2009) Design and operation of the national survey of children’s health, 2007. National Cen- ter for Health Statistics, Centers for Disease Control and Prevention, Department of Health and Human Services, Hyattsville, 1-75. [19] Child and Adolescent Health Measurement Initiative (2010) 2003 National survey of children’s health. www.childhealthdata.org [20] Child and Adolescent Health Measurement Initiative (2009) 2007 National survey of children’s health. http://www.cdc.gov/nchs/slaits/nsch.htm#2007nsch. [21] Blumberg, S., et al. (2005) Design and operation of the National Survey of Children’s Health, 2003. National Center for Health Statistics. Vital and Health Statistics, 1, 1-131. [22] Kuczmarski, R.J. and Flegal, K.M. (2000) Criteria for definition of overweight in transition: Background and recommendations for the United States. The American Journal of Clinical Nutrition, 72, 1074-1081. [23] American Academy of Pediatrics (2001) American Acad- emy of Pediatrics: Children, adolescents, and television. Pediatrics, 107, 423-426. [24] Office of Disease Prevention and Health Promotion, US Department of Health and Human Services (2008) Uni- ted States department of health and human services, physical activity guidelines for Americans, 1-61. [25] United States Census Bureau (2000) Census regions and divisions of the United States. http://www.cen sus.gov/geo/www/us_regdiv.pdf [26] Marshall, S.J., et al. (2004) Relationships between media use, body fatness and physical activity in children and youth: A meta-analysis. International Journal of Obesity, 28, 1238-1246. doi:10.1038/sj.ijo.0802706 [27] Lowry, R., et al. (2009) Healthy people 2010 objectives for physical activity, physical education, and television viewing among adolescents: national trends from the Youth Risk Behavior Surveillance System, 1999-2007. Journal of Physical Activity & Health, 6, S36-S45. [28] Sturm, R. (2005) Childhood obesity—What we can learn from existing data on societal trends, part 1. Preventing Chronic Disease, 2, A12. [29] Dowda, M., et al. (2007) Agreement between stu- dent-reported and proxy-reported physical activity ques- tionnaires. Pediatric Exercise Science, 19, 310-318. [30] Bryant, M.J., et al. (2007) Measurement of television viewing in children and adolescents: A systematic review. Obesity Reviews, 8, 197-209. doi:10.1111/j.1467-789X.2006.00295.x [31] Biddle, S.J., Gorely, T. and Marshall, S.J. (2009) Is tele- vision viewing a suitable marker of sedentary behavior in young people? Annals of Behavioral Medicine, 38, 147- 153. doi:10.1007/s12160-009-9136-1 [32] Van Den Bulck, J. and Hofman, A. (2009) The Televi- sion-to-exercise ratio is a predictor of overweight in ado- lescents: Results from a prospective cohort study with a two year follow up. Preventive Medicine, 48, 368-371. doi:10.1016/j.ypmed.2009.02.006 [33] Robinson, T.N. (1999) Reducing children’s television viewing to prevent obesity: A randomized controlled trial. The Journal of the American Medical Association, 282, 1561-1567. doi:10.1001/jama.282.16.1561 [34] Epstein, L.H., et al. (2008) A randomized trial of the effects of reducing television viewing and computer use on body mass index in young children. Archives of Pedi- atrics & Adolescent Medicine, 162, 239-245. doi:10.1001/archpediatrics.2007.45 [35] Rey-Lopez, J.P., et al. (2008) Sedentary behavior and obesity development in children and adolescents. Nutri- tion, Metabolism and Cardiovascular Diseases, 18, 242- 251. doi:10.1016/j.numecd.2007.07.008
|