Open Access Library Journal
Vol.02 No.11(2015), Article ID:68852,13 pages
10.4236/oalib.1102022
Maintainability Analysis Software of Mine’s Hoist System Based on Genetic Algorithms for Data Collection Periods of Three and Six Months
Chao Xu, Nick Vayenas
Laurentian University Mining Automation Laboratory (LUMAL), Bharti School of Engineering, Laurentian University, Sudbury, Canada
Email: Cz_xu@laurentian.ca, NVayenas@laurentian.ca
Copyright © 2015 by authors and OALib.
This work is licensed under the Creative Commons Attribution International License (CC BY).
http://creativecommons.org/licenses/by/4.0/


Received 23 October 2015; accepted 7 November 2015; published 13 November 2015

ABSTRACT
Equipment failures and associated maintenance have an impact on the profitability of mines. Implementing maintenance at suitable time intervals can save money and improve the reliability and maintainability of mining equipment. This paper discusses aspects of maintainability prediction for mining machinery. For this purpose, a software tool, called GenRel, is developed. In GenRel, it is assumed that failures of mining equipment caused by an array of factors follow the biological evolution process. GenRel then simulates the failure occurrences during a time period of interest using Genetic Algorithms (GAs) coupled with a statistical methodology. Two case studies on maintainability analysis and prediction of a mine’s hoist system in two different time intervals, three months and six months are discussed. The data are collected from a typical underground mine in the Sudbury area in Ontario, Canada. In each case study, a statistical test is carried out to examine the similarity between the predicted data set and the real-life data set in the same time period. The objectives include an assessment of the applicability of GenRel using real-life data and an investigation of the relationship between data size and prediction results. Discrete and continuous probability distribution functions are applied to the input data.
Keywords:
Maintainability, Genetic Algorithms, Mine’s Hoist System, GenRel
Subject Areas: Mineral Engineering

1. Introduction
To maximize profit;
To reduce the cost of poor reliability;
To reduce unplanned maintenance costs and frequency;
To provide more accurate short-term forecasts for equipment operating hours;
To overcome challenges imposed by global competition;
To take advantage of lessons learned from other industrial sectors such as aerospace, defense, and nuclear power generation [1].
2. Maintainability
Maintainability is defined as a characteristic of design and installation expressed as a probability that an item will be retained in or restored to specified conditions within a given period of time, when maintenance action is performed in accordance with prescribed procedures and resources [2].
A system with better maintainability would inherently provide the benefit of lower maintenance costs, less time to recover with lower breakdown frequency, less complexity of maintenance tasks and relatively reduced man-hours [3]. In general, the maintainability function is defined as:
 (1)
(1)
or, the maintainability function is defined as:
 (2)
(2)
where

Genetic Algorithms
Initialization
Generate initial data list A from random numbers
Fitness evaluation
Find suitable fitness function for this data list
Selection
Select a set of promising candidates B from the data list
Crossover
Apply crossover to the candidate set B, and get an offspring set C
Mutation
Some mutations happen in the offspring set C, then obtain the new offspring set C'
Replacement
Use the new offspring set C to replace initial data list A
Termination
If the termination criteria are not met, go to “Fitness evaluation”. In this thesis, termination criteria are the convergence limit and the maximum number of iterations.
Research on GAs has a wide spectra of applications from computer science [5] [6] to engineering [7]-[9] and, more recently, to fields such as molecular biology, immunology [10], economics [11]-[13]. In the mining engineering field GAs have been used, for examples, for ore grade estimation [14], ore grade optimization [15], optimization of open-pit development system [16], coal mine production scheduling [17], and open pit truck dispatch [18].
Reliability and maintainability models with or without co-variances are based on the use of rigorous and complicated statistical techniques which include, for instance, theoretical probability distribution fitting, trend and serial correlation tests, and require assumptions of homogeneous or non-homogeneous Poisson process or assumptions of proportionality of the hazard rate. The assumptions and statistical constraints of probabilistic reliability and maintainability models limit the ability of these models to accurately represent and fit all real life mining conditions [19]. This is an important observation that led the authors to consider Gas for reliability/maintainability assessment of mining equipment.
3. Introduction to GenRel
GenRel is a computer model developed in MS-Excel using Visual Basic for reliability and maintainability assessment of mining equipment based on Genetic Algorithms (GAs).
In a typical genetic algorithm, variables of interest are coded. Afterwards, the processes of mate selection, crossover, and mutation are repeated until the fitness function yields desired values [8]. The application of GAs to GenRel is illustrated in Figure 1.
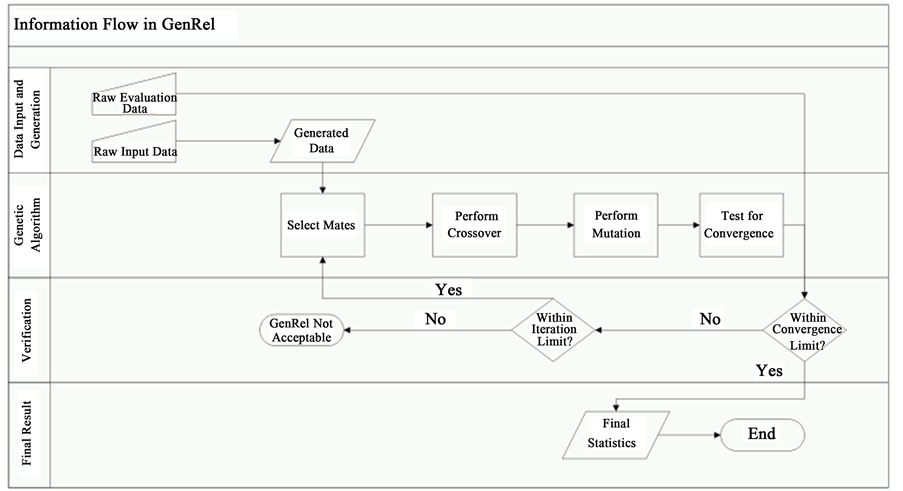
Figure 1. Information flow in GenRel.
In GenRel, the user can define the maximum number of iterations, the convergence limit, and the probability of mutation, see Figure 2.
The raw data used in GenRel is derived from historical records in terms of Time Between Failures (TBF) in the case of reliability predictions and in terms of Time To Repair (TTR) in the case of maintainability studies. The distribution fitting process in GenRel selects the best fitted probability distribution function  to the raw data. For example, take the Exponential distribution [20],
 (3)
(3)
where  is a TTR value,
  is the mean and
  is the location parameter. We divide the entire raw data into two equal sets, the Raw Input Data set and the Raw Evaluation Data set. The Raw Input Data set is used to generate new data sets, while the Raw Evaluation Data is used in the evaluation process of the generated data set. Suppose
 (4)
(4)
and
 (5)
(5)
where  and
and  are the means,
  and
and  are the location parameters,
  and
and  are the best fit-

1From Equation (5), an inverse of the function can be expressed as , where
  substituting
  with the random variable R yields the expression.
ted probability distribution functions for the Raw Evaluation Data set and for the Raw Input Data set, respectively. In order to generate new data from the Raw Input Data, we use the Inverse Transform Technique, or ITT [21], by transforming the exponential distribution function into the inverse format and by generating a uniformly distri-
buted random variable R ~ U (0,1). Then, six sets of generated data can be yielded by  1. Six sets of new data are considered adequate for the prediction process within GenRel.
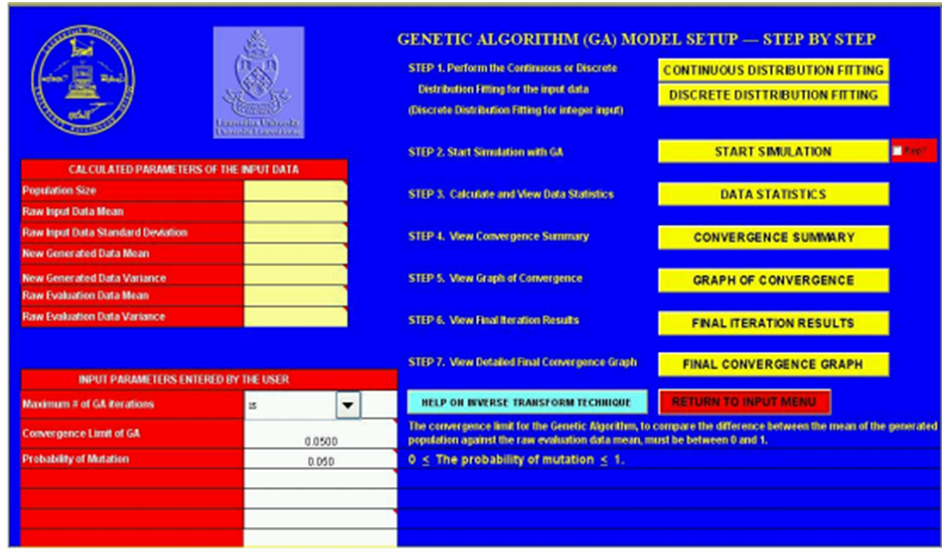
Figure 2. Input interface of GenRel.
The generated data is then used for mate selection and crossover in which a random number determines the positions and total number of crossovers, yielding offspring data. Afterwards, mutation is performed at a specified rate defined by the user as mutation probability. Six sets of new offspring data follow the respective best fitted Exponential probability distribution functions, denoted by parameter pairs ( ,
, ), (i = 1, 2, 3, …, 6), where
  and
and  represent mean and location of the respective probability distribution functions. A fitness function
 (6)
(6)
is designed to measure the fitness of each individual offspring data set, for detailed discussion of this procedure, see [22].
If the smallest value of the six fitness function values is not greater than the user-defined convergence limit, then the iterative process is terminated and GenRel is considered applicable for prediction of future data; otherwise another iteration will be implemented as long as the pre-set maximum number of iterations is not exceeded and the smallest fitness function value is within a user defined convergence limit. The convergence limit is the upper limit of deviation between the probability distribution function of the generated data set and the probability distribution function of the Raw Evaluation Data set.
Overall, after the above described algorithmic process is successful, GenRel can be applied to predict future data. Otherwise, GenRel is considered not acceptable for prediction of future data based on the raw data under study. For details of the algorithmic procedure applied in GenRel, see [23].
3.1. Procedures in GenRel’s Logic
There are four main procedures in GenRel.
3.1.1. Data Preparation
Input data of GenRel can be either Time Between Failures (TBF) (for reliability assessment) or Time To Repair (TTR) data (for maintainability predictions), field data from mine sites must be entered as TBF or TTR data. For discrete distribution fitting, the requirement of input data is to be integer, thus TBF or TTR data must be transformed to integer to meet the statistical fitting requirements.
3.1.2. Trend Test and Serial Correlation Test
Prior to statistical analysis and probability distribution fitting, the data should be tested for trends and serial correlations. The purpose of these tests is to verify the assumption that the data is Independent and Identical Distribution (IID), [24]. Trend test presents a linear relation between cumulative TTR and cumulative TTR numbers. Serial correlation test presents a scattered pattern between the ith TTR and (i-1)th TTR. If data is IID, then it can statistically be represented/ fitted by a theoretical probability distribution.
3.1.3. Verification of the Applicability of GenRel
If there is a specific probability distribution that can fit the Raw Input Data, then we can use the inverse transform technique to generate new data sets.
Convergence criteria include the convergence limit, the probability of mutation, and the maximum number of iterations. If the smallest fitness function value falls within the convergence limit, then the validation process of convergence is considered successful. Otherwise, we run the crossover and mutation processes, iterating the initially generated data sets, achieving an acceptable value and not exceeding the maximum number of iteration.
3.1.4. Prediction of Data for the Time Period of Interest
After the successful completion of the verification process for the input data, GenRel then can be applied to predict future data. GenRel is run to generate the initial offspring data set of the same size as the Raw Input Data set with the parameters values obtained from the Raw Input Data distribution fitting process. In GenRel, six data sets are considered sufficient. In these six data sets, selection, cross-over, and mutation are performed until either of the following two criteria is satisfied: (1) the fitness value of the best offspring data set falls within the user-defined convergence limit; (2) total iterations run in GenRel reaches the user-defined maximum number of iterations. Upon completion of the prediction, the t-test is used to examine the statistical similarity of the predicted data set with the Raw Evaluation Data set [20].
4. Introduction to Underground Mine Hoist Systems
Increases in depth of underground mines, requirements of increased productivity, expectations of reduction in energy consumption, together with better safety requirements provoke challenges to mine extraction systems. In deep underground mines, hoist systems play a strategic role to turn mineral resources into profits.
Figure 3, [25] shows a typical underground mine hoist system. A hoist in an underground mine site is used to transport the ore and waste rock, and also move personnel, equipment and other materials. As early as the 16th century, a hoist system was used to raise and lower conveyances within a mine shaft. Human, animal and water power were used to power the mine hoists. In today’s mines, mine hoist systems are almost all driven by electric motors, using either direct current drives with solid-state converters (thyristors) or alternating current drives controlled by variable frequency [26]. Usually hoist systems can be classified into three categories, drum hoist, friction hoist (also known as Koepe hoist), and Blair multi-rope hoist [26]. A skip hoist system usually includes mechanical equipment, shaft equipment, power system, digital control and monitoring system.
5. Data Collection and Pre-Processing
Data was gathered from a typical underground mine (named for simplicity in this paper as Mine A) in the Sudbury mining area in Ontario, Canada. Since the case studies are related to the maintainability characteristics of hoists, Time To Repair (TTR) data is entered.
5.1. Prediction of TTR Data for Three Months Time Period
In this paper, we consider the case study with prediction of TTR data for the period from April 1st to June 30th 2007 based on historical data from January 1st to March 31st 2007. Continuous and discrete distribution fitting will be tested based on the input data. With preliminary manipulations, Table 1 shows an overview of the historical failure data in this time period, in which ME stands for electrical failure, MO for maintenance out of plan, MM for mechanical failure, MP for planned maintenance, and OI for operator planned inspection.
Even though the data collection period is not as recent, this has no impact on the development work to apply GenRel and examine the proposed methodology.

Figure 3. Mine hoist system, (ABB, 2014).
Table 1. Failure data composition from January 1st to March 31st, 2007, for Mine A.
5.2. Verification of Applicability of GenRel to the Data Set under Study
Before GenRel is run, the validity of the Independent and Identical Distribution (IID) assumption for the data sets should be examined. Graphical tests show that the data set under study is independent and identically distributed. Then, the verification process aims to provide a prescreening result of GenRel’s applicability to the data set under study. In the case study, TTR data for the period of January 1st to March 31st 2007 is the data set of interest, which is to be used as Raw Input Data set to predict repair data for the period of April 1st to June 30th 2007, if GenRel is to be found applicable through the verification process.
As described in Chapter 3, TTR data for the period of January 1st to March 31st 2007 is divided chronologically into two sets: (Raw Input Data Set and Raw Evaluation Data Set) with equal number of data entries, 74.
In the verification stage, continuous and discrete probability distribution fitting will be used as fitting distribution functions to find the best fit.
For discrete distribution function, the best fitting distribution function, calculated by @Risk® [27], is the Poisson distribution for the Raw Input Data, with lambda = 5.0135.
In Microsoft® Excel® with Visual Basic, there isn’t a built-in Poisson inverse function that can directly be called to generate random variables from the best fitted normal distribution with location parameter Lambda. A Poisson inverse function has been programmed in GenRel to complete this procedure, see [28]. GenRel produces six sets of data with size identical to that of the Raw Input Data set. These six sets of data generated through the inverse transform statistical technique constitute the initial population for the cross-over and mutation operations to follow.
Next, the initial population of six sets of generated data starts to cross over and mutate at a rate defined by the user (e.g. mutation probability of 0.05). Elite individuals which possess smaller cost function values have better chance to survive and to be selected to reproduce offspring through selection, cross-over, and mutation. These genetic operations iterate until either the maximum number of iterations, (which is set to 15) or the convergence limit, (which is set to 0.05), has been reached. In this case, after one iteration, the fitness function value falls within the user-defined convergence limit, as shown in Table 2.
Therefore, it is concluded that GenRel is applicable to analyze the data set from January 1st to March 31st 2007.
For continuous probability distribution function, the best fitting distribution function, calculated by @Risk® [27], is the Beta probability distribution for the Raw Input Data, but after 15 iterations, GenRel still could not generate an offspring data within the convergence limit (see Table 3). Thus applying continuous distribution function as fitting function is considered as not applicable for future failure data in this case study of historical data from January 1st to March 31st, 2007.
5.3. Prediction of TTR Data for the Time Periods from April 1st to June 30th 2007 Based on Historical Data from January 1st to March 31st 2007
In the case of discrete probability distribution fitting, after one iteration, GenRel returns a set of TTR data as the final prediction of failures for the hoist system at Mine A during the time period from April 1st to June 30th, 2007. Results from @Risk® show that the Poisson probability distribution best fits the predicted data set. The parameter of the Poisson probability distribution is Lambda = 4.5203.
Table 2. Iteration results of TTR data from January 1st to March 31st, 2007.
Table 3. Iteration results of TTR data from January 1st to March 31st, 2007.
Figure 4 shows a convergence graph comparison between the Raw Evaluation Data and the Generated Data for the time period from April 1st to June 30th, 2007. At a level of significance of 5%, t-test statistic is 2.02 with 404 degrees of freedom. Based on the result of the t-test, it is concluded that there is a significant difference between the generated data set and the Raw Evaluation Data set in terms of mean values at a given level of significance of 5%. It is then considered that the GenRel cannot be applied with sufficient statistical confidence.
6. Prediction of TTR Data for Six Months Time Period
As in the case study of a three-month period, a case study is considered: for the period from May 1st to October 31st, 2007 based on historical data from November 1st, 2006 to April 30th, 2007. Table 4 shows an overview of the historical data composition.
6.1. Verification of Applicability of GenRel to the Data Set under Study
As mentioned earlier, similar graphical testing processes are implemented, and show that the data sets under study are independent and identically distributed. Table 5 and Table 6 show that, after one iteration, GenRel yields an offspring data set within the convergence limit in discrete and continuous probability distribution fitting function, respectively. Therefore, GenRel is considered applicable to predict future repair data set based on the given historical data sets under this set of configurations.
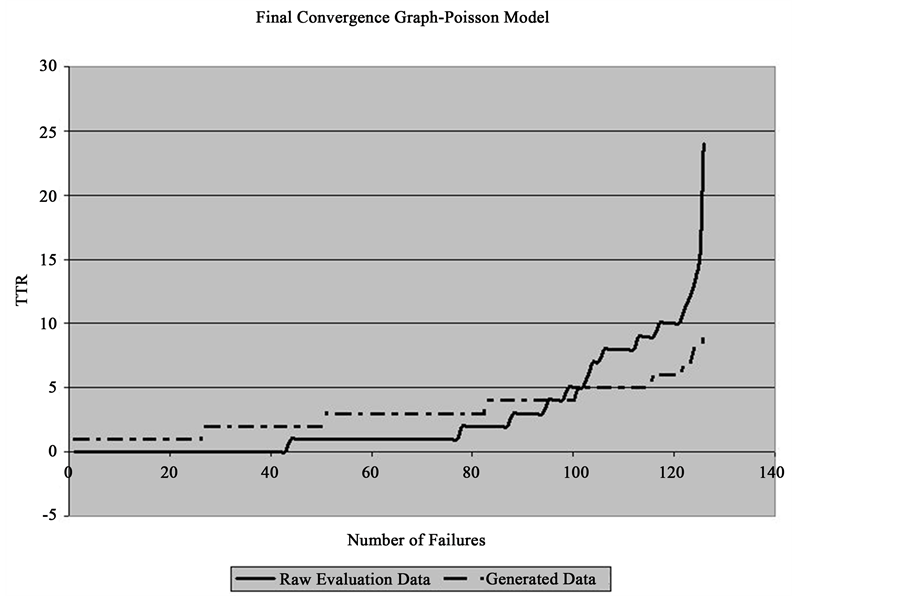
Figure 4. Convergence comparison between raw evaluation data and generated data for the time period from January 1st to March 31st, 2007.
Table 4. Failure data composition from November 1st, 2006 to April 30th, 2007.
Table 5. Iteration results of TTR data from November 1st, 2006 to April 30th, 2007 (discrete probability fitting).
Table 6. Iteration results of TTR data from November 1st, 2006 to April 30th, 2007 (continuous probability fitting).
6.2. Prediction of TTR Data for the Period from May 1st to October 31st, 2007 Based On Historical Data from November 1st, 2006 to April 30th, 2007
In the case of discrete probability distribution fitting, with one iteration, GenRel returns a set of TTR data as the final prediction of failures of the hoist system at Mine A during the time period from May 1st to October 31st, 2007. Results from @Risk® show that the Poisson probability distribution is the best fit. The parameter of the Poisson probability distribution is Lambda = 3.7348.
Figure 5 shows a convergence graph comparison between the Raw Evaluation Data and the Generated Data for the time period from May 1st to October 31st, 2007. At a level of significance of 5% (95% confidence internal), t-test statistic is 0.21 with 790 degrees of freedom. Based on the result of the t-test, it is concluded that there is no significant difference between generated data set and Raw Evaluation Data set in terms of mean at a given level of significance of 5%.
Thus, the maintainability function is shown as follows, (for details, see [28]):

Following table presents maintainability values based on the TTR data:table_table_tableλ = 3.7348.
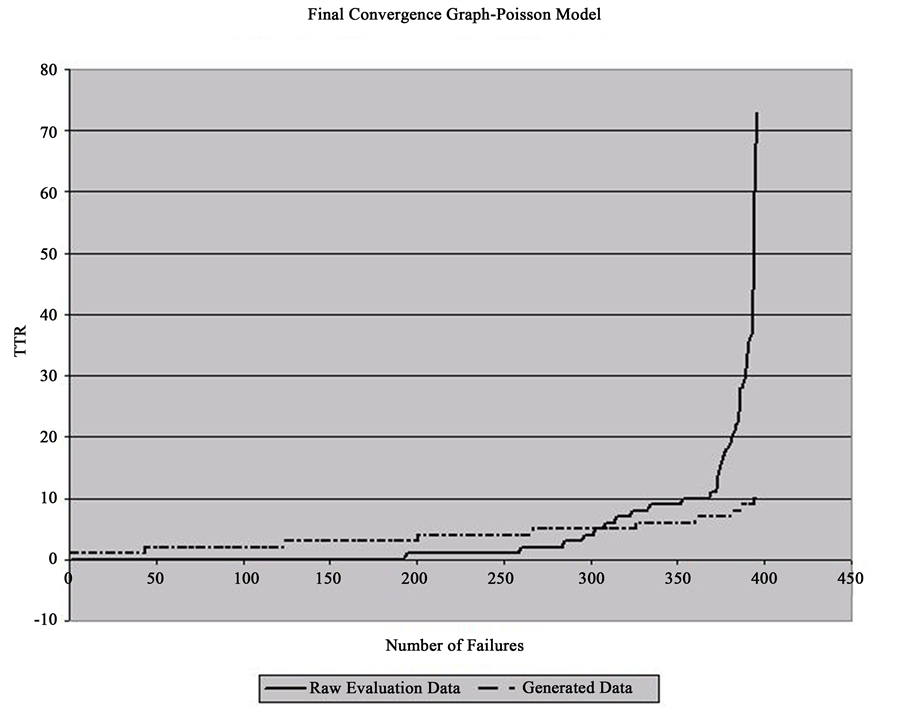
Figure 5. Convergence comparison between raw evaluation data and generated data for the time period from May 1st to October 31st, 2007.
In the case of continuous probability distribution fitting, after one iteration, GenRel returns a set of TTR data as the final prediction of failures of the hoist system at Mine A during the time period from May 1st to October 31st, 2007. Results from @Risk® show that the Lognormal probability distribution fits the predicted data set best. Parameters of Lognormal probability distribution are μ = 4.6514, σ = 14.048 and shift = 0.18658.
Figure 6 shows a convergence graph comparison between the Raw Evaluation Data and the Generated Data for the time period from May 1st to October 31st, 2007. At a level of significance of 5%, t-test statistic is 0.7 with a degree of freedom of 664. Based on the result of the t-test, it is concluded that there is no significant difference between the generated data set and the Raw Evaluation Data set in terms of mean values at a given level of significance of 5%.
Thus, the maintainability function is shown as follows, (for details, see [28]):

with

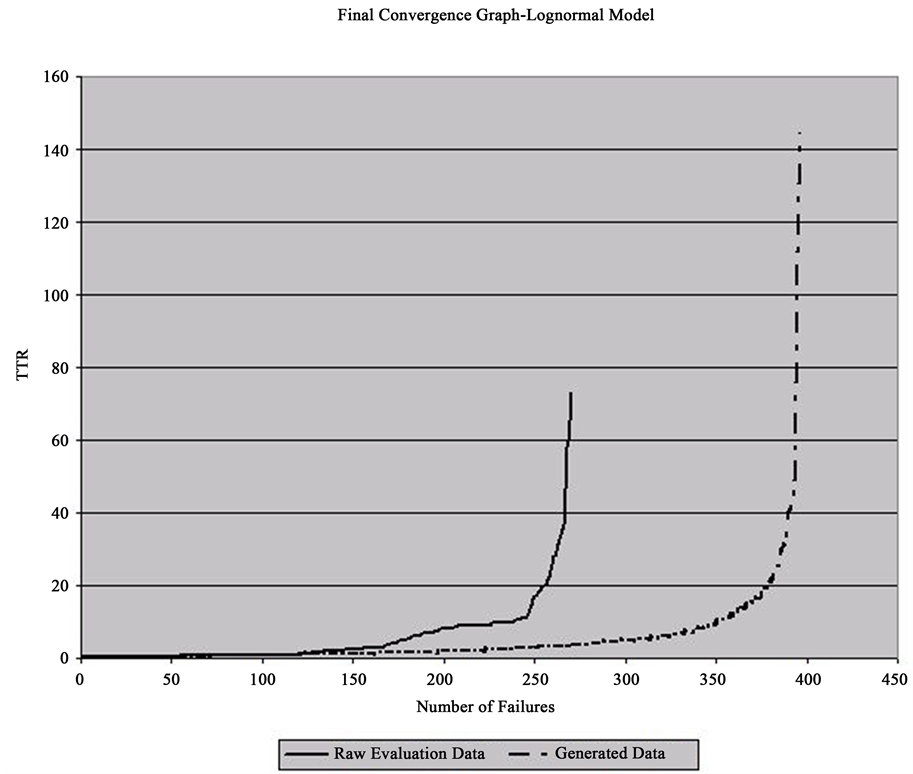
Figure 6. Convergence comparison between raw evaluation data and generated data for the time period from May 1st to October 31st, 2007.
where,
θ: is the shift;
σ: is the mean of the associated Normal distribution;
μ: is the standard deviation of the associated Normal distribution.
Following are some maintainability values based on the TTR data:
μ = 4.6514, σ = 14.048 and θ = 0.18658.
7. Conclusion and Recommendations
The case studies discussed in this paper indicate the potential of a genetic algorithms based on software, called GenRel, to predict maintenance characteristics of a mine’s hoist system, expressed in terms of maintainability. A case study at time intervals of three months is successful with discrete probability distribution fitting but not with continuous probability fitting. A case study at time intervals of six months shows acceptable predictions at a given level of confidence, 5%. However, the results with discrete distribution fitting show less significance difference than the results with continuous distribution fitting. Further investigation is required to examine the reason behind these unsuccessful predictions. Research should be carried out to examine whether the reasons are time based or dependent on the failure characteristics of the hoist system.
Acknowledgements
The authors wish to thank the Natural Sciences and Engineering Research Council of Canada (NSERC) for the funding support to this research.
Cite this paper
Chao Xu,Nick Vayenas, (2015) Maintainability Analysis Software of Mine’s Hoist System Based on Genetic Algorithms for Data Collection Periods of Three and Six Months. Open Access Library Journal,02,1-13. doi: 10.4236/oalib.1102022
References
- 1. Dhillon, B.S. (2008) Mining Equipment Reliability, Maintainability, and Safety. Springer Series in Reliability Engineering. Springer.
- 2. Calabro, S.R. (1962) Reliability Principles and Practices. McGraw-Hill Book Company.
- 3. AMCP706-134 (1972) Engineering Design Handbook: Maintainability Guide for Design. US Department of Defense, Washington DC.
- 4. Ahn, C.W. (2006) Advances in Evolutionary Algorithms, Theory, Design and Practice. Vol. 18, Springer, Berlin Heidelberg and New York.
- 5. (1990) In: Michalewicz, Z., Ed., Proceedings of the 5th International Conference on Statistical Scientific Databases: Lecture Notes in Computer Science, Vol. 420, Springer-Verlag, New York.
- 6. Srivastava, P.R. and Kim, T. (2009) Application of Genetic Algorithm in Software Testing. International Journal of Software Engineering and Its Applications, 3.
- 7. Gen, M. and Cheng, R. (1997) Genetic Algorithms & Engineering Design. John Wiley & Sons, Inc., Hoboken.
- 8. Goldberg, D.E. (1989) Genetic Algorithms in Search, Optimization, and Machine Learning. Addison-Wesley Pub. Co.
- 9. Shi, L., Da, L. and Fu, H. (2005) An Application of Genetic Algorithm in Engineering Optimization. Current Trends in High Performance Computing and Its Applications, 431-435.
- 10. McCall, J. (2005) Genetic Algorithms for Modelling and Optimization. Journal of Computational and Applied Mathematics, 184, 205-222.
http://dx.doi.org/10.1016/j.cam.2004.07.034 - 11. Aytug, H., Khouja, M. and Vergara, F.E. (2003) Use of Genetic Algorithms to Solve Production and Operations Management Problems: A Review. International Journal of Production Research, 41, 3955-4009.
http://dx.doi.org/10.1080/00207540310001626319 - 12. Dawid, H. and Kopel, M. (1998) On Economic Applications of the Genetic Algorithm: A Model of the Cobweb Type. Journal of Evolutionary Economics, 8, 297-315.
http://dx.doi.org/10.1007/s001910050066 - 13. Proudlove, N.C., Vadera, S. and Kobbacy, K.A.H. (1998) Intelligent Management Systems in Operations: A Review. Journal of the Operational Research Society, 49, 682-699.
http://dx.doi.org/10.1057/palgrave.jors.2600519 - 14. Clement, S.R. and Vayenas, N. (1994) Use of Genetic Algorithms in a Mining Problem. International Journal of Mining, Reclamation and Environment, 8, 131-136.
http://dx.doi.org/10.1080/09208119408964774 - 15. Ataei, M. and Osanloo, M. (2003) Using a Combination of Genetic Algorithm and the Grid Search Method to Determine Optimum Cutoff Grades of Multiple Metal Deposits. International Journal of Mining, Reclamation and Environment, 18, 60-78.
- 16. Nie, X., Chen, Y. and Lu, C. (2007) Application of Genetic Algorithm in Optimizing Open-Pit Development System. Metal Mine.
- 17. Pendharkar, P.C. and Rodger, J.A. (2000) Nonlinear Programming and Genetic Search Application for Production Scheduling in Coal Mines. Annals of Operations Research, 95, 251-267.
http://dx.doi.org/10.1023/A:1018958209290 - 18. He, M., Wei, J., Lu, X. and Huang, B. The Genetic Algorithm for Truck Dispatching Problems in Surface Mine. Information Technology Journal, 9, 710-714.
- 19. Vayenas, N. and Nuziale, T. (2001) Genetic Algorithms for Reliability Assessment of Mining Equipment. Journal of Quality in Maintenance Engineering, 7, 302-311.
http://dx.doi.org/10.1108/13552510110407087 - 20. Kanji, G.K. (2006) 100 Statistical Tests. SAGE Publications, London, 198.
- 21. Law, A.M. and Kelton, W.D. (2000) Simulation Modeling and Analysis. McGraw-Hill, Boston.
- 22. Wu, X. (2009) Reliability Assessment of Mobile Mining Equipment Using Genetic Algorithms Combined with Maintenance Analysis: A Case Study of a Fleet of Load-Haul-Dump (LHD) Vehicles. Master’s Thesis, Laurentian University, Sudbury.
- 23. Vayenas, N., Wu, X. and Peng, S. (2010) Application of Genetic Algorithms for Reliability Assessment of Two Mine Hoisting Systems.
- 24. Vayenas, N., Runciman, N. and Clement, S.R. (1997) A Methodology for Maintenance Analysis of Mining Equipment. International Journal of Surface Mining, Reclamation and Environment, 11, 33-40.
http://dx.doi.org/10.1080/09208119708944053 - 25. ABB (2014) Mine Hoist Systems Safe and Reliable for All Needs.
- 26. De la Vergne, J. (2003) Hard Rock Miner’s Handbook. 3rd Edition, McIntosh Engineering, North Bay.
- 27. Palisade Corporation @Risk (2005) Risk Analysis and Simulation Add-In for Microsoft Excel. Version 4.5, November, 2005.
- 28. Xu, C. (2014) Application of GenRel for Maintainability Analysis of Underground Mining Equipment: Based on Case Studies of Two Hoist Systems. Master’s Thesis, Laurentian University, Sudbury.