Open Access Library Journal
Vol.02 No.05(2015), Article ID:68387,12 pages
10.4236/oalib.1101496
A Novel Approach to Unravel Gait Dynamics Using Symbolic Analysis
Chandrakar Kamath
Shantha Nilaya, Ananthnagar, Manipal, India
Email: chandrakar.kamath@gmail.com
Copyright © 2015 by author and OALib.
This work is licensed under the Creative Commons Attribution International License (CC BY).
http://creativecommons.org/licenses/by/4.0/


Received 20 April 2015; accepted 6 May 2015; published 15 May 2015
ABSTRACT
Hypothesizing that a mere binary partition in symbolic analysis may not be sufficient to capture the dynamics in gait signals, we attempted to find how far the symbolic analysis with six partitions helps to characterize the nonlinear properties of gait signals and thereby discriminate between healthy control and neurodegenerative disordered gait signals. Differences found in the symbolic entropies of the healthy control and neurodegenerative disorder groups facilitated classification between the groups with higher accuracy. The differences found in the percentage of ordinal patterns provided a visual compact presentation to recognize the hidden variability patterns in the different gait signals.
Keywords:
Gait Signal, Neurodegenerative Disorder, Nonlinear Dynamics, Ordinal Patterns, Symbolic Analysis
Subject Areas: Bioengineering, Neuroscience

1. Introduction
Physiological data more often demonstrate complex structures which cannot be quantified or interpreted using linear methods. The conventional nonlinear methods suffer from the disadvantage of dimensionality. Further, there are not enough samples in the time series to arrive at a reasonable estimate of the nonlinear measures. From this point of view it is sensible to resort to methods like the symbolic dynamics, which can quantify system dynamics even for short time series. Collet and Eckmann have proved that symbolic dynamics can provide a complete description of the dynamics of a system under investigation [1] . Further, symbolic analysis provides new parameters independent of those derived from time domain or frequency domain. Other advantages of this analysis include increase in efficiency of numerical computations compared to what it would be for original data and lower sensitivity to measurement noise. Also, to apply symbolic analysis, there is no need for a priori knowledge of the disease states or we do not have to make any assumptions about the structure of the underlying dynamical system. That is to say that the approach applies equally well to linear or nonlinear, deterministic or stochastic systems. Further, symbolic analysis has well defined measures of uncertainty and complexity which provide guidelines to fix an appropriate model for the given data. The approach of symbolic analysis of time series is recommended when the data is characterized by a low degree of precision, i.e., when the available information is essentially qualitative. Symbolic time series analysis involves the transformation of the original time series into a series of discretized symbols that is processed to extract useful information about the state of the system generating the process.
Symbolic time series analysis has found profound application during the past few decades in the field of complexity analysis, including combustion [2] , multiphase flow [3] , astrophysics, geomagnetism, geophysics, classical mechanics, medicine and biology, plasma physics, robotics, communication, and linguistics [4] , and encephalography [5] . Kurths et al. [6] , Porta et al. [7] , Tobaldini et al. [8] , and Voss et al. [9] - [10] have applied symbolic dynamics on RR interval series successfully to study heart rate variability. Symbolic time series analysis has been seldom tried to evaluate gait dynamics under different conditions. Aziz and Arif [11] employed threshold dependent symbolic entropy with binary-partition quantization (symbols 0 and 1) in the complexity analysis of stride interval time series and showed that the symbolic entropy can discern control from neurodegenerative disease subjects for a certain range of thresholds. Qumar et al. [12] compared multiscale entropy analysis and symbolic time series analysis and showed that the latter outperformed the former in discriminating normal and metronomically paced stressed walking. In a different study, Abbasi and Loun [13] applied normalized corrected symbolic entropy on symbolic sequences and found that the voluntary output of human locomotors system was more complex during unconstrained normal walking as compared with slow, fast or metronomically paced walking.
Aziz and Arif’s [11] methodology employed a binary-partition and symbolic entropy with a threshold. Binary partitions are useful for extracting deterministic patterns when high noise is present, but these can miss distinctive intermediate scale features useful for diagnostics. This is because there is strong evidence that mechanisms generating gait signals obey nonlinear deterministic laws and that these processes are chaotic [14] - [16] . Hence, a good option is to partition the data range into 2 - 10 equiprobable partitions [17] . This approach removes threshold dependency of the entropy as well. Symbol alphabets greater than 10 tend to capture too much detail at the expense of global patterns. Equiprobable partitioning allows distinction between stochastic and deterministic structure because nonrandom patterns show up as peaks in the symbol sequence histogram. Hypothesizing that binary-partition symbolization (with symbols labelled 0 and 1) may not be sufficient to capture the important and robust dynamical properties of gait signal variations, in this work, we employ six-partition symbolization (with symbols labelled from 0 to 5, both inclusive) to discern different pathological gait signals. We show that our approach to symbolic dynamics analysis permits to identify different ordinal temporal patterns (some of which cannot be captured with binary-partition) and their percentage variations in the stride dynamics to understand the differences between the control and pathological subjects, as well as differences among various pathological diseases. Monitoring and evaluating accurate reliable gait characteristics over time will facilitate early diagnosis of neurodegenerative disorders and help to identify the best treatment to avoid complications.
2. Methods and Materials
The paper is organized as follows. Section 2.1 discusses the database which is widely used in stride analysis. Section 2.2 discusses the pre-processing of the gait data used in this work. Sections 2.3 to 2.5 explain the measures used to evaluate fluctuation magnitude and fluctuation dynamics of stride-to-stride variability in detail. In particular, Section 2.3 deals with coefficient of variation (CV) and standard deviation of the detrended stride time series (SDdetrended), while Sections 2.4 and 2.5 deal with symbolic dynamics and symbolic entropy feature. Statistical tests used and ROC analysis for decision making and binary classification and its significance in diagnosis are discussed in Section 2.6. Gait symmetry and the measures used to evaluate the same are dealt with in Section 2.7. In Section 3 we discuss the results.
2.1 Database
The database used in this study is contributed by Hausdorff et al. [18] [19] and can be downloaded from the physionet.org [20] . The database includes stride time series from 13 amyotrophic lateral sclerosis (ALS) patients (10 males and 3 females, age mean ± standard deviation: 55.6 ± 12.8 years old), 15 Parkinson’s disease (PD) patients (10 males and 5 females, age mean ± standard deviation: 66.80 ± 10.85 years old), 20 Huntington’s disease (HD) patients (6 males and 14 females, age mean ± standard deviation: 46.65 ± 12.60 years old), and 16 healthy control subjects (2 males and 14 females, age mean ± standard deviation: 39.3 ± 18.5 years old). Heights and weights in the four groups were not significantly different. It was confirmed that the patients were free from other pathologies which might lead to lower extremity weakness only participated. Over the duration of treatment the medication usage was not changed. It was also confirmed that the healthy subjects were free from visual, respiratory, cardiovascular, or other neurological diseases.
The subjects from the four groups were asked to walk at their normal pace up and down a 77 m long hallway for 5 min. To measure the gait rhythm and the timing of the gait cycle, force sensitive insoles were place inside or under subject’s shoes. These sensors produce a measure proportional to the force applied to the ground during movement. The output from the footswitches which corresponds to force signal is sampled at 300 Hz and digitized using an analog-to-digital converter and then stored in a recorder. The recorded data is then analyzed using a validated software that determined initial and end contact times (and also, stride and swing times) of each stride.
2.2 Pre-Processing the Gait Data
Before the application of the method of analysis it is necessary to pre-process the gait data. To minimize the start-up effects the samples in the first 20 seconds of the recordings are removed [18] . Over the monitoring interval of 5 minutes, each time the subject reached the end of the hall-way the subject had to turn around and continue walking. The strides associated with these turning events are to be treated as outliers and should be removed from the rest of the time series. To remove the outliers we employ the three-sigma-rule [21] , which states that 99.7% of the normally distributed probability values lie within the range of (mean ± 3.SD), where SD is the standard deviation. This implies that those samples which lie outside the range (median ± 3.SD) are outliers and hence, can be removed. In the removal process, median value and not, the mean value of the time series has been used because some outliers possessed large values and would affect the computation of the mean.
2.3 Measures of Fluctuation Magnitude of Stride-to-Stride Variability
It is often difficult to use the usual standard deviation to compare measurements from different populations. To get round this problem, two measures are used to assess the magnitude of stride-to-stride variability and gait unsteadiness: 1) coefficient of variation (CV) original stride time series; and 2) standard deviation of the detrended stride time series (SDdetrended). It is important to note that both of these measures are not sensitive to changes in the ordering of the stride intervals or stride dynamics. That is to say, randomly ordering the time series will not affect these measures.
The CV expresses the standard deviation as a percentage of what is being measured relative to the sample or population mean. CV is a normalized measure of stride-to-stride variability. It is defined as the ratio of the standard deviation (SD) σ to mean µ as, CV = σ/µ. It shows the extent of variability in relation to mean of the population. It provides a measure of relative variability. The only advantage is that it lets you compare the scatter of variables expressed in different units.
The standard deviation of a time series, in general, provides a measure of overall variations in the gait with respect to mean. It is a metric for absolute variability. This measure may be influenced by the trend in the data and may fail to differentiate between a walk with large changes from stride to next and one in which stride changes are small. To minimize effects of local changes in the mean the time series is detrended. The detrended stride time series refers to time series from which the trend is removed. Detrending can be carried out by computing the first difference of the time series or removing the least-squares-fit straight line. In this study, the former method is used for detrending. SDdetrended is a measure of variability which minimizes the effects of the local changes in the mean.
2.4 Measure of Fluctuation Dynamics of Stride-to-Stride Variability
Fluctuation dynamics is about how the stride interval changes from one stride to the next, independent of the variance. To quantify how the dynamics fluctuates over time during walk, we employ symbolic entropy, which is explained in detail below.
2.5. Symbolic Dynamics and Symbolic Codes
Symbolic dynamics is an efficient approach to investigate the dynamic aspects of the signal of interest. The concept of symbolic dynamics is based on a coarse-graining of the dynamics [9] . That is, the range of original observations is partitioned into a finite number of regions and each region is associated with a specific symbolic value so that each observation is uniquely mapped to a particular symbol depending on the region into which it falls. Thus, the original observations are transformed into a series of same length but the elements are only a few different symbols (letters from the same alphabet), the transformation are being termed symbolization.
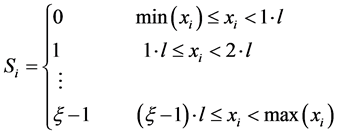
If xi represents the time series and Si is the corresponding symbolic time series that comprises the full range of dynamics of xi, the difference between the minimum and the maximum of xi is divided into a ξ quantization partitions each of size l = (max(xi) ? min(xi))/ξ. Hence, this transformation leads to an alphabet A = {0, 1,..., ξ-1} [17] . The transformation is as below.
 (1)
(1)
In this work, the number of partitions is fixed to ξ = 6. The advantages of this kind of symbolization are (1) ease of computation and (2) robustness against noise.
A general rule of thumb is that the partitions must be such that the individual occurrence of each symbol is equiprobable with all other symbols or the measurement range covered by each region is equal. This is done to bring out ready differences between random and nonrandom symbol sequences. The transformations into symbols have to be chosen context dependent. For this reason, we use complexity measures on the basis of such context-dependent transformations, which have a close connection to physiological phenomena and are relatively easy to interpret. This way the study of dynamics simplifies to the description of symbol sequences. Some detailed information is lost in the process but the coarse, invariant, and robust dynamic behaviour is conserved and can be analyzed [9] . After symbolization the next step in the identification of temporal patterns is the construction of symbol sequences of specific length L, termed words, from the symbol series by gathering groups of symbols in the temporal order. L is called the word length. In this work, word length is set to L = 3. This sequencing process involves definition of a template of finite length L that can be moved along the symbol series one symbol at a time, each step revealing a new sequence/word. If each possible new sequence is identified by a unique identifier the resulting series will be a new time series, termed word-sequence series. For symbolization with a number of partitions ξ = 6 and a word length L = 3, there shall be a maximum of ξL (63 = 216) words. This is a compromise of retaining important dynamical information, on one hand and of having a robust statistics to estimate probability distribution, on the other hand. The next step is to evaluate the relative frequency of occurrence of all possible words. A simple way to keep track word-sequence frequencies is to assign a unique value, called symbolic code, to each word by computing the corresponding base-10 value for each base-ξ word, where, ξ is the number of partitions. The subsequent step is to plot symbol-sequence histogram which is a plot of symbol-sequence frequencies as a function of symbolic codes and evaluate the measure of complexity, i.e. Shannonentropy which we call symbolic entropy, explained in the following section. Because of the above rule of thumb for partitioning, for a truly random data the relative frequency of all possible symbolic codes will be equal. This implies that any significant deviation from this equiprobable feature is an indication of deterministic characteristic of the given data, the more the deviation the more is the data deterministic and time correlated.
There are several quantities that properly characterize such symbol strings. Next, from the above symbolization we compute ordinal patterns to describe relations within words of length L (3-consecutive time points, in our case) of a given time series. All possible patterns are grouped without loss into 3 major classes based on variability, referred to as (1) patterns with no or 0-variation, with all the three consecutive symbols being equal; (2) patterns with 1-variation, with two consecutive symbols being equal and the remaining being different; (3) patterns with 2-variations (these patterns cannot be identified with binary-partition), with each symbol being different from the adjacent one. We call these pattern classes respectively, by no-variation, small-variation, and large-variation pattern classes. Patterns with 1-variation are further divided into 4 subclasses, two subclasses with first two consecutive symbols being equal and the third symbol being different and remaining two subclasses with first symbol being different and the last two symbols being equal. Patterns with 2 variations are further divided into 4 subclasses, two subclasses with like variations and two subclasses with unlike variations. In all, we have 9 subclasses one for each ordinal pattern {0V, 1V1, 1V2, 1V3, 1V4, 2V1, 2V2, 2V3 and 2V4}. Representative illustrations in Figure 1 show these ordinal patterns of consecutive three time-point data. Both x and y scales are arbitrary. Figure 1(a) depicts 0-variation pattern, Figures 1(b)-(e) depict 1-variation patterns and Figures 1(f)-(i) depict 2-variation patterns. In this framework, we investigate the frequency distribution (relative frequencies) of each of the ordinal patterns from the alphabet {0V, 1V1, 1V2, 1V3, 1V4, 2V1, 2V2, 2V3 and 2V4}, tabulate the percentage of ordinal patterns and perform pattern classification.
Assuming that 3 patterns (3 major classes) based on variability are sufficient for visual inspection to bring out better differences among the variability classes we investigate the frequency distribution (relative frequencies) of each of the variability patterns from the alphabet {0V, 1V, and 2V}, plot the corresponding bar graph for the percentage of symbolic indices and perform pattern classification. On a percentage basis, the sum of normalized symbolic indices will be 100% (i.e., 0V% + 1V% + 2V% = 100%) and each can increase or decrease at the cost of others.
2.6. Measure of Complexity
The measure of complexity is the symbolic entropy defined below [2] . A larger value implies higher complexity and a smaller value implies a lower complexity. From the probabilities p(sk) of words of length k we evaluate kth order Shannon entropy (symbolic entropy) as given by
 (2)
(2)
2.7. Statistical and Receiver Operating Characteristic (ROC) Analyses
Kruskal-Wallis tests are used to evaluate the statistical differences among Symbolic entropies of the gait of healthy control and neurodegenerative disorder classes. These non-parametric tests are used because they make no assumption about the underlying distribution of the data. A p-value ≤ 0.05 is considered statistically significant. If significant differences between classes are found, then the ability of the nonlinear analysis method to discriminate gait of healthy control and neurodegenerative disorder states is evaluated using receiver operating characteristic (ROC) plots in terms of area under ROC curve (AUC) [22] . ROC curves are obtained by plotting sensitivity values (which represent that proportion of states identified as neurodegenerative disorder) along the y axis against the corresponding (1-specificity) values (which represent the proportion of the correctly identified healthy control states) for all the available cut off points along the x axis. Accuracy is a related parameter that

Figure 1. Ordinal patterns: (a) 0-variation (no-variation) pattern; (b)-(e) 1-variation (small-variation) patterns; (f)-(i) 2- variation (large-variation) patterns.
quantifies the total number of states (both healthy control and neurodegenerative disorder states) precisely classified. The AUC measures this discrimination, that is, the ability of the test to correctly classify stride of healthy control and neurodegenerative disorder classes and is regarded as an index of diagnostic accuracy. The optimum threshold is the cut-off point in which the highest accuracy (minimal false negative and false positive results) is obtained. This can be determined from the ROC curve as the closet value to the left top point (corresponding to 100% sensitivity and 100% specificity). An AUC value of 0.5 indicates that the test results are better than those obtained by chance, where as a value of 1.0 indicates a perfectly sensitive and specific test.
3. Results and Discussion
After pre-processing the gait data as explained in Section 2.2, it is necessary to normalize the data by subtracting from each sample the mean of the time series and dividing the result by the standard deviation of the time series. Normalization removes most of the very large within and across-subject variability in the signal under consideration. Normalization also tends to produce values that are more exchangeable across different laboratories and research studies.
Unlike a linear measure which focuses on the magnitude of variation in a distribution irrespective of the order in which data points accumulate, a nonlinear measure is explicitly concerned with the temporal evolution of structure of the data variability and hence, may unravel more meaningful information. In this study, first we investigate the linear statistics of stride time series of healthy controls and neurodegenerative diseases. Each gait record (left and right), in each group, is divided into segments, with 28 strides per segment. A thumb rule to select segment length is that it must be long enough to reliably estimate the measure of interest, while it must be short enough to accurately capture local activities. For each segment the variability measures are computed and the results of a particular group are averaged. Table 1 shows the linear measures of fluctuation magnitude of stride-to-stride variability characteristic of healthy control and neurodegenerative disorder groups (left and right) time series. All the variability measures are expressed as mean ± SD. The table shows differences among the three patient groups, possibly indicating differences in neuropathology. It is found that the average stride time is longer in all the neurodegenerative disorder groups compared to that of control group. The two measures of fluctuation magnitude, CV and SDdetrend, are also considerably increased in neurodegenerative disorder groups compared to those of the control group. The CV of patients with ALS, was nearly twice while with PD (right- foot) and HD (left-foot), was nearly thrice as that observed in control subjects. The SDdetrend in neurodegenerative disease group, was also much more than that of control group. These results indicate that the magnitude of stride-to-stride variability in ALS, PD, and HD patients is significantly increased by neurodegenerative diseases. It is important to note that little difference in fluctuations of left-foot and right-foot time series and their variability is a typical feature of healthy motor system. This is necessary to accommodate some adaptability to external perturbations (e.g. change in direction and speed, obstacle avoidance). From the results it is found that both left-foot and right-foot time series in the control group show only very small differences in fluctuation magnitude of stride variability which reflect functional differences in the contribution of each limb to propulsion and control during walking. This is because of the fact that the data was collected through hall-way usual straight walking (without any obstacles). The same, however, is not true in regard to patients from neurodegenerative disorder groups. This implies that the degenerative effect of the neurodegenerative disorder on the fluctuation magnitude variability of left-foot and right-foot strides is not the same. This conclusion is in agreement with those of the earlier studies [23] . More details on assessment of asymmetry indices are discussed below. Kruskal-Wallis tests are performed to evaluate the statistical differences between the different measures of four groups. The test detected significant group differences (In the case of CV, p = 0 and chi-square > 159.40 for left-foot stride analysis while p = 0 and chi-square > 170.05 for right-foot stride analysis; In the case of SDdetrended, p = 0 and chi-square > 159.52 for left-foot stride analysis while p = 0 and chi-square > 167.63 for right- foot stride analysis).
Now, we investigate dynamic features of particularly short stride-to-stride sequences in the order of 60 consecutive stride intervals by means of symbolic dynamics. For this, each gait record (left and right) is divided into segments each with 60 samples, in the case of healthy controls as well as neurodegenerative disorder gait records. We carefully avoided nonstationary segments of the gait records, since stationarity is a requirement for symbolic analysis. Symbolic dynamics is applied to each of these different segments to decide whether a particular segment belongs to normal, ALS, Parkinson, or Huntington group. Equation (1) is applied on each seg-

Table 1. Gait rhythm variability parameters of healthy control and neurodegenerative disease groups.
ment to arrive at a symbol string with a range of six possible symbols {0, 1, 2, 3, 4, 5}. From this symbolization we compute words/symbolic codes of length L = 3. As mentioned above, with a number of symbols ξ = 6 in the alphabet and a word length L = 3, there shall be a maximum of ξL (63 = 216) words/symbolic codes.The relative frequencies of each of the words/symbolic codes are computed for each segment and averaged over all the records of each group and the symbolic sequence histogram is plotted for each group. Also, for each segment the symbolic entropy is computed and averaged over all the records of the respective group. Figure 2(a) through Figure 2(d) compares these averaged symbolic sequence histograms for normal and neurodegenerative disorder subjects. The relative frequency distribution of patterns for the four cases is found to be distinctly different. This indicates that there is a difference in the dynamics governing the gait time series of normal and neurodegenerative disorder subjects. The corresponding distribution of symbolic entropy is portrayed in Figure 3(a) using Box-whisker plots and a comparison statistics (mean ± SD) is shown (left and right) in Table 2. Kruskal-Wallis tests are performed to evaluate the statistical differences among the symbolic entropy measures of four groups. The test detected significant group differences (p = 0 and chi-square >148.66 for right-foot stride analysis while p = 0 and chi-square >93.43 for left-foot stride analysis). Healthy controls show comparatively high entropy values and neurodegenerative groups indicate low entropy values. This implies that there is loss of complexity in disease states with ALS group affected the maximum and Huntington the least. Next, multiple Wilcoxon rank- sum tests are performed to compare two groups at a time. The Wilcoxon rank-sum test is equivalent to a Mann- Whitney U-test. Descriptive group results are shown (for right-foot stride time series) in Table 3. The test detected significant group differences as is evident from the Table 3. This implies that symbolic entropy of symbolic dynamics is readily able to distinguish between healthy control from neurodegenerative disorder groups, as well as separate one neurodegenerative disorder group from the other.
Now, we evaluate the diagnostic capacity of symbolic entropy in different discriminations using ROC analysis. The corresponding ROC plots are shown in Figure 3(b) for the case of right-foot. The group results of evaluation of diagnostic parameters of the symbolic entropy in separating neurodegenerative disorder and control groups for the right-foot stride time series is summarized in Table 4. It is found that the entropy performs very well in its diagnostic ability, in separating healthy control subjects from those suffering from ALS, Parkinson, and Huntington diseases. The percentage frequency distribution of the nine ordinal patterns from the alphabet {0V, 1V1, 1V2, 1V3, 1V4, 2V1, 2V2, 2V3 and 2V4} for the healthy control and neurological disease groups are summarised in Table 5. Compared to the ordinal patterns in the healthy controls the change in variability in the corresponding patterns of the neurological groups are indicated by upward (↑) or downward (↓) arrows representing respectively an increase or a decrease. The following inferences can be drawn. While the 0V% patterns increase, the 1V2% and 1V4% patterns decrease in the disorder cases relative to healthy control group. All the four 2V% patterns decrease in ALS and Parkinson patients, while these increase in Huntington patients. An increase in 0V% signifies that gait variability becomes more periodic and predictable in the neurodegenerative disordered groups. The changes in other patterns (increase or decrease) imply that the self adaptability of gait variability decreases or becomes disordered from that of normal in neurological patients. To arrive at a more comprehensive picture we investigate the frequency distribution of each of the variability patterns from the alphabet {0V, 1V, and 2V} and plot the percentage of ordinal patterns which provides a visual compact presentation to recognize the hidden patterns in the gait signal. The plots of the bar graph for the percentage of symbolic indices in the case of healthy control and neurodegenerative disorder groups are displayed in Figure 4(a) through Figure 4(d). The following conclusions can be drawn. The 0V% patterns increase in the neurological disorder cases relative to healthy control group, with the highest increase seen in the case of ALS. The 1V%

 (a) (b)
 (c) (d)
Figure 2. Averaged symbolic sequence histograms of the (a) Healthy control; (b) ALS; (c) Parkinson; (d) Huntington groups.

 (a) (b)
Figure 3. (a) Distribution of symbolic entropy of the Healthy control, ALS, Parkinson, and Huntington groups using box- whisker plots; (b) ROC analysis of symbolic entropy between control and ALS groups, between control and Parkinson groups, and between control and Huntington groups.

 (a) (b)
 (c) (d)
Figure 4. Plots of the bar graph for the percentage of symbolic indices {0V, 1V, and 2V} in the case of (a) Healthy control; (b) ALS; (c) Parkinson; and (d) Huntington groups.
Table 2. Distribution of Shannon entropy of control and neurodegenerative disease right-foot and left-foot gait data (All values are expressed as mean ± SD).
patterns decrease in the neurological disorder cases, with the maximum decrease found again in ALS. The 2V% patterns exhibit a decrease in ALS and Parkinson, while an increase in the case of Huntington disease. In the healthy control, 1V% (small-variation) and 2V% (large-variation) patterns dominate with almost equal weight compared to 0V% (no-variation) patterns. This implies that the stride dynamics supports more variability patterns than no-variability patterns indicating an adaptation in stride variability. In the ALS patients, 0V% patterns increase at the cost of 1V% and 2V% patterns so that all the three patterns exhibit almost an equal weight. This means that the stride dynamics supports more no-variability patterns than small and large variability patterns indicating a loss of variability. In the case of Parkinson disorder, with 1V% maintained compared to normal, 0V%
Table 3. Descriptive results of Wilcoxon rank-sum tests for comparison of Shannon entropy of two groups at a time (right- foot stride time series). ranksum is the value of the rank sum test statistic.
Table 4. Results of evaluation of diagnostic quality of Shannon entropy in separating healthy control and neurodegenerative disease groups (right-foot stride time series) using ROC plots.
Table 5. Comparison of percentage of nine ordinal patterns in the four groups. A relative increase or decrease of the pattern in a disease group with respect to that of healthy control is shown by ↑ or ↓, respectively.
increases at the cost of 2V% so that 0V% and 1V% patterns dominate compared to 2V% patterns. This means that the gait dynamics sustains no-variability and small variability patterns indicating loss of large variability. Finally in the Huntington disorder, the 0V% patterns are maintained compared to healthy controls, while 2V% patterns increase at the cost of 1V% patterns. This shows that in the Huntington case the gait dynamics supports no-variability and large variability patterns, indicating rigidity in small variability.
The important findings of this work can be summarised as below. Symbolic dynamic analysis with 6 partitions can discern healthy controls from neurodegerative disordered subjects with higher accuracy since patterns with 2-variations cannot be identified with binary-partition. The plot of the percentage of ordinal patterns from the alphabet {0V, 1V, and 2V} provides a visual compact presentation and a more comprehensive picture to recognize the hidden patterns in the gait signal. The healthy control exhibit 1V% (small-variation) and 2V% (large-variation) patterns dominance with almost equal weight compared to 0V% (no-variation) patterns. Thus, the healthy stride dynamics supports more variability patterns than no-variability patterns, indicating an adaptation in stride variability. Unlike healthy subjects, 0V% patterns considerably dominate at the cost of 1V% or/and 2V% patterns in ALS and Parkinson patients, implying loss of small and large variability patterns in these patients. On the other hand, in Huntington patients, 2V% patterns considerably dominate at the cost of 1V% patterns, implying loss of small variability patterns.
A limitation of this study is the small sample size. Factors like high variance, age differences, and differing male-to-female ratios between groups will have an impact on the results when statistical analyses are carried out on small sample sizes. However, it has been shown that the effect of gender on usual gait patterns is considerably small [24] . Though the effect of age on gait is complex, the effect of neurodegenerative disorders considerably predominates over the aging effects. This implies that the discrimination using this method stands irrespective of the above limitations.
4. Conclusion
The main objective of this study is to show that a symbolic dynamic analysis with six partitions captures stride dynamics better than that with a binary-partition and can discern healthy controls from neurodegerative disordered subjects with higher accuracy. The plot of the percentage of ordinal patterns from the alphabet {0V, 1V, and 2V} provides a visual compact presentation and a more comprehensive picture to recognize the hidden variability patterns in the gait signals. This new perspective might be useful in the evaluation of other neuropathological situations of the locomotor system as well.
Conflict of Interests
The author declares that there is no conflict of interests regarding the publication of this article.
Biographical Notes
Chandrakar Kamath received his BE degree from Mysore University in the year 1978 and M. Tech degree from Mangalore University in the year 1989. Till recently he has been working as a Professor in the Department of Electronics and Communication Engineering at Manipal Institute of Technology, Manipal Univerity. He has published several papers in International and Indexed Journals. His research interests include nonlinear dynamics, chaotic theory, time-scale analysis, linear and nonlinear signal processing.
Cite this paper
Chandrakar Kamath, (2015) A Novel Approach to Unravel Gait Dynamics Using Symbolic Analysis. Open Access Library Journal,02,1-12. doi: 10.4236/oalib.1101496
References
- 1. Collet, P. and Eckmann, J.P. (1980) Iterated Maps on the Interval as Dynamical Systems. Birkhäuser, Basel.
- 2. Daw, C.S. (1998) Observing and Modeling Nonlinear Dynamics in an internal Combustion Engine. Physical Review E, 57, 2811-2819.
http://dx.doi.org/10.1103/physreve.57.2811 - 3. Finney, C.E.A., Nguyen, K., Daw, C.S. and Halow, J.S. (1998) Symbol-Sequence Statistics for Monitoring Fluidization. Proceedings of the ASME Heat Transfer Division, 405-411.
- 4. Daw, C.S., Finney, C.E.A. and Tracy, E.R. (2003) A Review of Symbolic Analysis of Experimental Data. Review of Scientific Instruments, 74, 915-930.
http://dx.doi.org/10.1063/1.1531823 - 5. Xu, J.H., Liu, Z.R. and Liu, R. (1994) The Measures of Sequence Complexity for EEG Studies. Chaos, 4, 2111-2119.
- 6. Kurths, J., Voss, A., Saparin, P., Witt, A., Kleiner, H.J. and Wessel, N. (1995) Quantitative Analysis of Heart Rate Variability. Chaos, 5, 88-94.
http://dx.doi.org/10.1063/1.166090 - 7. Porta, A., D’Addio, G., Pinna, G.D., Maestri, R., Gnecchi-Ruscone, T., Furlan, R., Montano, N., Guzzetti, S. and Malliani, A. (2005) Symbolic Analysis of 24h Holter Heart Period Variability Series: Comparison between Normal and Heart Failure Patients. Computers in Cardiology, Lyon, 25-28 September 2005, 575-578.
http://dx.doi.org/10.1109/cic.2005.1588166 - 8. Tobaldini, E., Porta, A., Wei, S-G., Zhang, Z-H., Francis, J., Casali, K.R., Weiss, R., Felder, M.R. and Montano, B.N. (2009) Symbolic Analysis Detects Alterations of Cardiac Autonomic Modulation in Congestive Heart Failure Rats. Autonomic Neuroscience: Basic and Clinical, 150, 21-26.
http://dx.doi.org/10.1016/j.autneu.2009.03.009 - 9. Voss, A., Kurths, J., Kleiner, H.J., Witt, A., Wessel, N., Saparin, P., Osterziel, K.J., Schurath, R. and Dietz, R. (1996) The Application of Methods of Nonlinear Dynamics for the Improved and Predictive Recognition of Patients Threatened by Sudden Cardiac Death. Cardiovascular Research, 31, 419-433.
- 10. Voss, A., Schroeder, R., Vallverdu, M., Cygankiewicz, I., Vazquez, R., Bayes de Luna, A. and Caminal, P. (2008) Linear and Nonlinear Heart Rate Variability Risk Stratification in Heart Failure Patients. Computers in Cardiology, 35, 557-560.
- 11. Aziz, W. and Arif, M. (2006) Complexity Analysis of Stride Interval Time Series by Threshold Dependent Symbolic Entropy. European Journal of Applied Physiology, 98, 30-40.
http://dx.doi.org/10.1007/s00421-006-0226-5 - 12. Qumar, A., Aziz, W., Saeed, S., Ahmed, I. and Hussain, L. (2013) Comparative Study of Multiscale Entropy Analysis and Symbolic Time Series Analysis When Applied to Human Gait Dynamics. Proceedings of the 2013 International Conference on Open Source Systems and Technologies (ICOSST), Lahore, 16-18 December 2013, 126-132.
http://dx.doi.org/10.1109/ICOSST.2013.6720618 - 13. Abbasi, A.Q. and Loun, W.A. (2014) Symbolic Time Series Analysis of Temporal Gait Dynamics. Journal of Signal Processing Systems, 74, 417-422.
http://dx.doi.org/10.1007/s11265-013-0836-1 - 14. Stergiou, N., Harbourne, R.T. and Cavanaugh, J. (2006) Optimal Movement Variability: A New Theoretical Perspective for Neurologic Physical Therapy. Journal of Neurologic Physical Therapy, 30, 120-129.
http://dx.doi.org/10.1097/01.NPT.0000281949.48193.d9 - 15. Kaipust, J.P., Mc Grath, D., Mukherjee, M. and Stergiou, N. (2012) Gait Variability Is Altered in Older Adults When Listening to Auditory Stimuli with Differing Temporal Structures. Annals of Biomedical Engineering, 41, 1595-1603.
http://dx.doi.org/10.1007/s10439-012-0654-9 - 16. Harbourne, R.T. and Stergiou, N. (2009) Perspective on Movement Variability and the Use of Nonlinear Tools: Principles to Guide Physical Therapy Practice. Physical Therapy, 89, 267-282.
http://dx.doi.org/10.2522/ptj.20080130 - 17. Porta, A., Tobaldini, E., Guzzeti, S., Furlan, R., Montano, N. and Gnecchi-Ruscone, T. (2007) Assessment of Cardiac Autonomic Modulation during Graded Head-Up Tilt by Symbolic Analysis of Heart Rate Variability. AJP: Heart and Circulatory Physiology, 293, H702-H708.
http://dx.doi.org/10.1152/ajpheart.00006.2007 - 18. Hausdorff, J.M., Lertratanakul, A., Cudkowicz, M.E., Peterson, A.L., Kaliton, D. and Goldberger, A.L. (2000) Dynamic Markers of Altered Gait Rhythm in Amyotrophic Lateral Sclerosis. Journal of Applied Physiology, 88, 2045-2053.
- 19. Hausdorff, J.M., Cudkowicz, M.E., Firtion, R., Wei, J.Y. and Goldberger, A.L. (1998) Gait Variability and Basal Ganglia Disorders: Stride-to-Stride Variations in Gait Cycle Timing in Parkinson and Huntington’s Disease. Movement Disorders, 13, 428-437.
http://dx.doi.org/10.1002/mds.870130310 - 20. Moody, G.B., Mark, R.G. and Goldberger, A.L. (2001) PhysioNet: A Web-Based Resource, for the Study of Physiologic Signals. IEEE Engineering in Medicine and Biology Magazine, 20, 70-75.
http://dx.doi.org/10.1109/51.932728 - 21. Hahn, G.J. and Shapiro, S.S. (1994) Statistical Models in Engineering. Wiley, Hoboken.
- 22. Zweig, M.H. and Campbell, G. (1993) Receiver-Operating Characteristic (ROC) Plots: A Fundamental Evaluation Tool in Clinical Medicine. Clinical Chemistry, 39, 561-577.
- 23. Sadeghi, H., Allard, P., Prince, F. and Labelle, H. (2000) Symmetry and Limb Dominance in Able-Bodied Gait: A Review. Gait and Posture, 12, 34-45.
http://dx.doi.org/10.1016/S0966-6362(00)00070-9 - 24. Gabell, A. and Nayak, U.S.L. (1984) The Effect of Age on Variability in Gait. Journal of Gerontology, 39, 662-666.
http://dx.doi.org/10.1093/geronj/39.6.662