 International Journal of Geosciences, 2011, 2, 195-203 doi:10.4236/ijg.2011.23021 Published Online August 2011 (http://www.SciRP.org/journal/ijg) Copyright © 2011 SciRes. IJG Web-Based Spatial Decision Support System and Watershed Management with a Case Study Yanli Zhang1, Ramanathan Sugumaran2, Matthew McBroom1, John DeGroote2, Rebecca L. Kauten3 Paul K. Barten4 1Arthur Temple College of Forestry and Agriculture, Stephen F. Austin State University, Nacogdoches, USA 2Department of Ge ography, University of Northern Iowa, Cedar Falls, USA 3Iowa Dept. of Natural Resources, Des Moines, USA 4Department of Environmental Conservation, University of Massachusetts, Amherst, USA E-mail: zhangy2@sfasu.edu Received May 7, 2011; revised June 12, 2011; accepted July 21, 2011 Abstract In order to maintain a proper balance between development pressure and water resources protection, and also to improve public participation, efficient tools and techniques for soil and water conservation projects are needed. This paper describes the development and application of a web-based watershed management spatial decision support system, WebWMPI. The WebWMPI uses the Watershed Management Priority Indices (WMPI) approach which is a prioritizing method for watershed management planning and it integrates land use/cover, hydrological data, soils, slope, roads, and other spatial data. The land is divided into three catego- ries: Conservation Priority Index (CPI) land, Restoration Priority Index (RPI) land, and Stormwater Man- agement Priority Index (SMPI) land. Within each category, spatial factors are rated based on their influence on water resources and critical areas can be identified for soil conservation, water quality protection and im- provement. The WebWMPI has user-friendly client side graphical interfaces which enable the public to in- teractively run the server side Geographic Information System to evaluate different scenarios for watershed planning and management. The system was applied for Dry Run Creek watershed (Cedar Falls, Iowa, US) as a demonstration and it can be easily used in other watersheds to prioritize crucial areas and to increase public participation for soil and water conservation projects. Keywords: Web-Based SDSS, Watershed Management, GIS 1. Introduction It is well understood that clean water is one of the essen- tial elements of sustainable development. The watershed is the natural water resources un it widely recognized as a fundamental geographic unit for measuring and analyz- ing the relative health or co ndition of th e landscap e [1 ,2]. However watershed degradation is a common phenome- non around the world that directly results in poor water quality. For example, the state of Iowa assessed streams whose designated uses are water supply, recreation, wildlife, and aquatic life harv esting in the years 2000 and 2001. It was reported that 34% of them were threatened and 38% were impaired, which means any one of its as- sessed uses was not met. For assessed ponds, 64% were threatened and 33% were impaired [3]. At a national level, in the Water Quality Inventory, USEPA [2] re- ported that about 40% of assessed river and stream lengths, 46% of assessed lake areas, 51% of assessed estuarine areas, and 78% of assessed Great Lakes shore- line lengths did not meet water quality standards. Watersheds are also important from an ecological per- spective. As water flows over the ground and along riv- ers, it can pick up nutrients, sediment, and other pollut- ants, which are transported to the outlet of the basin. These pollutants can negatively impact ecological proc- esses within the watershed, as well as the receiving water body. Hence, scientific watershed management is critical to protecting water resources and ecosystems. Watersheds are characterized by meteorological, sur- face water and groundwater, as well as physical and bio- logical factors functioning within the context of natural and human disturbance regimes. The flow, quality, or timing of water within a watershed is influenced by these 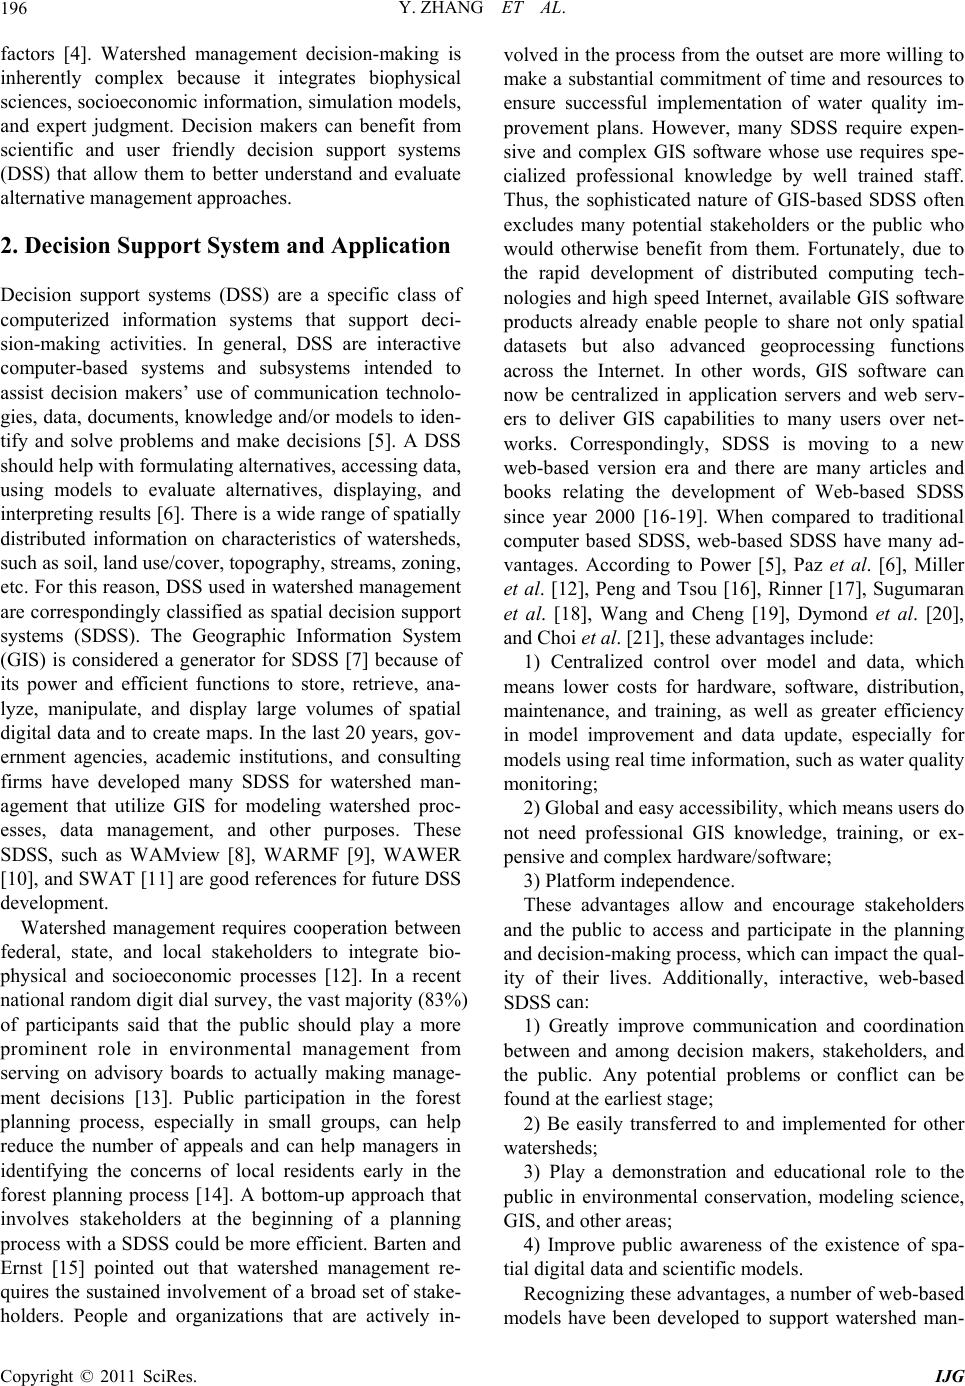 Y. ZHANG ET AL. 196 factors [4]. Watershed management decision-making is inherently complex because it integrates biophysical sciences, socioeconomic information, simulation models, and expert judgment. Decision makers can benefit from scientific and user friendly decision support systems (DSS) that allow them to better understand and evaluate alternative management approaches. 2. Decision Support System and Application Decision support systems (DSS) are a specific class of computerized information systems that support deci- sion-making activities. In general, DSS are interactive computer-based systems and subsystems intended to assist decision makers’ use of communication technolo- gies, data, documents, knowledge and/or models to iden- tify and solve problems and make decisions [5]. A DSS should help with formulating alternatives, accessing data, using models to evaluate alternatives, displaying, and interpreting results [6]. Th ere is a wide range of spatially distributed information on characteristics of watersheds, such as soil, land use/cover, topogr aphy, strea ms, zoning, etc. For this reason, DSS used in watershed management are correspondingly classified as spatial decision support systems (SDSS). The Geographic Information System (GIS) is considered a generator for SDSS [7] because of its power and efficient functions to store, retrieve, ana- lyze, manipulate, and display large volumes of spatial digital data and to create maps. In the last 20 years, gov- ernment agencies, academic institutions, and consulting firms have developed many SDSS for watershed man- agement that utilize GIS for modeling watershed proc- esses, data management, and other purposes. These SDSS, such as WAMview [8], WARMF [9], WAWER [10], and SWAT [11] are good references for future DSS development. Watershed management requires cooperation between federal, state, and local stakeholders to integrate bio- physical and socioeconomic processes [12]. In a recent national random digit dial survey, the vast majority (83%) of participants said that the public should play a more prominent role in environmental management from serving on advisory boards to actually making manage- ment decisions [13]. Public participation in the forest planning process, especially in small groups, can help reduce the number of appeals and can help managers in identifying the concerns of local residents early in the forest planning process [14]. A bottom-up approach that involves stakeholders at the beginning of a planning process with a SDSS could be more efficient. Barten and Ernst [15] pointed out that watershed management re- quires the sustained involvement of a broad set of stake- holders. People and organizations that are actively in- volved in the process from the ou tset are more willing to make a substantial commitment of time and resources to ensure successful implementation of water quality im- provement plans. However, many SDSS require expen- sive and complex GIS software whose use requires spe- cialized professional knowledge by well trained staff. Thus, the sophisticated nature of GIS-based SDSS often excludes many potential stakeholders or the public who would otherwise benefit from them. Fortunately, due to the rapid development of distributed computing tech- nologies and high speed Internet, available GIS software products already enable people to share not only spatial datasets but also advanced geoprocessing functions across the Internet. In other words, GIS software can now be centralized in application servers and web serv- ers to deliver GIS capabilities to many users over net- works. Correspondingly, SDSS is moving to a new web-based version era and there are many articles and books relating the development of Web-based SDSS since year 2000 [16-19]. When compared to traditional computer based SDSS, web-based SDSS have many ad- vantages. According to Power [5], Paz et al. [6], Miller et al. [12], Peng and Tsou [16], Rinner [17], Sugumaran et al. [18], Wang and Cheng [19], Dymond et al. [20], and Choi et al. [21], these advantages include: 1) Centralized control over model and data, which means lower costs for hardware, software, distribution, maintenance, and training, as well as greater efficiency in model improvement and data update, especially for models using real time info rmation , such as water qua lity monitoring; 2) Global and easy accessibility, which means users do not need professional GIS knowledge, training, or ex- pensive and complex hardware/software; 3) Platform independence. These advantages allow and encourage stakeholders and the public to access and participate in the planning and decision-making process, which can impact the qual- ity of their lives. Additionally, interactive, web-based SDSS can: 1) Greatly improve communication and coordination between and among decision makers, stakeholders, and the public. Any potential problems or conflict can be found at the earliest stage; 2) Be easily transferred to and implemented for other watersheds; 3) Play a demonstration and educational role to the public in environmental conservation, modeling science, GIS, and other areas; 4) Improve public awareness of the existence of spa- tial digital data and scien tific models. Recognizing these advantages, a number of web-based models have been developed to support watershed man- Copyright © 2011 SciRes. IJG 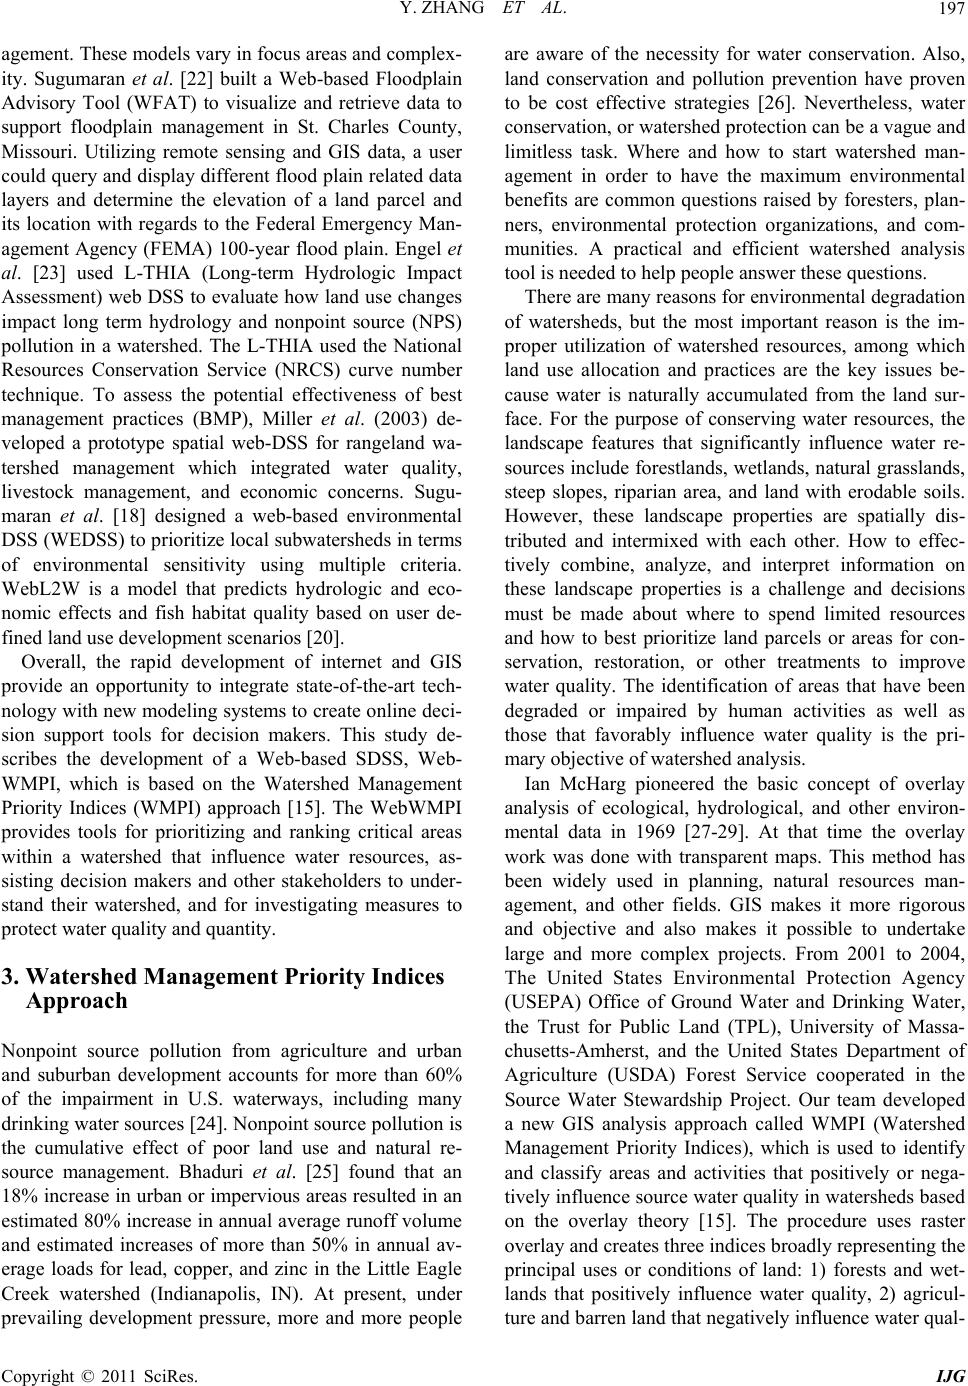 Y. ZHANG ET AL.197 agement. These models vary in focus areas and complex- ity. Sugumaran et al. [22] built a Web-based Floodplain Advisory Tool (WFAT) to visualize and retrieve data to support floodplain management in St. Charles County, Missouri. Utilizing remote sensing and GIS data, a user could query and display different flood plain related data layers and determine the elevation of a land parcel and its location with regards to the Federal Emergency Man- agement Agency (FEMA) 100-year flood plain. Engel et al. [23] used L-THIA (Long-term Hydrologic Impact Assessment) web DSS to evaluate how land use changes impact long term hydrology and nonpoint source (NPS) pollution in a watershed. The L-THIA used the National Resources Conservation Service (NRCS) curve number technique. To assess the potential effectiveness of best management practices (BMP), Miller et al. (2003) de- veloped a prototype spatial web-DSS for rangeland wa- tershed management which integrated water quality, livestock management, and economic concerns. Sugu- maran et al. [18] designed a web-based environmental DSS (WEDSS) to prioritize local subwatersheds in terms of environmental sensitivity using multiple criteria. WebL2W is a model that predicts hydrologic and eco- nomic effects and fish habitat quality based on user de- fined land use development s cenarios [20]. Overall, the rapid development of internet and GIS provide an opportunity to integrate state-of-the-art tech- nology with new modeling systems to create online deci- sion support tools for decision makers. This study de- scribes the development of a Web-based SDSS, Web- WMPI, which is based on the Watershed Management Priority Indices (WMPI) approach [15]. The WebWMPI provides tools for prioritizing and ranking critical areas within a watershed that influence water resources, as- sisting decision makers and other stakeholders to under- stand their watershed, and for investigating measures to protect water quality and quantity. 3. Watershed Management Priority Indices Approach Nonpoint source pollution from agriculture and urban and suburban development accounts for more than 60% of the impairment in U.S. waterways, including many drinking water sources [24]. Nonpoint source pollution is the cumulative effect of poor land use and natural re- source management. Bhaduri et al. [25] found that an 18% increase in urban or impervious areas resulted in an estimated 80% increase in annual av erage runoff volume and estimated increases of more than 50% in annual av- erage loads for lead, copper, and zinc in the Little Eagle Creek watershed (Indianapolis, IN). At present, under prevailing development pressure, more and more people are aware of the necessity for water conservation. Also, land conservation and pollution prevention have proven to be cost effective strategies [26]. Nevertheless, water conservation, or watershed protection can be a vague and limitless task. Where and how to start watershed man- agement in order to have the maximum environmental benefits are common questions raised by foresters, plan- ners, environmental protection organizations, and com- munities. A practical and efficient watershed analysis tool is needed to help people answer these questions. There are many reasons for environmental degradation of watersheds, but the most important reason is the im- proper utilization of watershed resources, among which land use allocation and practices are the key issues be- cause water is naturally accumulated from the land sur- face. For the purpose of conserving water resources, the landscape features that significantly influence water re- sources include forestland s, wetlands, natural grasslands, steep slopes, riparian area, and land with erodable soils. However, these landscape properties are spatially dis- tributed and intermixed with each other. How to effec- tively combine, analyze, and interpret information on these landscape properties is a challenge and decisions must be made about where to spend limited resources and how to best prioritize land parcels or areas for con- servation, restoration, or other treatments to improve water quality. The identification of areas that have been degraded or impaired by human activities as well as those that favorably influence water quality is the pri- mary objective of watershed an alysis. Ian McHarg pioneered the basic concept of overlay analysis of ecological, hydrological, and other environ- mental data in 1969 [27-29]. At that time the overlay work was done with transparent maps. This method has been widely used in planning, natural resources man- agement, and other fields. GIS makes it more rigorous and objective and also makes it possible to undertake large and more complex projects. From 2001 to 2004, The United States Environmental Protection Agency (USEPA) Office of Ground Water and Drinking Water, the Trust for Public Land (TPL), University of Massa- chusetts-Amherst, and the United States Department of Agriculture (USDA) Forest Service cooperated in the Source Water Stewardship Project. Our team developed a new GIS analysis approach called WMPI (Watershed Management Priority Indices), which is used to identify and classify areas and activities that positively or nega- tively influence source water quality in watersh eds based on the overlay theory [15]. The procedure uses raster overlay and creates three indices broadly representing the principal uses or conditions of land: 1) forests and wet- lands that positively influence water quality, 2) agricul- ture and barren land that negatively in fluence water qual- Copyright © 2011 SciRes. IJG 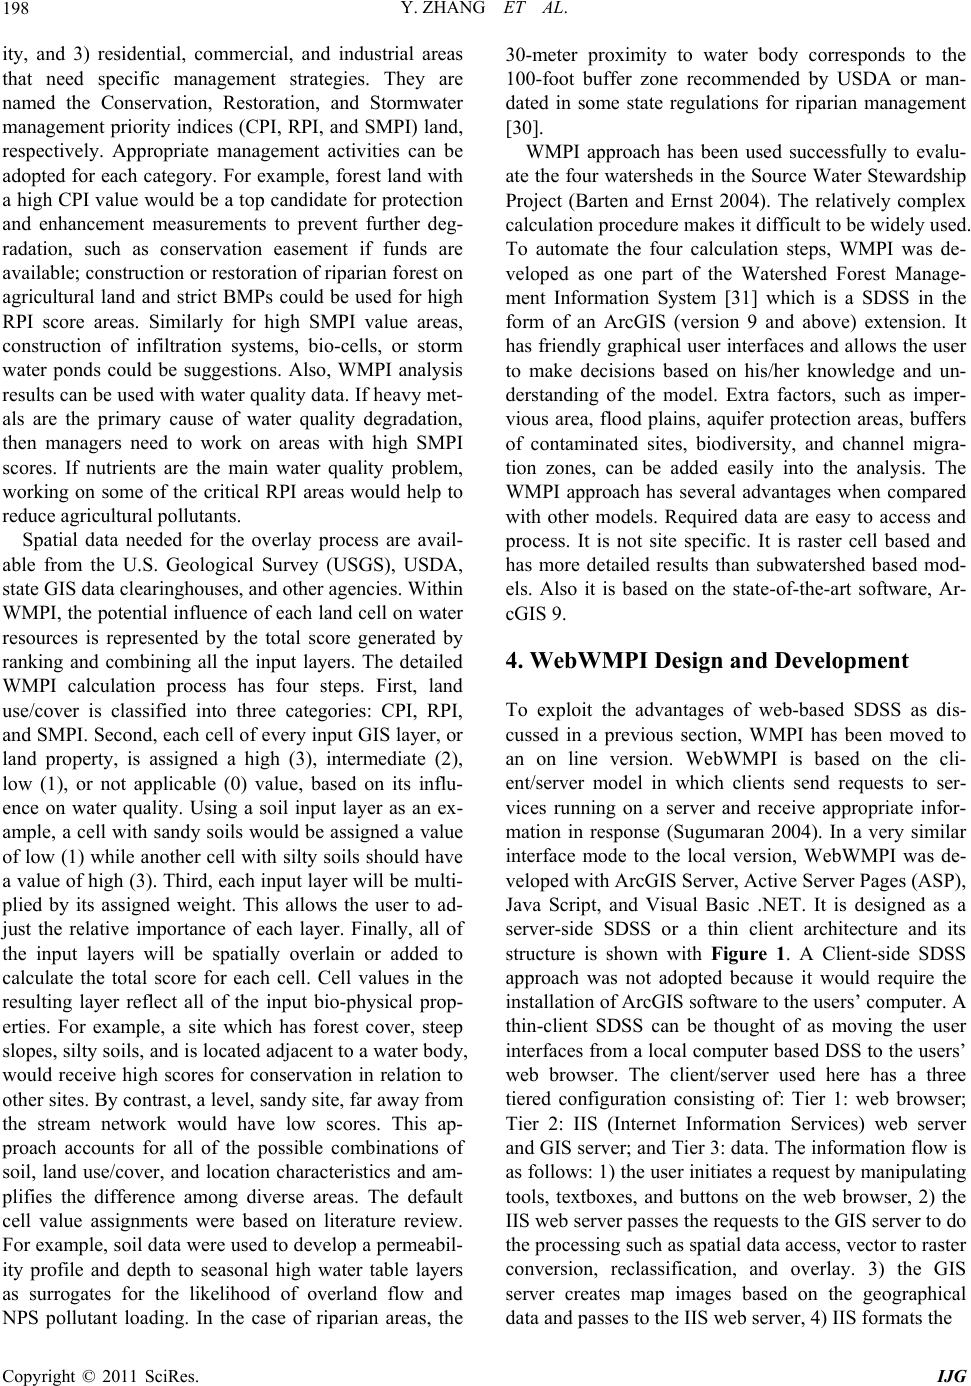 Y. ZHANG ET AL. 198 ity, and 3) residential, commercial, and industrial areas that need specific management strategies. They are named the Conservation, Restoration, and Stormwater management priority indices (CPI, RPI, and SMPI) land, respectively. Appropriate management activities can be adopted for each category. For example, forest land with a high CPI value would be a top candidate for protection and enhancement measurements to prevent further deg- radation, such as conservation easement if funds are available; construction or restoration of riparian forest on agricultural land and strict BMPs could be used for high RPI score areas. Similarly for high SMPI value areas, construction of infiltration systems, bio-cells, or storm water ponds could be suggestions. Also, WMPI analysis results can be used with water quality da ta. If heavy met- als are the primary cause of water quality degradation, then managers need to work on areas with high SMPI scores. If nutrients are the main water quality problem, working on some of the critical RPI areas would help to reduce agricultural pollutants. Spatial data needed for the overlay process are avail- able from the U.S. Geological Survey (USGS), USDA, state GIS data clearinghouses, and other agencies. Within WMPI, the potential influence of each land cell on water resources is represented by the total score generated by ranking and combining all the input layers. The detailed WMPI calculation process has four steps. First, land use/cover is classified into three categories: CPI, RPI, and SMPI. Second, each cell of ev ery input GIS layer, or land property, is assigned a high (3), intermediate (2), low (1), or not applicable (0) value, based on its influ- ence on water quality. Using a soil input layer as an ex- ample, a cell with sandy soils would be assigned a value of low (1) while another cell with silty soils should have a value of high (3). Third, each input layer will be multi- plied by its assigned weight. This allows the user to ad- just the relative importance of each layer. Finally, all of the input layers will be spatially overlain or added to calculate the total score for each cell. Cell values in the resulting layer reflect all of the input bio-physical prop- erties. For example, a site which has forest cover, steep slopes, silty soils, and is located adj acent to a water body, would receive high scores for conservation in relation to other sites. By contrast, a level, sandy site, far away from the stream network would have low scores. This ap- proach accounts for all of the possible combinations of soil, land use/cover, and location characteristics and am- plifies the difference among diverse areas. The default cell value assignments were based on literature review. For example, soil data were used to develop a permeabil- ity profile and depth to seasonal high water table layers as surrogates for the likelihood of overland flow and NPS pollutant loading. In the case of riparian areas, the 30-meter proximity to water body corresponds to the 100-foot buffer zone recommended by USDA or man- dated in some state regulations for riparian management [30]. WMPI approach has been used successfully to evalu- ate the four watersheds in the Source Water Stewardship Project (Barten and Ernst 2004). The relatively complex calculation procedure makes it difficult to be widely used. To automate the four calculation steps, WMPI was de- veloped as one part of the Watershed Forest Manage- ment Information System [31] which is a SDSS in the form of an ArcGIS (version 9 and above) extension. It has friendly graphical user interfaces and allows the user to make decisions based on his/her knowledge and un- derstanding of the model. Extra factors, such as imper- vious area, flood plains, aquifer protection areas, buffers of contaminated sites, biodiversity, and channel migra- tion zones, can be added easily into the analysis. The WMPI approach has several advantages when compared with other models. Required data are easy to access and process. It is not site specific. It is raster cell based and has more detailed results than subwatershed based mod- els. Also it is based on the state-of-the-art software, Ar- cGIS 9. 4. WebWMPI Design and Development To exploit the advantages of web-based SDSS as dis- cussed in a previous section, WMPI has been moved to an on line version. WebWMPI is based on the cli- ent/server model in which clients send requests to ser- vices running on a server and receive appropriate infor- mation in response (Sugumaran 2004). In a very similar interface mode to the local version, WebWMPI was de- veloped with Arc GI S Se rver, Active Server Pages (ASP), Java Script, and Visual Basic .NET. It is designed as a server-side SDSS or a thin client architecture and its structure is shown with Figure 1. A Client-side SDSS approach was not adopted because it would require the installation of ArcGIS software to the users’ computer. A thin-client SDSS can be thought of as moving the user interfaces from a local computer based DSS to the users’ web browser. The client/server used here has a three tiered configuration consisting of: Tier 1: web browser; Tier 2: IIS (Internet Information Services) web server and GIS server; and Tier 3: data. The information flow is as follows: 1) the user initiates a request by manipulating tools, textboxes, and buttons on the web browser, 2) the IIS web server passes the requests to the GIS server to do the processing such as spatial data access, vector to raster conversion, reclassification, and overlay. 3) the GIS server creates map images based on the geographical data and passes to the IIS web server, 4) IIS formats the Copyright © 2011 SciRes. IJG 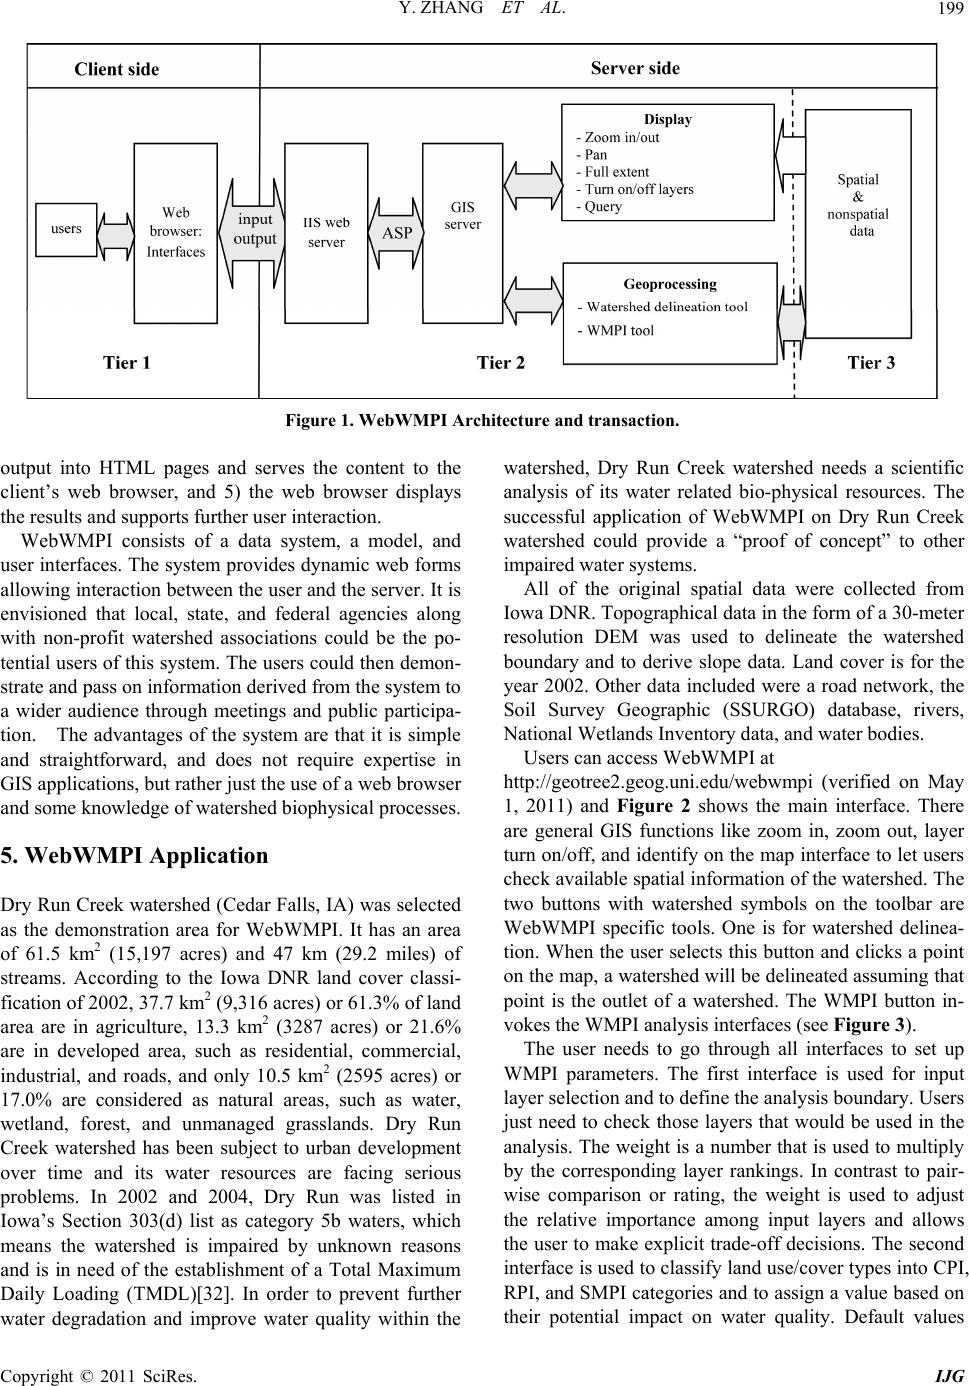 Y. ZHANG ET AL. Copyright © 2011 SciRes. IJG 199 Figure 1. WebWMPI Architecture and transaction. output into HTML pages and serves the content to the client’s web browser, and 5) the web browser displays the results and supports further user interaction. WebWMPI consists of a data system, a model, and user interfaces. The system provides dynamic web forms allowing interaction b etween th e user and the server. It is envisioned that local, state, and federal agencies along with non-profit watershed associations could be the po- tential users of this system. The users could then demon- strate and pass on information derived from the system to a wider audience through meetings and public participa- tion. The advantages of the system are that it is simple and straightforward, and does not require expertise in GIS applications, but rather just the use of a web bro wser and some knowledge of watershed biophysical processes. 5. WebWMPI Application Dry Run Creek watershed (Cedar Falls, IA) was selected as the demonstration area for WebWMPI. It has an area of 61.5 km2 (15,197 acres) and 47 km (29.2 miles) of streams. According to the Iowa DNR land cover classi- fication of 2002, 37 .7 km2 (9,3 16 acr es) or 61 .3 % of lan d area are in agriculture, 13.3 km2 (3287 acres) or 21.6% are in developed area, such as residential, commercial, industrial, and roads, and only 10.5 km2 (2595 acres) or 17.0% are considered as natural areas, such as water, wetland, forest, and unmanaged grasslands. Dry Run Creek watershed has been subject to urban development over time and its water resources are facing serious problems. In 2002 and 2004, Dry Run was listed in Iowa’s Section 303(d) list as category 5b waters, which means the watershed is impaired by unknown reasons and is in need of the establishment of a Total Maximum Daily Loading (TMDL)[32]. In order to prevent further water degradation and improve water quality within the watershed, Dry Run Creek watershed needs a scientific analysis of its water related bio-physical resources. The successful application of WebWMPI on Dry Run Creek watershed could provide a “proof of concept” to other impaired water systems. All of the original spatial data were collected from Iowa DNR. Topographical data in the form of a 30-meter resolution DEM was used to delineate the watershed boundary and to derive slope data. Land cover is for the year 2002. Other data included were a road network, the Soil Survey Geographic (SSURGO) database, rivers, National Wetlands Inventory data, and water bodies. Users can access WebWMPI at http://geotree2.geog.uni.edu/webwmpi (verified on May 1, 2011) and Figure 2 shows the main interface. There are general GIS functions like zoom in, zoom out, layer turn on/off, and identify on the map interface to let users check available spatial informatio n of the watershed. The two buttons with watershed symbols on the toolbar are WebWMPI specific tools. One is for watershed delinea- tion. When the user selects this button and clicks a point on the map, a watershed will be delineated assuming that point is the outlet of a watershed. The WMPI button in- vokes the WMPI analysis interfaces (see Figure 3). The user needs to go through all interfaces to set up WMPI parameters. The first interface is used for input layer selection and to define the analysis boundary. Users just need to check those layers that would be used in the analysis. The weight is a number that is used to multiply by the corresponding layer rankings. In contrast to pair- wise comparison or rating, the weight is used to adjust the relative importance among input layers and allows the user to make exp licit trade-off decisions. The second interface is used to classify land use/cover types into CPI, RPI, and SMPI categories and to assign a value based on their potential impact on water quality. Default values  Y. ZHANG ET AL. Copyright © 2011 SciRes. IJG 200 Figure 2. WebWMPI home page. Figure 3. WebWMPI user interfaces.  Y. ZHANG ET AL. Copyright © 2011 SciRes. IJG 201 are assigned as a reference but can be changed. For ex- ample, forest land can be set to CPI with a score of three because in general it positively influences water quality. The server uses the information entered in the second interface to classify land use/cover data into three rasters based on this setting. Users can exclude some land cate- gories by not assigning them to one of the three indices. The third interface is for parameter setting, such as buffer width and slope classification intervals. In the last interface the output format is selected. The entire range of CPI, RPI, and SMPI can be displayed, or the 70th, 80th, and 90th percentile of corresponding PI categories can be calculated automatically. An optional output is a chess- board which can be used to divide the watershed into small areas for management purpose. Last, users just need to click the analysis button and wait until the web browser displays the results of the analysis. Figure 4 shows an example analysis result for Dry Run Creek watershed based on our default parameter settings. Within the map, the symbology for CPI, RPI, and SMPI are green, orange, and red, respectively. The darker the color, the higher the score is. Management priorities could be given to those areas with the highest scores after field assessment. Until now, the coordinator of Dry Run Creek watershed has used the WebWMPI to identify hot spots to bu ild stormwater retention pond and to restore stream bank. The tool has been used to demon- strate those hot spots in local watershed management meetings involving the public. BMP suggestions were provided to land owners having lands with critical areas. With cadastral data, a zonal analysis could be used to identify critical parcels. Figure 4. WebWMPI analysis result for Dry Run Creek Watershed (Cedar Falls, IA, USA). The example application of WebWMPI used a small local watershed. However, WebWMPI has a flexible analysis scale as the analysis boundary is selected by the user and there is a watershed delineation function. With the proper data and hardware preparation, it could be expanded to county, state, or regional level depending on the analysis boundary selection. In other words, WebWMPI can be considered as a hierarchical SDSS. For example, if the server is populated with state wide data, users could identify critical areas at the state level or at the city level based on the analysi s bo un dary setting. There are potential disadvantages to the application of Web-based SDSS. These systems provide greater poten- tial for wide use among not only academic and regula- tory organizations but other stakeholders such as public interest groups. This introduces the possibility of misun- derstanding or mis-application of the modeling system. Questions like how to prevent the model from being misused or misinterpreted and others like security prob- lems should be kept in mind for all web-based SDSS designers. The WebWMPI system has been used so far for academic demonstration purposes and for use with local Dry Run Creek watershed stakeholders. When the model is released for wider use stricter access controls would be put in place. These would include the require- ment of a login id that would be provided by the WebWMPI application manager upon registration by the user. The use of the system would be monitored by the WebWMPI managers. In addition, extensive help sys- tems and tutorials are p rovided to guide the user through application of WebWMPI. Finally, in the future, when the outputs are prov ided as downloadab le datasets, all of the input parameters will also be provided with any analysis results. 6. Conclusions Using the dynamic information delivery capabilities of web technology, the WebWMPI, a web-based watershed management SDSS, has been designed to support water- shed decision-makers and to provide information about the critical areas within a watershed that influence water resources. With friendly user interfaces, it can achieve the purpose of making watershed conservation knowl- edge accessible to stakeholders and the public who may have limited GIS or watershed science knowledge and providing them a tool to evaluate different management scenarios. At present, WebWMPI does not incorporate social or economic factors, such as land ownership. However, this does not preclude the application of WebWMPI in pre- dominately private owned watersheds. For example, WebWMPI analysis result could provide recommenda-  Y. ZHANG ET AL. 202 tions for conservation easement purchasing of parcels or for zoning regulations. Nonetheless, adding social and economic factors to WebWMPI would be one potential future development direction. Other possible develop- ment of the WebWMPI model may include, but is not limited to, archiving analyses for users to let them re- trieve previous results, data download, adding hydro- logical analysis, cost-benefit analysis, improving visu- alization through three dimensional techniques, soil ero- sion calculation, linking to real-time water quality moni- toring system (pollution indication), and providing BMP suggestions for the management of critical area. The work done so far for the WebWMPI has illus- trated the great advantages of a web-based SDSS in soil and water conservation project. Compared with the ap- plication of desktop WMPI in the four watersheds of the Source Water Stewardship Project (Barten and Ernst 2004), WebWMPI attracted and allowed more stake- holders to investigate watershed conditions. Also Dry Run Creek watershed coordinators have used it as a re- mote assessment tool without concern for GIS software and locally stored datasets. At the same time, its devel- opment highlights potential future directions of web SDSS, online geoprocessing, or web-based GIS service. These directions could include: 1) Adoption of new technologies, such as Ajax which allows partially refreshing web pages and makes web applications smaller, faster and more user friendly. Timely response is the key factor to attract and maintain web users. However, geoprocessing with large datasets normally takes time. Presently, it takes 1.5 minutes to finish the analysis with the most complex parameter set- tings for WebWMPI with Dry Run Creek watershed data; 2) Allowing users to upload data for an analysis. At present, most GIS services, including WebWMPI, can only provide functions with server-side data. In the fu- ture, accepting users’ data for analysis will be one poten- tial direction if multi- spatial data validation can be done quickly with artificial intelligence; and Another direction is the potential to combine other online tools developed by separate organizations. One successful example is Shi et al.’s model [33], which in- tegrates Michigan State University’s Digital Watershed and Understanding Your Watershed Systems and Purdue University’s Online Watershed Delineation Tool and L-THIA across the web. This kind of integration can avoid duplicated efforts and will promote the develop- ment and application of SDSS at all levels. 6. References [1] J. E. Williams, C. A. Wood and M. P. Dombeck, “Wa- tershed Restoration: Principles and Practices,” American Fisheries Society, Philadelphia, 1997. [2] USEPA, “2000 National Water Quality Inventory Re- port,” 2011. http://www.epa.gov/305b/2000report. [3] USEPA, “2002 National Assessment Database,” 2011. http://www.epa.gov/waters/305b/index.html. [4] B. McCammon, J. Rector and K. Gebhardt, “A Frame- work for Analyzing the Hydrologic Condition of Water- sheds,” USDA Forest Service and USDI Bureau of Land Management, BLM Technical Note 405, Washington, 1998. [5] J. D. Power, “Building Web-Based Decision Support Systems,” Studies in Informatics and Control, Vol. 11, No. 4, 2002, pp. 291-302. [6] J. O. Paz, W. D. Batchelor and P. Pedersen, “WebGro: A Web-Based Soybean Management Decision Support Sys- tem,” Agronomy Journal, Vol. 96, 2004, pp. 1771-1779. doi:10.2134/agronj2004.1771 [7] P. Keenan, “Using a GIS as a DSS Generator,” DSSRe- sources.com, 2004. http://dssresources.com/papers/features/keenan/keenan12 172004.html. [8] D. Bottcher and J. G. Hiscock, “WAMview-a GIS/Land Source Based Approach to Watershed Assessment Model,” Proceedings of 2001 Water Environment Fed- eration (WEF) TMDL Science Issues Conference, St. Louis, 5-7 March 2001, pp. 112-123. [9] L. H. Weintraub, C. W. Chen and J. Herr, “Demonstra- tion of WARMF: A Decision Support Toll for TMDL Development,” Proceedings Water Environment Federa- tion (WEF) TMDL Science Issues Conference, St. Louis, 4-7 March 2001. [10] E. Girvetz and F. Shilling, “Decision Support for Road System Analysis and Modification on the Tahoe National Forest,” Environmental Management, Vol. 32, No. 2, 2003, pp. 218-233. doi:10.1007/s00267-003-2970-1 [11] K. S. Bracmort, M. Arabi, J. R. Frankenberger, B. A. Engel and J. G. Arnold, “Modeling Long-Term Water Quality Impact of Structural BMPs,” Transactions of the American Society of Agricultural and Biological Engi- neers, Vol. 49, No. 2, 2006, pp. 367-374. [12] R. Miller, D. P. Guertin and P. Heilman, “An Inter- net-Based Spatial Decision Support System for Range- land Watershed Management,” Proceedings of the 1st In- teragency Conference on Research in the Watersheds, Benson, 27-30 October 2003, pp. 725-730. [13] B. S. Steel and E. Weber, “Ecosystem Management, De- centralization, and Public Opinion,” Global Environ- mental Change, Vol. 11, No. 2, 2001, pp. 119-131. doi:10.1016/S0959-3780(00)00062-5 [14] R. L. Ryan, “Social Science to Improve Fuels Manage- ment: A Synthesis of Research on Aesthetics and Fuels Management,” USDA Forest Service, North Central Re- search Station, General Technical Report. NC-261, USDA, 2005. [15] P. K. Barten and C. E. Ernst, “Land Conservation and Watershed Management for Source Protection,” Journal Copyright © 2011 SciRes. IJG  Y. ZHANG ET AL. Copyright © 2011 SciRes. IJG 203 of the American Water Works Assoc iation, Vol. 96, No. 4, 2004, pp. 121-136. [16] Z. R. Peng and M. H. Tsou, “Internet GIS: Distributed Geographic Information Services for the Internet and Wireless Networks,” John Wiley & Sons, Hoboken, 2003. [17] C. Rinner, “Web-Based Spatial Decision Support: Status and Research Directions,” Journal of Geographic Infor- mation and Decision Analysis, Vol. 7, No. 1, 2003, pp. 14-31. [18] R. Sugumaran, J. Meyer, and J. Davis, “A Web-Based Environmental Decision Support System (WEDSS) for Environmental Planning and Watershed Management,” Journal of Geographical Systems, Vol. 6, 2004, pp. 1-16. doi:10.1007/s10109-004-0137-0 [19] L. Wang and Q. Cheng, “Web-Based Collaborative Deci- sion Support Services: Concept, Challenges and Applica- tion,” Proceedings of the ISPRS Vienna 2006 Symposium, Vienna, 12-14 July 2006. [20] R. L. Dymond, B. Regmi, V.K. Lohani and R. Dietz, “Interdisciplinary Web-Enabled Spatial Decision Support System for Watershed Management,” Journal of Water Resources Planning and Management, Vol. 130, No. 4, 2004, pp. 290-300. doi:10.1061/(ASCE)0733-9496(2004)130:4(290) [21] J. B. Choi, A. Engel and R.L. Farnsworth, “Web-Based GIS and Spatial Decision Support System for Watershed Management,” Journal of Hydroinformatics, Vol. 7, No. 3, 2005, pp. 165-174. [22] R. Sugumaran, C. Davis, J. Meyer, T. Prato and C. Ful- cher, “Web-Based Decision Support Tool for Floodplain Management Using High-Resolution DEM,” Journal of Photogrammetric Engineering and Remote Sensing, Vol. 66, No. 10, 2000, pp. 1261-1265. [23] B. A. Engel, J. Choi, J. Harbor and S. Pandey, “Web- Based DSS for Hydrologic Impact Evaluation of Small Watershed Land Use Changes,” Computers and Elec- tronics in Agriculture, Vol. 39, No. 3, 2003, pp. 241-249. doi:10.1016/S0168-1699(03)00078-4 [24] USEPA, “Nonpoint Source Pollution: The Nations’ Largest Water Quality Problem, EPA841-F-96-004A,” USEPA, 1996. [25] B. Bhaduri, J. Harbor, B. Engel, and M. Grove, “Assess- ing Watershed-Scale, Long-Term Hydrologic Impacts of Land-Use Change Using a GIS-NPS Model,” Environ- mental Management, Vol. 26, No. 6, 2000, pp. 643-658. doi:10.1007/s002670010122 [26] NRC (National Research Council), “Watershed Man- agement for Potable Water Supply: Assessing New York City’s Approach,” National Academies Press, Washing- ton, 2000. [27] L. I. Mcharg, “Design with Nature,” John Wiley & Sons, Hoboken, 1969. [28] I. Heywood, S. Cornelius and S. Carver, “An Introduction to geographical Information Systems,” Prentice Hall, Upper Saddle River, 1998. [29] P. A. Longley, M. F. Goodchild, D. J. Maguire and D. W. Rhind, “Geographic Information Systems and Science,” Wiley, 2001. [30] NRC (National Research Council), “Riparian Areas: Functions and Strategies for Management,” National Academies Press, Washington, 2002. [31] Y. Zhang and P. K. Barten, “Watershed Forest Manage- ment Information System (WFMIS),” Environmental Modeling and Software, Vol. 24, No. 4, 2009, pp. 569-575. doi:10.1016/j.envsoft.2008.10.006 [32] Iowa DNR (The Iowa Department of Natural Resources). “Iowa Section (303d) Impaired Waters Listings,” 2011. http://wqm.igsb.uiowa.edu/wqa/303d.html [33] Y. Shi, J. Asher, J. Bartholic, J. Choi, B. Engel and R. Farnsworth, “An online webGIS-Based Hierarchical Wa- tershed Decision Support System for United States,” En- vironmental Informatics Archives, Vol. 2, 2004, pp. 838-845.
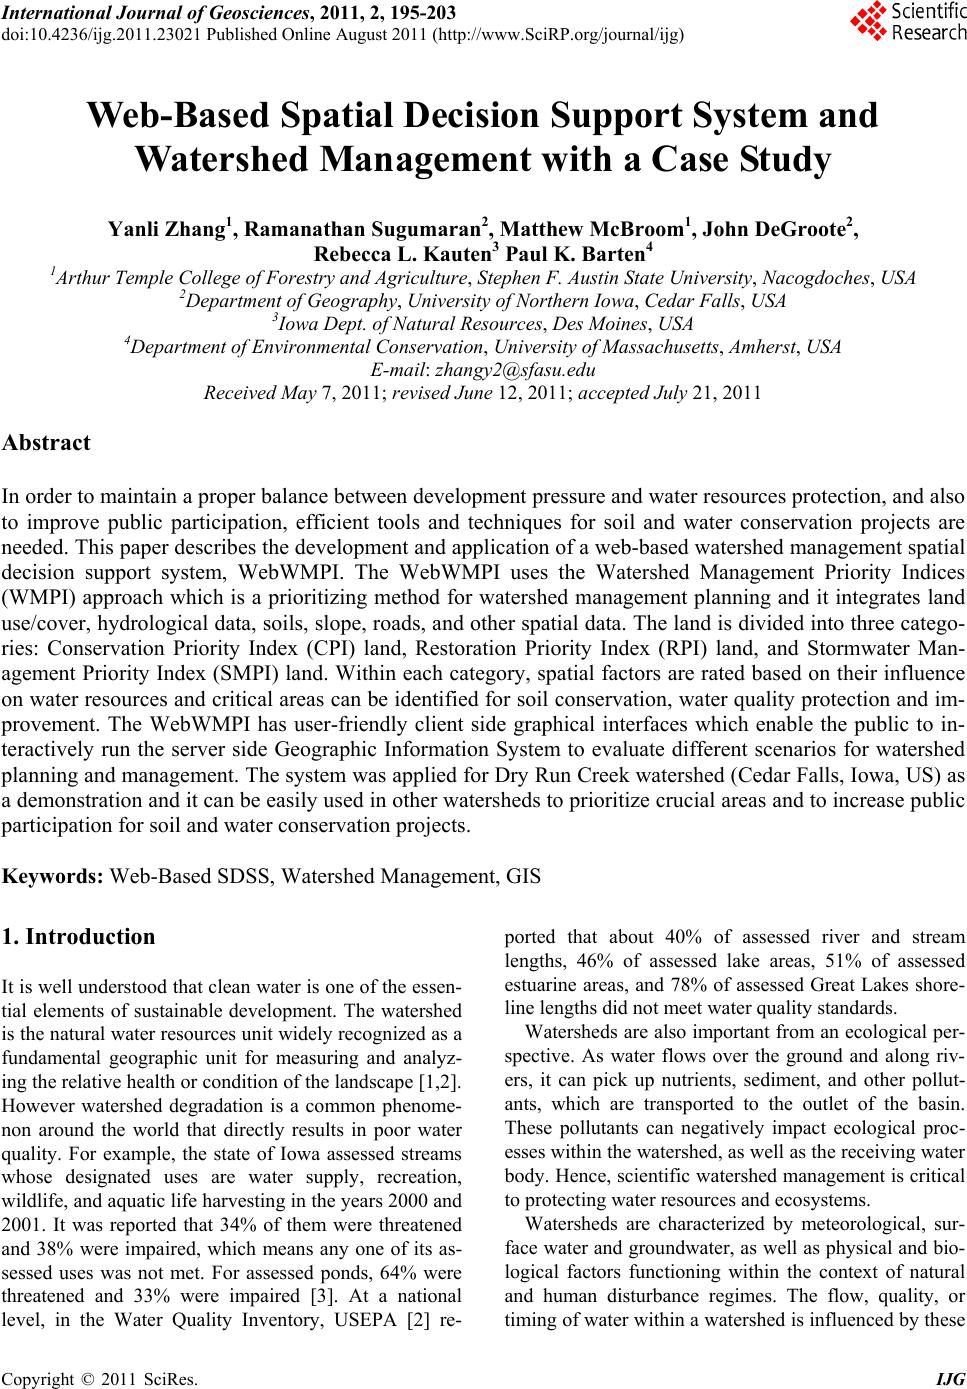
|