 International Journal of Geosciences, 2011, 2, 185-194 doi:10.4236/ijg.2011.23020 Published Online August 2011 (http://www.SciRP.org/journal/ijg) Copyright © 2011 SciRes. IJG Structure and Temporal Variability of Mediterranean Water in Hydrological and Ma rine Seismic Data South of Portimao Canyon (Gulf of Cadiz), from 1999 to 2002* Elise Quentel1, Xavier Carton2, Marc Andre Gutscher1 1LDO, IUEM/UBO, Technopole Brest Iroise, Plouzane, France 2LPO, IUEM/UBO, 6 Avenue Le Gorgeu, Brest, France E-mail: xcarton@univ-brest.fr Received April 22, 2011; revised June 19, 2011; accepted July 23, 2011 Abstract Hydrological and marine seismic data, collected in the Gulf of Cadiz (respectively in July 1999, 2000, 2001 and 2002, and in April 2000 and 2001) are analysed to reveal the various structures of Mediterranean Water (MW). Both the hydrological and seismic data clearly identify the MW undercurrents on the Iberian slope, detached MW eddies (meddies and a cyclone) and smaller fragments of MW (filaments and small eddies). Seismic reflectivity and synthetic reflectivity computed from hydrology, indicate that strong acoustic reflec- tors, associated with 8 - 64 m thick homogeneous water layers, are found above and below meddies and filaments, around the MW undercurrents, but mostly in the lower part of cyclones and below submesoscale eddies. Reflectors are also observed in the near surface layers where thermohaline contrasts are quite pro- nounced. The successful use of seismic data to locate submesoscale MW structures, superior to that of hy- drology, is related to the improved horizontal resolution. Keywords: Mediterranean Water, Eddies, Undercurrent, Layering, Hydrological Data, Seismic Reflectivity, Submesoscale Structures 1. Introduction Mediterranean Water (hereafter MW), which flows out of the Straits of Gibraltar (near 6 W) at 150 - 300 m depths, cascades down the continental slope east of the Gulf of Cadiz, and mixes with surrounding waters [1]. These surrounding waters have temperatures decreasing with depth, so that the uppermost MW remains warmer than the lower part of the outflow. This inhomogeneous mixing, as well as the influence of transverse canyons on the continental slope, separate the MW outflow into three density-adjusted undercurrents of MW upstream of 8 W: the shallow one at 400 - 600 m depth, the upper one at 800 m and the lower one at 1200 m [2-5]. Heading westward along the Iberian continental slope, the upper and lower undercurrents encounter the Portimão Canyon which destabilizes them, producing meanders, filaments and eddies [4-6]. At this location, two undercurrents with respective temperature and salinity maxima of 13.5˚C and 36.4 and 12.5˚C and 36.6 have regularly been ob- served at 800 and 1200 m depths. In this region, a deep core (at depths of 1300 - 1600 m) has also been observed [7]. Farther downstream, the upper and lower MW un- dercurrents veer around Cape Saint Vincent, again pro- ducing eddies (with slightly weaker thermohaline char- acteristics; [8]). MW undercurrents then flow northward and can still be clearly identified northwest of the Iberian Peninsula. Mediterranean Water eddies are also produced near the Estremadura Promontory [9] and near Cape Or- tegal [10,11]. When meddies are formed near Portimão Canyon or Cape Saint Vincent, they can drift south- westward under the influence of the planetary vorticity gradient, or cyclonically in the Gulf of Cadiz when they pair with cyclones [12,13]. The present study concentrates on the hydrological and dynamical properties of Mediterranean water south of Portimão Canyon as measured during several cruises of the SEMANE program (Suivi des Eaux Méditer- ranéennes en Atlantique Nord-Est—Following the Medi- The GO project was funded by the 6th EU Framework for research and Development. This work was supported by SHOM under PEA 012401 and by UBO under LPO projects.  E. QUENTEL ET AL. 186 . Data Acquisition and Processing he SEMANE program was carried out mostly by the lti-channel seismic (MCS) profile was ac- qu . Data Analysis igure 1 presents the location of the SEMANE and bserves a layer marked by a po P da terranean Waters in the Northeastern Atlantic Ocean), and on the signature of this water mass in seismic reflec- tion data of the SISMAR (Etude SISmique de la marge MARocaine) and TGS-NOPEC surveys. This study aims at characterizing the MW south of Portimão canyon, ob- served during the SEMANE, SISMAR and TGS-NOPEC cruises, at identifying their origin and at presenting the hydrological characteristics associated with the strong reflectors observed in the seismic data [14,15]. 2 T French Navy Oceanographic and Hydrographic Service (SHOM) and by the French Institute for Sea Research (IFREMER) from 1995 until 2002. Their objectives were to map MW undercurrents and eddies south of Portugal, and to track these eddies with drifters. A CTD section was performed yearly from 1999 until 2002 (in July) along 8˚20'W, and lowered acoustic Doppler current profiling (L-ADCP) was performed on the 1999 and 2000 sections. The 2000 and 2001 sections were sup- plemented with casts of XBTs and XCTDs (expendable, temperature, or temperature and salinity, probes). The horizontal distance between stations along the section was about 5 nautical miles (NM) on the continental slopes and 10 NM in the deeper region. The vertical resolution was better than 1m. The accuracy of the CTD data was +/–0.002˚C for temperature and +/–0.005 in salinity. The vertical resolution of CTD data before proc- essing was 4 cm (velocity of the probes equal to 1 m/s, and frequency of the sampling equal to 24 Hz), and 0.7 m after processing. For the L-ADCP, the signal was av- eraged over 8 m bins and the accuracy on velocity was about 2.5 cm/s for a 2500 m depth profile. The accuracy of XBT and XCTD probes was +/–0.01˚C and +/–0.03 in salinity. The mu ired during the SISMAR cruise, by R/V Nadir in April 2001. The aim of this cruise was to image the deep structures of the Iberian and Morocco margins with a 360 channel, 4.5 km long streamer and a 4805 cubic inch tuned air gun array. Shot spacing ranged from 75 m (for purely MCS profiles) to 150 m (for joint OBS and MCS profiles). This provided 30- and 15-fold CDP coverage, respectively. Thus, CDP spacing was 6.25 m for the MCS only profiles and 12.5 m for the joint profiles. The sampling rate was 4 ms in all cases. The frequency of the sound sources was between 5 and 60 Hz. Both the sam- pling rate and the frequency provided a vertical resolu- tion of about 6 m [16]. One MCS profile of this cruise and two commercial profiles (TGS-NOPEC - April 2000) located across the Gulf of Cadiz and near 8˚20'W were processed. The TGS-NOPEC commercial cruise had a source receiver offset of 144 m, a group spacing of 12.5 m, receiver depth of 10 m, a source depth of 7 m and a 480 channel, 6 km long streamer. According to the typi- cal processing sequence [17], we applied a low pass filter on the seismic data. Since the direct wave disturbed the signal at the surface layer, its removal was important. We used an eigenvector filter coupled with a low cut filter for direct wave removal. For more accurate removal, we used a novel application of an eigenvector filter, which linearly moves out traces based on previous work on multiple suppression [18]. The processed hydrological sections along 8˚20'W, in salinity, temperature and ve- locity of July 1999 to 2002 are compared here to the seismic sections in the same area. 3 F SISMAR sections in the Gulf of Cadiz (south of Porti- mão Canyon). They are not coincident in space nor in time, but they show qualitatively similar features. These features are the following. First, one consistently o sitive anomaly of 0.5 in salinity whatever the year, and throughout the Gulf between 800 and 1400 m depths. In seismic data, one also observes intense acoustic reflec- tion between 800 and 1400 m depths, all across the Gulf. This continuous anomaly is the diffusive tongue of Mediterranean Water, due to the turbulent mixing of this water with ambient Atlantic Water. This turbulent mix- ing results from mesoscale and submesoscale features which have detached from the MW undercurrents. These features appear both on the 1999, 2001 and 2002 hydro- logical sections and on the MCS profile (SISMAR 23). In the SEMANE 1999 data, hydrological and LADC ta allowed the identification of a meddy between km 230 and 310, with a 36.4 salinity maximum near 1200 m depth. Its velocity signal is most intense between 700 and 1600 m depths. Above the meddy, the velocity sig- nature is more turbulent. Below it, lies a deep eastward current (near 2500 m depth). A cyclone is located be- tween km 145 and 215. It is shallower and has a 36.2 salinity maximum. It has a strong associated velocity from the surface down to 1600 m depth, and the corre- sponding current signature, though slightly shifted south, is still visible below. The temperature (not shown) and salinity of the meddy-cyclone pair indicate that their ori- gin lies between Portimão Canyon and Cape Saint Vin- cent. Between these two eddies (near km 215 - 225) lies a narrow salinity maximum, which is a filament. It was identified by Carton et al. [12] using complementary XBT and XCTD data in the Gulf. This filament origi- Copyright © 2011 SciRes. IJG  E. QUENTEL ET AL. Copyright © 2011 SciRes. IJG 187 Figure 1. Upper six panels: salinity cross-sections along 8˚20'W in the Gulf of Cadiz for years 1999, 2000, 2001, 2002 and ated from another meddy northwest of the two eddies of EMANE 2000 data, a salty patch is detached fr But the LADCP velocity section identifies an anti- 180 and 250 (a LACDP velocity for 1999 and 2000, are presented. Triangles above the salinity sections indicate the position of each CTD’s. Direction of oceanic currents are given by arrows made of a cross or a dot in a circle (cross/circle: current is W to E; dot/circle: current is E to W). These directions are estimated from LADCP velocities for 1999 and 2000 and from geostrophic velocities calculated for 2001 and 2002 (Geostrophic velocity sections are not presented because they depend on an arbitrary level of no motion). Lower right panel: Location of the SEMANE (1999-2002) oceanographic sections (in blue) and of the SISMAR seismic sec tion (in red). Lower le ft panel : Seismic reflectivity is shown along the SISMAR section acquired in April 2001. n our section. This meddy detached in the Cape Saint Vin- cent area. North of the cyclone (between km 100 and 140) lies another submesoscale feature. Its salinity maximum is comparable to that of the cyclone and of the filament, but its velocity signature is rather anticyclonic (though it is weak). Considering its small diameter (about 30 km) and its intensification near 1300 m depth, it appears to be a fragment detached from the lower undercurrent, which then adjusted an anticyclonic rotation to its density structure. In the S om the undercurrents; it lies between km 150 and 280. cyclonic signature above this patch and only weak ve- locities in this patch. Furthermore, the maximum salinity (36) is rather low for a meddy (though such salinities might be observed at a meddy periphery). In the SEMANE 2001 data, smaller and more marked salinity patches are visible between km 130, priori a split structure or two neighboring structures), and a smaller one between km 265 and 285. Geostrophic velocity (with the bias due to the arbitrary level of no motion) indicates an anticyclonic signal for the whole structure between km 130 and 250 (it would thus consti- tute a meddy with 60 km radius). Considering their ther-  E. QUENTEL ET AL. 188 d 210 and a sm nd 1400 m depth. These two h also flecting, lens-like is a priori the l slope and surround the MW flow. of tween th n 600 and 1600 m depths, the salinity minimum in th n the southern meddy of SE Analysis of the MW Structures Ac lumn are in- uced by acoustic impedance contrasts. Therefore we mic reflectivity ex- tra e mesoscale and sub- m mohaline characteristics, these structures are likely to originate from undercurrent instabilities between Porti- mão Canyon and Cape Saint Vincent. Finally, in the SEMANE 2002 data, two salty bodies are visible: a large one between km 80 an aller one, detached from the undercurrents, between km 250 and 300. The geostrophic velocity is anticyclonic in the northern part of the large patch (other measure- ments, not shown here, indicate that a meddy was inten- sified west of this section at this latitude). The southern structure is more likely a small cyclone. The SISMAR 23 multi-channel seismic profile exhib- its three main features: Between km 30 and 90 two layers of intense reflec- tors are found near 900 a layers are separated by a weakly reflecting, lens-like core. From these characteristics, we infer that this structure is a meddy, with homogeneous core waters, high temperature and salinity gradients above and below this core. Such a location for a meddy is com- patible with the SEMANE 1999 observations. Between km 130 and 180 and between 900 and 1400 m depths, lies a thick stack of reflectors whic seems to form staircases. Since no strong reflector is found above or below this layer, we conclude that a dynamic structure, if it exists, must lie either com- pletely above or completely below. Finally, between km 190 - 200 and 230, strong re- flectors seem to circle a weakly re core. Though this feature is less clear than the south- ern one, we hypothesize that an anticyclonic structure lies there. Physically, this location is about mid-way between Portimão Canyon and Cape Saint Vincent and is known to be a site of meddy generation. The TGS-NOPEC multi-channel seismic profiles ex- hibit three main features (see Figure 2): In the 707 profile, three lens-like structures are iden- tified near the continental slope. Core X upper MW undercurrent. Lens Y is probably an anti- cyclonic structure recently detached from the slope. Lens Z is a priori a fragment of the shallow MW un- dercurrent. In the 808 profile, dipping reflectors are identified on the continenta Strong reflectors are identified above and below the MW cores (at 500 and 1500 m depth) and offshore the MW undercurrents at about 1000 m depth. The acoustic impedance contrasts in the ocean are de- termined by temperature and salinity gradients be e different water masses. This renders seismic ocean- ography sections sensitive to the frequency bandwidth, which is largely determined by the seismic source func- tion. Work by Hobbs et al. [19] shows that frequencies around 20 Hz are most appropriate to delineate large impedance contrasts which occur over a vertical scale of tens of meters, whereas frequencies around 60 Hz image boundary layers of about 10 m thickness. To provide a comprehensive seismic image of water masses would require broadband data from less than 10 Hz to more than 200 Hz. The low frequency data we have, best de- lineate the boundary of the Meddy and of the undercur- rents. The SEMANE 2001 section (in Figure 2) shows that, betwee e Mediterranean Water undercurrents is 35.6 and that the salinity maximum is 36.4. These values of minima and maxima are also found in the vertical profile of salinity i MANE 1999, shown in Figure 3. In this latter figure, it can also be seen that temperature decreases from 11.5˚C to 7˚C between 1200 and 1600 m depth. In this depth range, we observe the homogeneous layers previ- ously mentioned with large thermohaline staircases (staircases are also observed above the meddy). 4. Synthetic Reflectivity and Wavelet oustic wave reflections in the water co d calculated a synthetic vertical gradient of acoustic im- pedance from the SEMANE hydrological data, for com- parison with the SISMAR seismic reflectivity data. Acoustic impedance is I = ρ.c where ρ is the seawater density and c the sound speed. Reflectivity Z was calcu- lated from hydrology via Z = dI/dz. Figure 4 shows synthetic reflectivity calculated from SEMANE 2001 data and real seis cted from SISMAR23 data. Synthetic reflectivity pre- sents a strong amplitude between 800 and 1400 m depth whereas real seismic reflectivity shows large values be- tween 700 and 1300 m depth. We note that the vertical gradient of sound speed is dominant in the synthetic re- flectivity signal. Intense sound speed gradients are also identified in the SEMANE data. Then we performed a wavelet analysis on vertical pro- files of these variables across th esoscale features of the 1999 section. The analysis is a Continuous Wavelet Analysis modified from Grinsted et al. [20] using a Morlet wavelet with a vertical reference wavenumber equal to 6; this value was chosen to provide a good balance between distance and frequency localiza- tion. The continuous Wavelet Transform (CWT) can be seen as a consecutive series of band-pass filters applied to the depth series where the wavelet scale is linearly related to the characteristic period of the filter. The CWT Copyright © 2011 SciRes. IJG 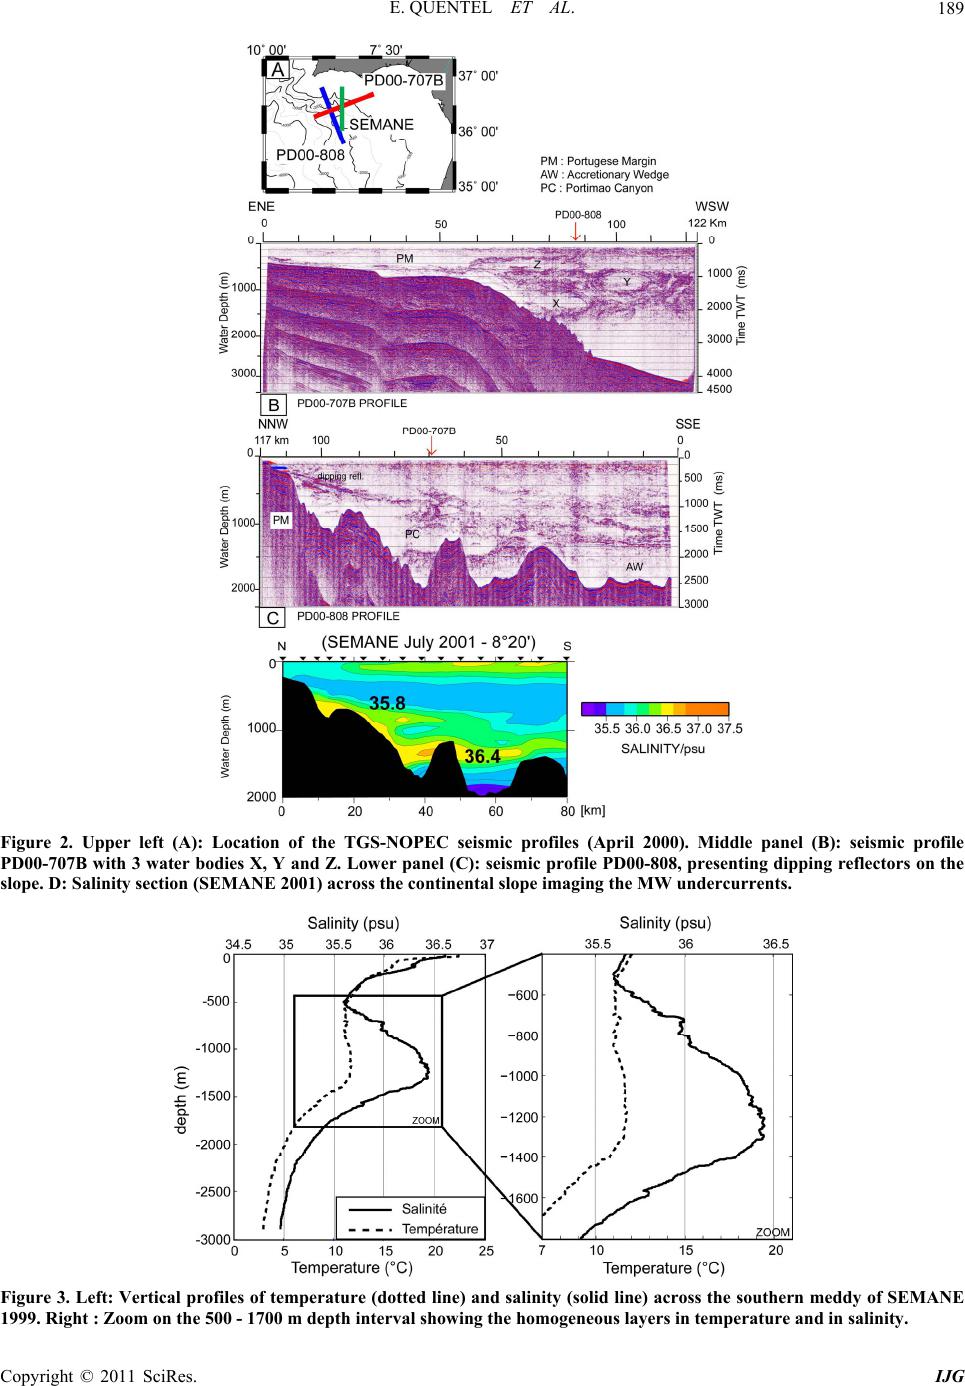 E. QUENTEL ET AL. Copyright © 2011 SciRes. IJG 189 Figure 2. Upper left (A): Location of the TGS-NOPEC seismic profiles (April 2000). Middle panel (B): seismic profile PD00-707B with 3 water bodies X, Y and Z. Lower panel (C): seismic profile PD00-808, presentireflectors on the ng dipping slope. D: Salinity section (SEMANE 2001) across the continental slope imaging the MW undercurrents. Figure 3. Left: Vertical profiles of temperature (dotted line) and salinity (solid line) across the southern meddy of SEMANE 1999. Right : Zoom on the 500 - 1700 m depth interval showing the homogeneous layers in temperature and in salinity. 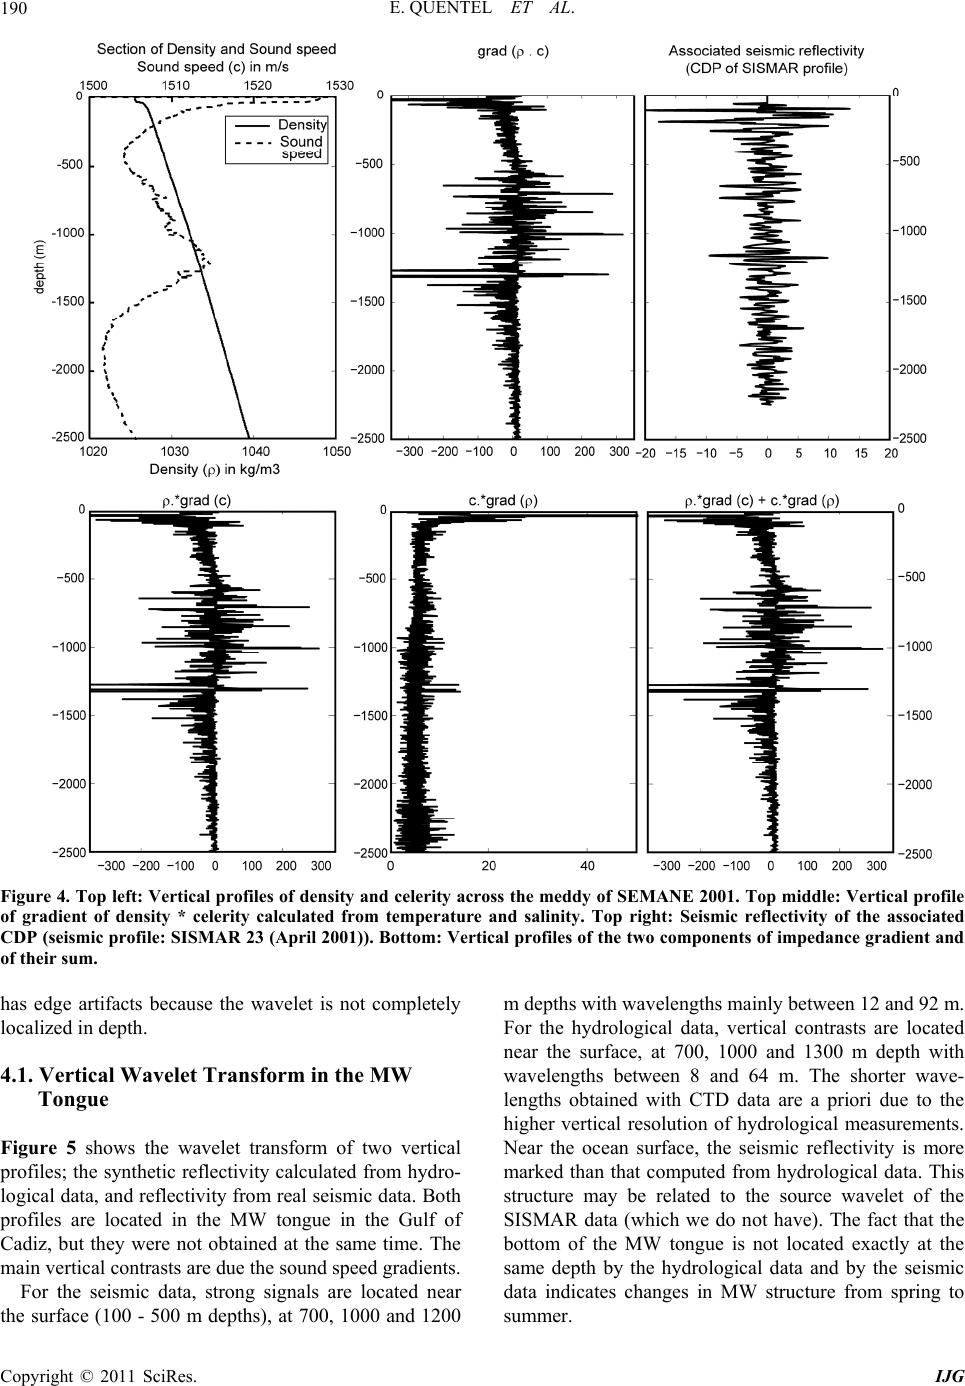 E. QUENTEL ET AL. 190 Figure 4. Top left: Vertical profiles of density and celerity across the meddy of SEMANE 2001. Top middle: Vertical profile of gradient of density * celerity calculated from temperature and salinity. Top right: Seismic reflectivity of the associated facts because the wavelet is not completely elet Transform in the MW Figu s the wavelet transform of two vertical e synthetic reflectivity calculated from hydro- m depths with wavelengths mainly between 12 and 92 m. For CDP (seismic profile: SISMAR 23 (April 2001)). Bottom: Vertical profiles of the two components of impedance gradient and of their sum. has edge arti localized in depth. 4.1. Vertical Wav Tongue re 5 show profiles; th logical data, and reflectivity from real seismic data. Both profiles are located in the MW tongue in the Gulf of Cadiz, but they were not obtained at the same time. The main vertical contrasts are due the sound speed gradients. For the seismic data, strong signals are located near the surface (100 - 500 m depths), at 700, 1000 and 1200 the hydrological data, vertical contrasts are located near the surface, at 700, 1000 and 1300 m depth with wavelengths between 8 and 64 m. The shorter wave- lengths obtained with CTD data are a priori due to the higher vertical resolution of hydrological measurements. Near the ocean surface, the seismic reflectivity is more marked than that computed from hydrological data. This structure may be related to the source wavelet of the SISMAR data (which we do not have). The fact that the bottom of the MW tongue is not located exactly at the same depth by the hydrological data and by the seismic data indicates changes in MW structure from spring to summer. Copyright © 2011 SciRes. IJG  E. QUENTEL ET AL.191 Figure 5. Vertical wavelet analysis of seismic reflectivity (CDP of a SISMAR stack) and synt hetic reflectivity calculated from hydrological data (CTD of SEMANE 2002). Data were collected through the tongue of MW in the Gulf of Cadiz. The vertical wavelength and the depth are given in meters. The thick black contour designates the 5% significance level against red noise he vertiflectivity across veral mesoscale and submesoscale structures on that ectivity Profiles in a Meddy f real seism) and that of a nthetic reflectivity profile (calculated from a CTD of and 92 m. The synthetic data have wavelengths between 8 and 64 m. The shorter wavelengths may again be at- t analy- is. The main vertical contrasts are due to the sound and be- twee depth with wavelengths between and 128 m. Between 600 and 1000 m depths wave- cale and the cone of influence (COI) where edge effects might distort the picture is shown as a lighter shade. Scale de fined to blue (-1) from red (1) is the normalized correlation coefficient. 4.2. Vertical Wavelet Transform in Mesoscale and Sub-Mesoscale Structures the seismic data have vertical wavelengths between 12 Figure 6 shows the salinity cross-section of 1999 and t cal wavelet transforms of synthetic re se section. Along the Meddy axis, the strongest signals of reflectivity are located near the surface, between 600 and 800 m and between 1200 and 1800 m depths, with wavelengths mainly between 8 and 64 m. This reflectiv- ity is located at the depths of the thermohaline staircases. For the cyclone, the reflectivity signal is intensified in the lower part of the structure, between 900 and 1700 m depths, with wavelengths from 8 to 64 m. Thermohaline contrasts are more marked at these depths for this cy- clone. For the sub-mesoscale structure, the reflectivity is concentrated near 1500 m depth (its lower boundary), with vertical wavelengths between 8 - 64 m. The fila- ment has vertical gradients comparable with those of the cyclone. 4.3. Wavelet Analysis of Real and Synthetic Refl Figure 7 compares the vertical wavelet transform o ic reflectivity (a CDP of SISMAR 23 sy SEMANE 2001); these profiles do not match in space nor time, but both correspond to a meddy. Structures in tributed to the higher vertical resolution of CTD data than that of seismic profiles. Both signals exhibit strong reflectivity at the base of the meddy, but the synthetic data also have strong reflectivity at the upper boundary of the meddy. Below the sea surface, reflectivity is ob- served more intensely by seismic measurements. 4.4. Acoustic Reflectivity across the MW Undercurrents Figure 8 shows the vertical gradient of acoustic imped- ance across the MW undercurrents and its wavele s speed gradients and are located near the surface n 600 and 1200 m 8 lengths are mainly of 128 m. This wavelength is related to the thickness of the MW undercurrents themselves. The shorter wavelengths near 1200 m depth are related to thermohaline staircases below these undercurrents. 5. Conclusions The hydrological data of the SEMANE experiments shows a diffuse tongue of Mediterranean Water across the Gulf of Cadiz with a salinity of about 36. Mesos Copyright © 2011 SciRes. IJG  E. QUENTEL ET AL. 192 Figure 6. Upper plot : Salinity cross section along 8˚20'W in the Gulf of Cadiz from SEMANE 1999. This section identifies the four structures which are then analysed via wavelets. Lower four plots: Wavelet analysis of vertical gradients of reflectivity through the meddy, the cyclone, the submesoscale structure and the filament of the SEMANE 1999 hydrological section. The dashed curve at the bottom of each plot bounds the region of confidenc e for wavelet analy sis (this region lies above the cue). rv Wavelengths are as in Figure 3. Figure 7. Vertical wavelet analysis of a real seismic reflection pr ofile (CDP of stack SISMAR 23) co-located with a synthetic reflectivity profile (calculated from SEMANE 2001 CTD data) through meddies. The dashed line indicates the limit of confi- dence for wavelet analysis. Wavelegths are as in Figure 3. Copyright © 2011 SciRes. IJG 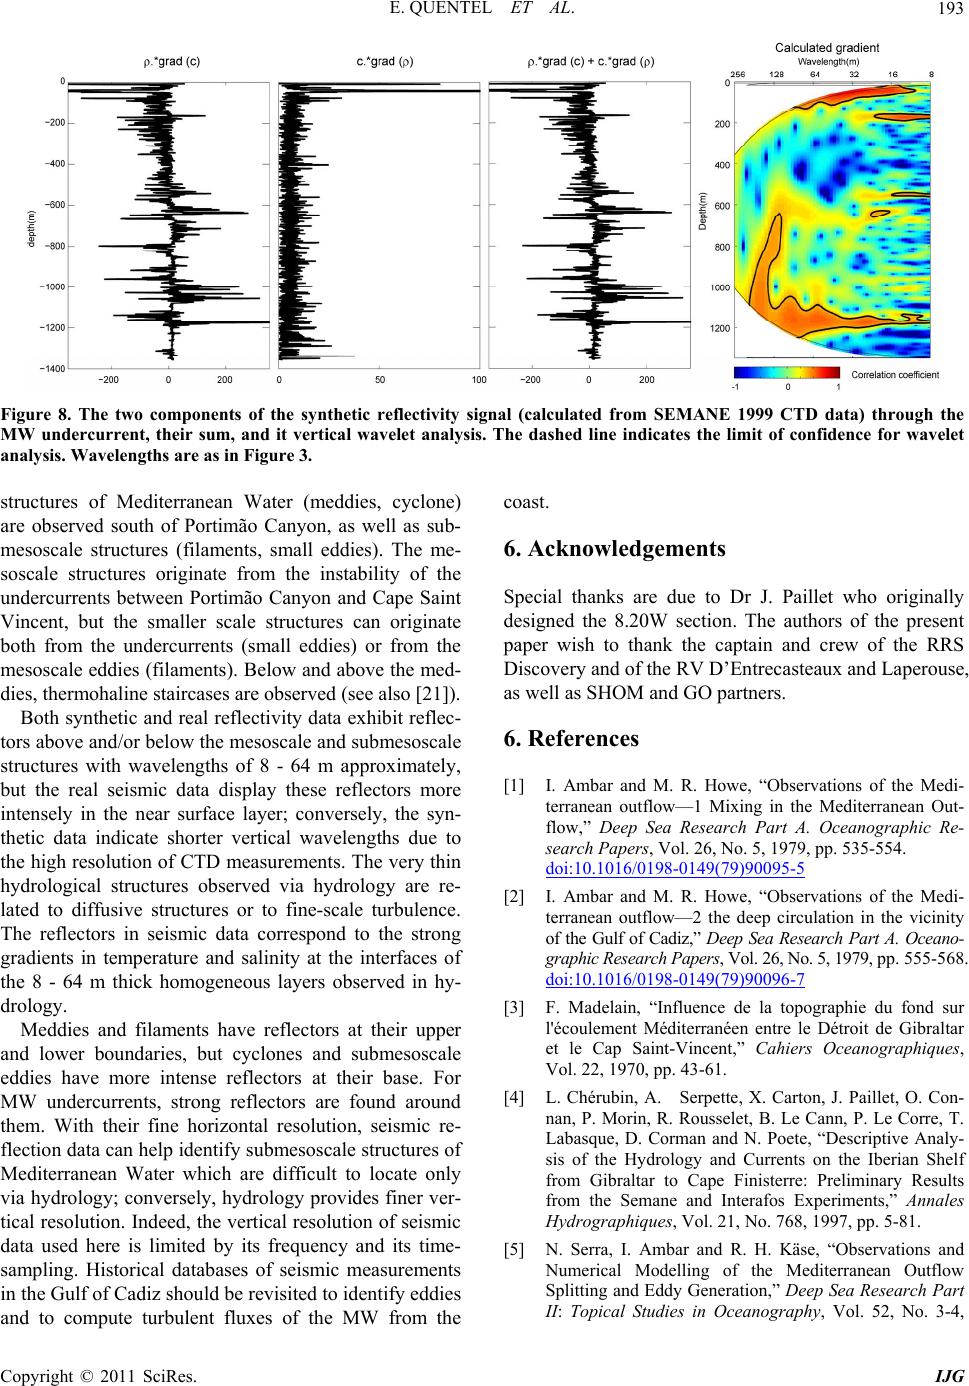 E. QUENTEL ET AL.193 Figure 8. The two components of the synthetic reflectivity signal (calculated from SEMANE 1999 CTD data) through the MW undercurrent, their sum, and it vertical wavelet analysis. The dashed line indicates the limit of confidence for wavelet analysis. Wavelengths are as in Figure 3. - soscale structures originate from the instability of the undercurrents between Portimão Canyon and Cape Saint Vincent, but the smaller scale structures can originate both from the undercurrents (small eddies) or from the mesoscale eddies (filaments). Below and above the med- dies, thermohaline staircases are observed (see also [21]). Both synthetic and real reflectivity data exhibit reflec- tors above and/or below the mesoscale and submesoscale structures with wavelengths of 8 - 64 m approximately, but the real seismic data display these reflectors more intensely in the near surface layer; conversely, the syn- thetic data indicate shorter vertical wavelengths due to the high resolution of CTD measurements. The very thin hydrological structures observed via hydrology are re- lated to diffusive structures or to fine-scale turbulence. observed in hy- 6. Acknowledgements Special thanks are due to Dr J. Paillet who originally designed the 8.20W section. The authors of the present paper wish to thank the captain and crew of the RRS Discovery and of the RV D’Entrecasteaux and Laperouse, as well as SHOM and GO partners. 6. References [1] I. Ambar and M. R. Howe, “Observations of the Medi- terranean outflow—1 Mixing in the Mediterranean Out- flow,” Deep Sea Research Part A. Oceanographic Re- search Papers, Vol. 26, No. 5, 1979, pp. 535-554. doi:10.1016/0198-0149(79)90095-5 structures of Mediterranean Water (meddies, cyclone) are observed south of Portimão Canyon, as well as sub- mesoscale structures (filaments, small eddies). The me coast. [2] I. Ambar and M. R. Howe, “Observations of the Medi- doi:10.1016/0198-0149(79)90096-7 The reflectors in seismic data correspond to the strong gradients in temperature and salinity at the interfaces of he 8 - 64 m thick homogeneous layerst drology. Meddies and filaments have reflectors at their upper and lower boundaries, but cyclones and submesoscale eddies have more intense reflectors at their base. For MW undercurrents, strong reflectors are found around them. With their fine horizontal resolution, seismic re- flection data can help identify submesoscale structures of Mediterranean Water which are difficult to locate only via hydrology; conversely, hydrology provides finer ver- tical resolution. Indeed, the vertical resolution of seismic data used here is limited by its frequency and its time- sampling. Historical databases of seismic measurements in the Gulf of Cadiz should be revisited to identify eddies and to compute turbulent fluxes of the MW from the terranean outflow—2 the deep circulation in the vicinity of the Gulf of Cadiz,” Deep Sea Research Part A. Oceano- graphic Research Papers, Vol. 26, No. 5, 1979, pp. 555-568. [3] F. Madelain, “Influence de la topographie du fond sur l'écoulement Méditerranéen entre le Détroit de Gibraltar et le Cap Saint-Vincent,” Cahiers Oceanographiques, Vol. 22, 1970, pp. 43-61. [4] L. Chérubin, A. Serpette, X. Carton, J. Paillet, O. Con- nan, P. Morin, R. Rousselet, B. Le Cann, P. Le Corre, T. Labasque, D. Corman and N. Poete, “Descriptive Analy- sis of the Hydrology and Currents on the Iberian Shelf from Gibraltar to Cape Finisterre: Preliminary Results from the Semane and Interafos Experiments,” Annales Hydrographiques, Vol. 21, No. 768, 1997, pp. 5-81. [5] N. Serra, I. Ambar and R. H. Käse, “Observations and Numerical Modelling of the Mediterranean Outflow Splitting and Eddy Generation,” Deep Sea Research Part II: Topical Studies in Oceanography, Vol. 52, No. 3-4, Copyright © 2011 SciRes. IJG  E. QUENTEL ET AL. 194 2005, pp. 383-408. doi:10.1016/j.dsr2.2004.05.025 [6] N. Serra and I. Ambar, “Eddy Generation in the Mediter- ranean Undercurrent,” Deep Sea Research Part II: Topi- cal Studies in Oceanography, Vol. 49, No. 19, 2002, pp. 4225-4243. [7] I. Ambar, N. Serra, F. Neves and T. Ferreira, “Observa- tions of the Mediterranean Undercurrent and Eddies in the Gulf of Cadiz during 2001,” Journal of Marine Sys- tems, Vol. 71, No. 1-2, 2008, pp. 195-220. doi:10.1016/j.jmarsys.2007.07.003 8] N[. Serra, S. Sadoux, I. Ambar and D. Renouard, “Obser- deling of Meddy Generation at al of Physical Oceanography, Vol. 32, No. 1, 2002, pp. 3-25. vations and Laboratory Mo Cape St. Vincent,” Journ doi:10.1175/1520-0485(2002)032<0003:OALMOM>2.0. CO;2 [9] W. Zenk, K.L. Schultz-Tokos and O. Boebel, “New Ob- servations of Meddy Movement South of the Tejo Pla- teau,” Geophysical Research Letters, Vol. 12, No. 24, 1992, pp. 2389-2392. doi:10.1029/92GL02139 e Cann, A. Serpette, Y. Morel and X e Tracking of a Northern Meddy in [10] J. Paillet, B. L ton, “Real-tim . Car- 1997-1998,” Geophysical Research Letters, Vol. 26, No. 13, 1999, pp. 1877-1880. doi:10.1029/1999GL900378 [11] J. Paillet, B. Le Cann, X. Carton, Y. Morel and A. Ser- pette, “Dynamics and Evolution of a Northern Meddy,” Journal of Physical Oceanography, Vol. 32, No. 1, 2002, pp. 55-79. doi:10.1175/1520-0485(2002)032<0055:DAEOAN>2.0. CO;2 [12] X. Carton, L. Chérubin, J. Paillet, Y.Morel, A. Serpette and B. Le Cann, “Meddy coupling with a deep cyclone in the Gulf of Cadiz,” Journal of Marine Systems, Vol. 32, No. 1-3, 2002, pp. 13-42. doi:10.1016/S0924-7963(02)00028-3 [13] X. Carton, N. Daniault, J. Alves, L. Cherubin and I. Am- bar, “Meddy dynamics and interaction with neighboring eddies southwest of Portugal: observations and model- ing,” Journal of Geophysical Research, Vol. 115, No. C6, 2010, p. C06017. doi:10.1029/2009JC005646 [14] W. S. Holbrook, P. Paramo, S. Pearse and R. W. Schmitt, “Thermohaline Fine Structure in an Oceanographic Front from Seismic Reflection Profiling,” Science, Vol. 301, No. 5634, 2003, pp. 821-824. doi:10.1126/science.1085116 [15] P. Nandi, W. S. Holbrook, S. Pearse, P. Paramo and R. W. Schmitt, “Seismic Reflection Imaging of Water Mass Boundaries in the Norwegian Sea,” Geophysical Re- search Letters, Vol. 31, 2004, p. L23311. doi:10.1029/2004GL021325 [16] E. Thiébot and M.-A. Gutscher, “The Gibraltar Arc seis- mogenic zone (part 1): Constraints on a Shallow East Dipping Fault Plane Source for the 1755 Lisbon Earth- quake Provided by Seismic Data, Gravity and thermal Modeling, Tectonophysics, Vol. 426, No. 1-2, 2006, pp. 135-152. doi:10.1016/j.tecto.2006.02.024 [17] Ö. Yilmaz, “Seismic Data Processing,” In: E. Neitzel, B. Stephen, M. Doherty, Eds, Investigations in Geophysics Society , of Exploration Geophysics, Tulsa, 1987. es, E. Vsemirnova [18] R. J. J. Hardy and R. W. Hobbs, “Multiple Suppression in Deep Water,” AGU Geodynamics Series, Vol. 22, 1991, pp. 383-390. [19] R. W. Hobbs, D. Klaeschen, V. Sallar and C. Papenberg, “The Effect of Seismic Source Band- width on Reflection Sections to Image Water Structure,” Geophysical Research Letters, Vol. 36, 2009, pp. 1-5. [20] A. Grinsted, J. C. Moore and S. Jevrejeva, “Application of the Cross Wavelet Transform and Wavelet Coherence to Geophysical Time Series,” Nonlinear Processes in Geophysics, Vol. 11, 2004, pp. 561-566. doi:10.5194/npg-11-561-2004 [21] E. Quentel, X. Carton, M. A. Gutscher and R. Hobbs, “Detecting and Characterizing Mesoscale and Sub- mesoscale of Mediterranean Water from Joint Seismic and Hydrographic Measurements in the Gulf of Cadiz,” Geophysical Research Letters, Vol. 37, 2010. doi:10.1029/2010GL042766 Copyright © 2011 SciRes. IJG
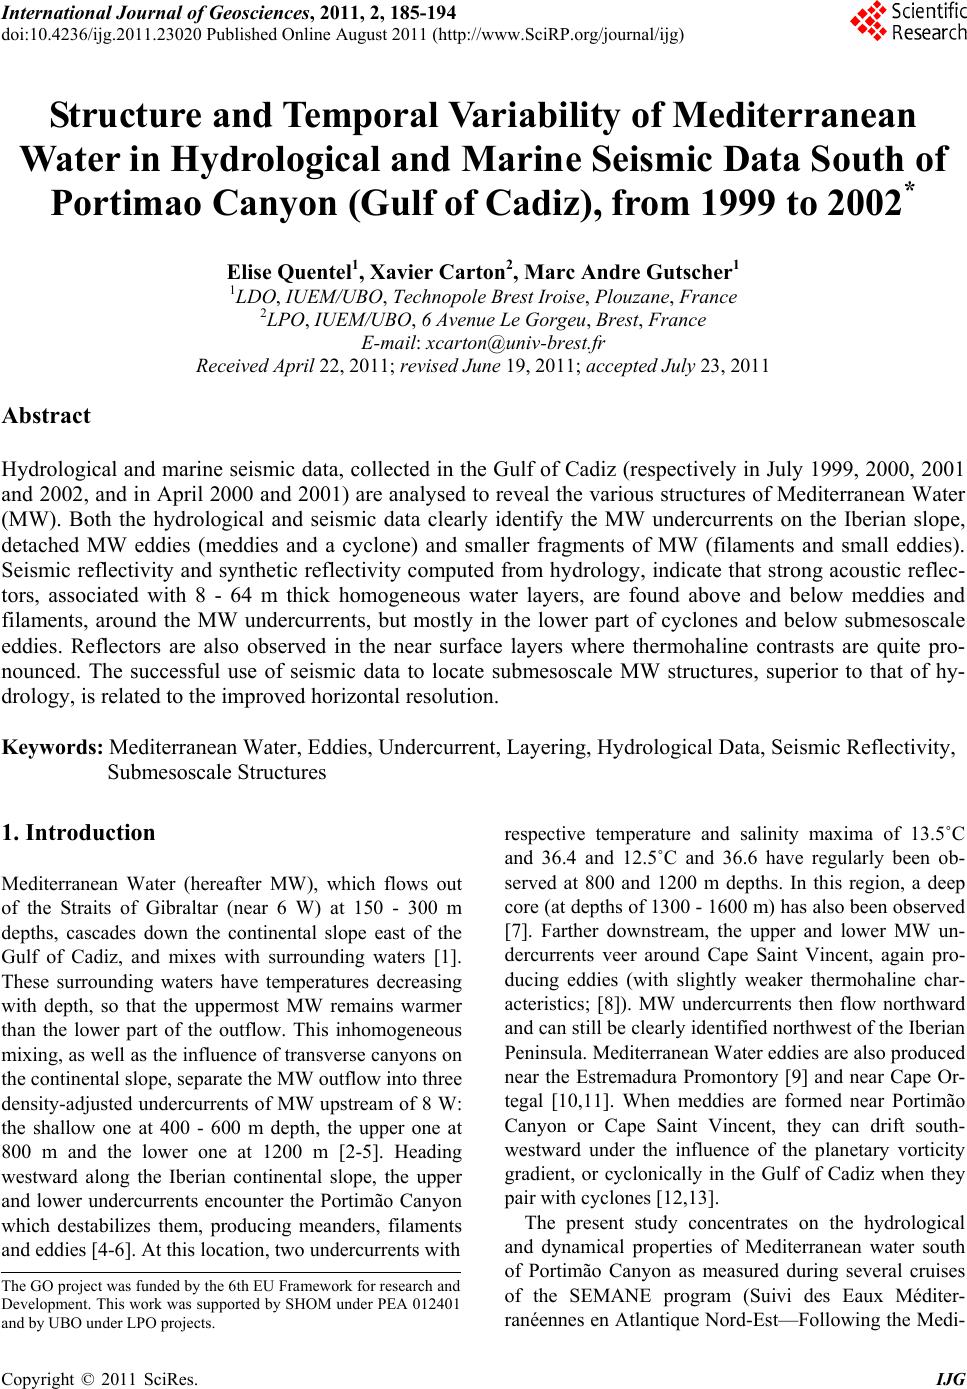
|