Paper Menu >>
Journal Menu >>
 Creative Education 2011. Vol.2, No.3, 270-275 Copyright © 2011 SciRes. DOI:10.4236/ce.2011.23036 Representation Registers in the Solution of Calculus Problems Elena Fabiola Ruiz Ledesma Graduate Department, School of Computer Sciences of the National Polytechnical Institute of Mexico, Gustavo A. Madero, Mexico. Email: efruiz@ipn.mx Received June 17th, 2011; revised June 30th, 2011; accepted July 5th, 2011. This article is derived from the research project registered under number 20110343 (Ruiz, 2011), and developed in Escuela Superior de Cómputo del Instituto Politécnico Nacional (IPN) (School of Computer Sciences of the National Poly-technical Institute of Mexico). The article reports on the problems found among Engineering stu- dents with respect to their resistance to using different representation registers when solving optimization prob- lems in the Calculus Learning Unit. Use of such registers could help the students to build mathematics know- ledge and to solve calculus problems. As a didactic strategy, simulations are used in an electronic environment in order to support the students by fostering their use of tabular, graphical and algebraic representation registers. Interviews are undertaken of six of the professors who give the calculus courses, and a diagnostic questionnaire is applied to 68 students prior to and after working with the proposal. As for the theoretical framework, the work reported by Duval and Hitt is salient in this report, particularly their emphasis of the fact that working on activi- ties by way of one single representation system is not sufficient. From the first responses provided by the stu- dents, one can conclude that the algebraic register is preferred by the majority of students. It is however used in a mechanical fashion without affording any meaning to the content of the problem and to the process of solving it. Another conclusion reported is that implementing tasks in the classroom in which the mathematics activity requires coherent use of different representations is n ecessary. Keywords: Calculus, Representations Registers, Sim ulations, Electronic Environments Introduction The study reported in this article uses the reference of a cog- nitive focus based on the registers of semiotic representation of Duval and their effect on the learning of mathematics notions, particularly on solving the optimization problems worked on in the Calculus Learning Unit for second year Engineering stu- dents. Hence first a review was undertaken of aspects of the representation registers, after which the three registers used in the study reported in this article, namely the graphical, tabular and algebraic registers, are docum ented. Background As pointed out by Duval (1998), the semiotic representations are representations that employ signs, which can be expressed in natural language or in algebraic formulae or in graphs or in geometric figures. However those semiotic representations are the means through which a person can externalize his/her men- tal representations in order to make them visible or accessible to others. Those semiotic representations also make communi- cation possible. Duval, 1998 focuses on and establishes the fundamental im- portance of issues the likes of: The ability to change registers of semiotic representation, which is necessary in the learning of mathematics. The importance of coordinating different registers of semi- otic representation. He explains that many of the difficulties experienced by students can be described and explained as a lack of coordination among representation registers. Considering conceptual knowledge (comprehension) as the invariant of multiple semiotic representations. Based on different representation registers, defining specific independent variables for cognitive contents and organizing didactic proposals in order to develop coordinated repre- sentation registers. On building mathematics concepts, Duval, 1998 establishes that given that each representation is partial vis-à-vis the con- cept it represents, interaction among different representations of the mathematics object must be considered absolutely neces- sary for its formation. As for the work per se of the graphical, tabular and algebraic representation registers, as well as of the problem, as is pointed by Hitt, 2001a, 2002b and Arcavi, 2001, who underscores that visualization enables statements to be understood and activities to be carried out, and although it does not lead to the correct answer, it does enable the person solving a problem to delve deeply into the situation being solved. The author moreover states that visualization constitutes the link to seeking the solu- tion to the problem raised. The foregoing researcher (Hitt, 2003; Arcavi, 2002) also points out that mathematical visualization of a problem plays an important role, and involves understanding the word problem by bringing into play varying representations of the situation in question, thus making it possible to undertake an action that will possibly lead to solving the problem. According to the theory of importance about the use of dif- ferent representations in the mathematics teaching, what it has to be done is to introduce the mathematical concepts with ac- tivities that can give the work with different representations. This can be easier to understand with an example of a case 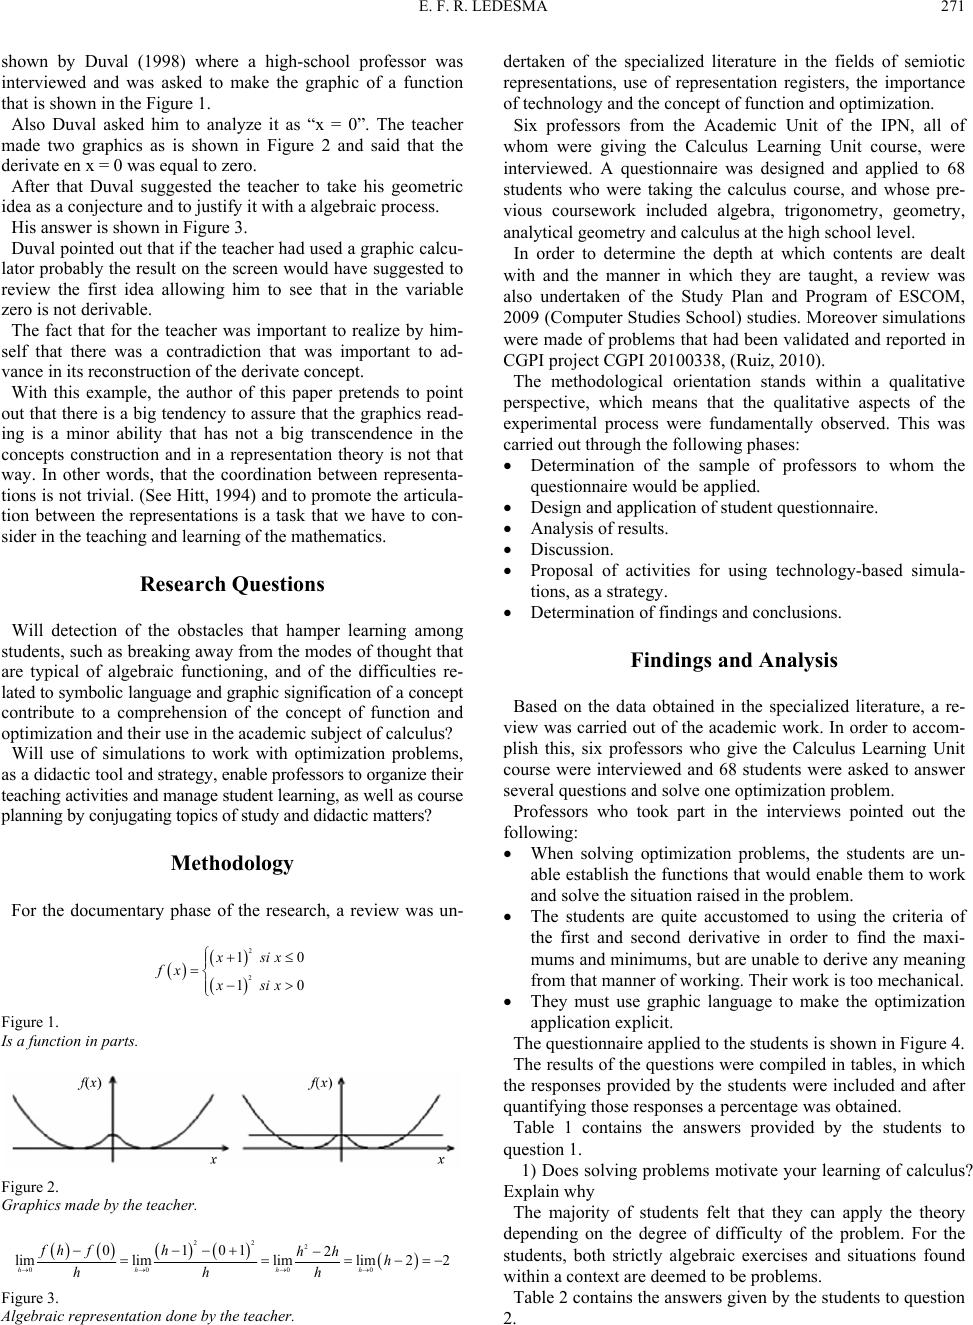 E. F. R. LEDESMA 271 shown by Duval (1998) where a high-school professor was interviewed and was asked to make the graphic of a function that is shown in the Figure 1. Also Duval asked him to analyze it as “x = 0”. The teacher made two graphics as is shown in Figure 2 and said that the derivate en x = 0 was equal to zero. After that Duval suggested the teacher to take his geometric idea as a conjecture and to justify it with a algebraic process. His answer is shown in Figure 3. Duval pointed out that if the teacher had used a graphic calcu- lator probably the result on the screen would have suggested to review the first idea allowing him to see that in the variable zero is not derivable. The fact that for the teacher was important to realize by him- self that there was a contradiction that was important to ad- vance in its reconstruction of the derivate concept. With this example, the author of this paper pretends to point out that there is a big tendency to assure that the graphics read- ing is a minor ability that has not a big transcendence in the concepts construction and in a representation theory is not that way. In other words, that the coordination between representa- tions is not trivial. (See Hitt, 1994) and to promote the articula- tion between the representations is a task that we have to con- sider in the teaching and learning of the mathematics. Research Questions Will detection of the obstacles that hamper learning among students, such as breaking away from the modes of thought that are typical of algebraic functioning, and of the difficulties re- lated to symbolic language and gr aphic signification of a concept contribute to a comprehension of the concept of function and optimization and their use in the academic subject of calculus? Will use of simulations to work with optimization problems, as a didactic tool and strategy, enable professors to organize their teaching activities and manage student learning, as well as course planning by conjugating topics of study and didactic matters? Methodology For the documentary phase of the research, a review was un- 2 2 1 0 1 0 xsix fx xsix Figure 1. Is a function in parts. Figure 2. Graphics made by the teacher. 22 2 00 00 0101 2 limlimlimlim2 2 hh hh fh fhhh h hhh Figure 3. Algebraic representation done by th e teacher. dertaken of the specialized literature in the fields of semiotic representations, use of representation registers, the importance of technology and the concept of function and optimization. Six professors from the Academic Unit of the IPN, all of whom were giving the Calculus Learning Unit course, were interviewed. A questionnaire was designed and applied to 68 students who were taking the calculus course, and whose pre- vious coursework included algebra, trigonometry, geometry, analytical geometry and calculus at the high school level. In order to determine the depth at which contents are dealt with and the manner in which they are taught, a review was also undertaken of the Study Plan and Program of ESCOM, 2009 (Computer Studies School) studies. Moreover simulations were made of problems that had been validated and reported in CGPI project CGPI 20100338, (Ruiz, 2010). The methodological orientation stands within a qualitative perspective, which means that the qualitative aspects of the experimental process were fundamentally observed. This was carried out through the following phases: Determination of the sample of professors to whom the questionnaire would be applied. Design and application of student questionnaire. Analysis of results. Discussion. Proposal of activities for using technology-based simula- tions, as a strategy. Determination of findings and conclusions. Findings and Analysis Based on the data obtained in the specialized literature, a re- view was carried out of the academic work. In order to accom- plish this, six professors who give the Calculus Learning Unit course were interviewed and 68 students were asked to answer several questions and solve one optimization problem. Professors who took part in the interviews pointed out the following: When solving optimization problems, the students are un- able establish the functions that would enable them to work and solve the situation raised in the problem. The students are quite accustomed to using the criteria of the first and second derivative in order to find the maxi- mums and minimums, but are unable to derive any meaning from that manner of working. Their work is too mechanical. They must use graphic language to make the optimization application explicit. The questionnaire applied to the students is shown in Figure 4. The results of the questions were compiled in tables, in which the responses provided by the students were included and after quantifying those responses a percentage was obtained. Table 1 contains the answers provided by the students to question 1. 1) Does solving problems motivate your learning of calculus? Explain why The majority of students felt that they can apply the theory depending on the degree of difficulty of the problem. For the students, both strictly algebraic exercises and situations found within a context are deemed to be problems. Table 2 contains the answers given by the students to question 2.  E. F. R. LEDESMA 272 Instructions: Answer the questions and solve the problem. Write out the entire proc- ess used in order to produce your solution. 1. Does solving problems motivate your learning of Calculus? Explain why. 2. What is your basis for sol ving optimization problems? Explain. 3. Do you use the support of a graph when solving optimization prob- lems? Explain why. 4. Do you use the support of a table when solving optimization prob- lems? Explain why. 5. Solve the f ollowing problem : A container in the shape of an uncovered straight circular cylinder has a surface area of 3 m 2. What height h and radius of the base r will maximize the volume of the cylinder? Figure 4. Contains the questions that were answered and problem that was solved by the sample of 68 students. Table 1. Compilation of answers t o qu e s t i o n 1. Answer Percentage Always because I apply the the ory 24% Sometimes because of the type of problem 44% Never beca use the problems are very difficult 32% Organization of answers provided by the 68 students to question 1. Table 2. Compilation of answers t o qu e s t i o n 2. Answer Percentage Use the crite r ion of the first derivative in the function 24% Use the criterion of the second derivative in the function that I found 76% Two criteria used by the 68 students in order to solve optimization problems. 2) What is your basis for solving optimization problems? Explain why Table 2 shows that 100% of the students use the algebraic register to solve optimization problems, given that 24% use the criterion of the first derivative in the algebraic expression and 76% use the criterion of the second derivative. Both are alge- braic procedures, and this coincides with the assertions made by (Hitt, 2002a, 2002b; Arcavi, 2001). Moreover they only con- sider the function through the algebraic expression when the function can be represented by way of different registers. Table 3 contains the answers given by the students to question 3. 3) Do you use the support of a graph when solving optimiza- tion problems? Explain why. Table 3 shows that only 6% of students use the graphical register, albeit only as a means of support, given that 100% use algebraic expressions in order to solve optimization problems. Another aspect can also be noted here: students do not like to graph, in addition to their not knowing how to interpret that the maximum point on a graph would be the answer to the optimi- zation problem. It is moreover clear from their answers that they do not trust what the graph can tell them, and rather feel more secure when using algebraic procedures. Table 4 contains the answers provided by the students to question 4. 4) Do you use the support of a table when solving optimiza- tion problems? Explain why. From Table 4 one can see that none of the students use tables, and the arguments they offer refer to how unsure they feel about using tables to solve an optimization problem. Moreover 62% of the students feel that tables are only used for graphs, thus proving yet again that they do not consider graphs as a means of representing a function and even less so to determine the solution of an optimization problem. Table 5 contains the answers provided by the students to the problem. 5) Solve the following problem: A container in the shape of an uncovered straight circular cylinder has a surface area of 3 m2. What height h and radius of the base r will maximize the volume of the cylinder? Overall 85% of the students worked with algebraic registers; no student used tabular or graphical registers to solve the prob- lem. It is clear that the students have serious trouble working with algebraic registers, troubles that range from not recalling the formula needed to calculate the volume of a cylinder through not clearing the problem correctly, which led them to being unable to find the algebraic expression needed to use the crite- ria of the first and/or second derivative and arrive at the correct solution to the problem. These findings coincide with those pointed out in (Duval, 1998; Hitt, 2002a, 2002b; Arcavi, 2002). Proposal with Simulations In the next section of the article, a proposal is put forth for working with all three registers—graphical, tabular and alge- braic—by using simulations in order for students to be able to visualize the situations raised. Only one of the simulations un- Table 3. Compilation of answers t o qu e s t i o n 3. Answer Percentage Yes, but I nee d to find the algebraic expression and calculate the derivativ e 6% No because it takes me too long to graph it and I don’t use the graph 46% No because it doesn’t help me to solve the problem 48% Justification of student use and non use of graphs when solving optimization problems. Table 4. Compilation of answers t o qu e s t i o n 4. Answer Percentage Yes 0% No because I use tables to produce graphs and I don’t need the graph 62% No because there is no certainly that a table will [help me] obtain a result 38% Arguments expressing why they do not use tables when solving optimization roblems. p 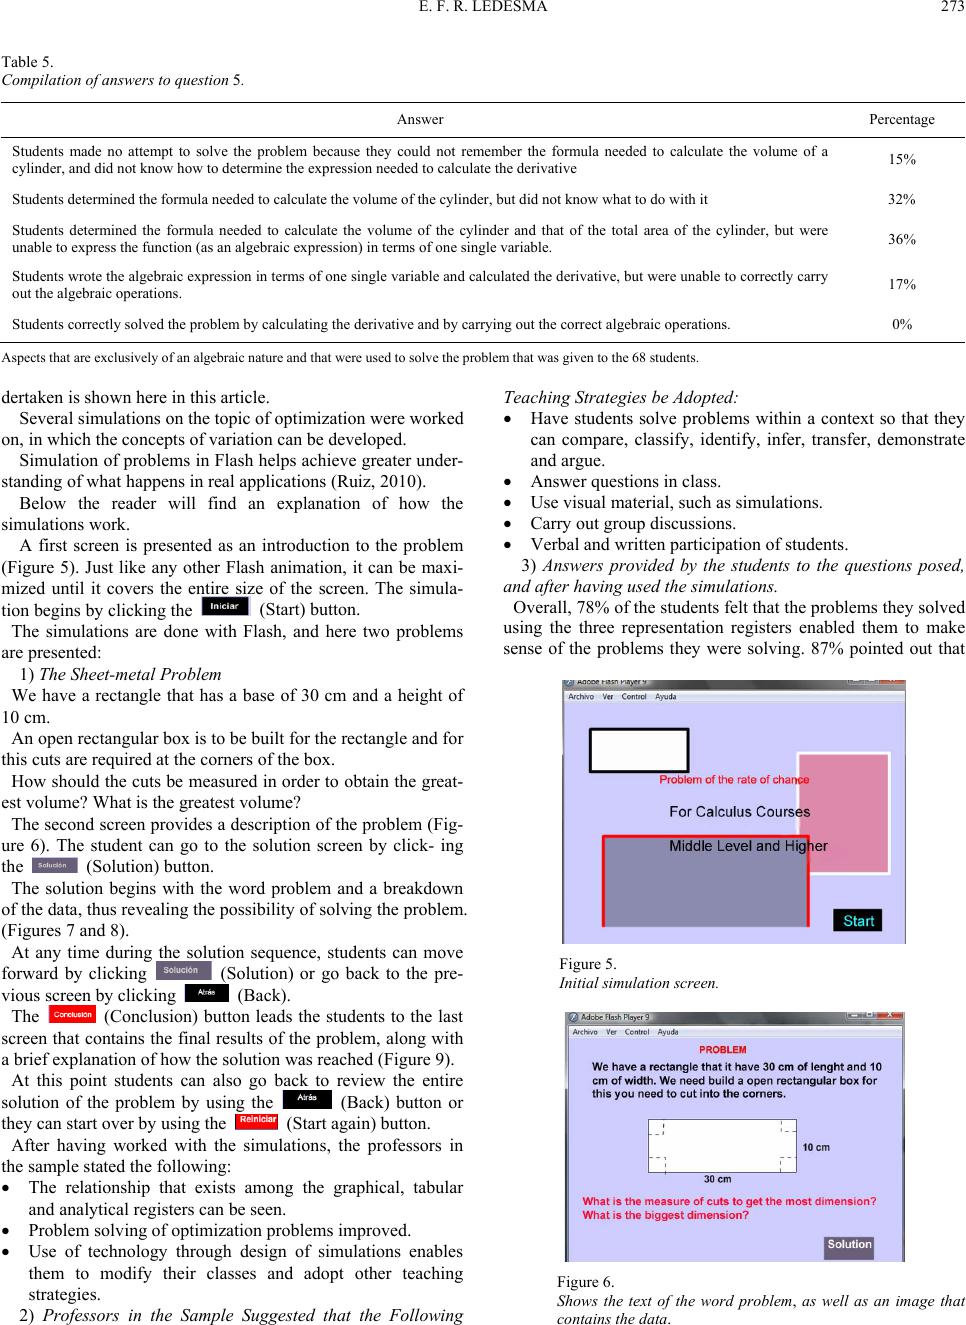 E. F. R. LEDESMA 273 Table 5. Compilation of answers t o qu e s t i o n 5. Answer Percentage Students made no attempt to solve the problem because they could not remember the formula needed to calculate the volume of a cylinder, a nd did not know how to determine the expression needed to calculate the derivative 15% Students determined the f ormula needed to calculate the volume of the cylinder, but d id not know what to do with it 32% Students determined the formula needed to calculate the volume of the cylinder and that of the total area of the cylinder, but were unable to express the function (as an algebraic expression) in terms of one single variable. 36% Students wrote the algebraic expression in terms of one single variable and calculated the derivative, but were unable to correctly carry out the algebraic operations. 17% Students correctly solved the problem by calculating the derivative and by carrying out the correc t alg ebraic operations. 0% Aspects that are exclusively of an algebraic nature and that were used to solve the problem that was given to the 68 students. dertaken is shown here in this article. Several simulations on the topic of optimization were worked on, in which the concepts of variatio n can be developed. Simulation of problems in Flash helps achieve greater under- standing of what happens in real applications (Ruiz, 2010). Below the reader will find an explanation of how the simulations work. A first screen is presented as an introduction to the problem (Figure 5). Just like any other Flash animation, it can be maxi- mized until it covers the entire size of the screen. The simula- tion begins by clicking the (Start) button. The simulations are done with Flash, and here two problems are presented: 1) The Sheet-metal Problem We have a rectangle that has a base of 30 cm and a height of 10 cm. An open rectangular box is to be built for the rectangle and for this cuts are required at the corners of the box. How should the cuts be measured in order to obtain the great- est volume? What is the greatest volume? The second screen provides a description of the problem (Fig- ure 6). The student can go to the solution screen by click- ing the (Solution) button. The solution begins with the word problem and a breakdown of the data, thus revealing the possibility of solving the problem. (Figures 7 and 8). At any time during the solution sequence, students can move forward by clicking (Solution) or go back to the pre- vious screen by clicking (Back). The (Conclusion) button leads the students to the last screen that contains the final results of the problem, along with a brief explanation of how the solution was reached (Figure 9). At this point students can also go back to review the entire solution of the problem by using the (Back) button or they can start over by using the (Start again) button. After having worked with the simulations, the professors in the sample stated the following: The relationship that exists among the graphical, tabular and analytical registers can be seen. Problem solving of optimization problems improved. Use of technology through design of simulations enables them to modify their classes and adopt other teaching strategies. 2) Professors in the Sample Suggested that the Following Teaching Strategies be Adopted: Have students solve problems within a context so that they can compare, classify, identify, infer, transfer, demonstrate and argue. Answer questions in class. Use visual material, such as simulations. Carry out group discussions. Verbal and written participatio n of students. 3) Answers provided by the students to the questions posed, and after having used the simulations. Overall, 78% of the students felt that the problems they solved using the three representation registers enabled them to make sense of the problems they were solving. 87% pointed out that Figure 5. Initial simulation screen. Figure 6. Shows the text of the word problem, as well as an image that contains the data. 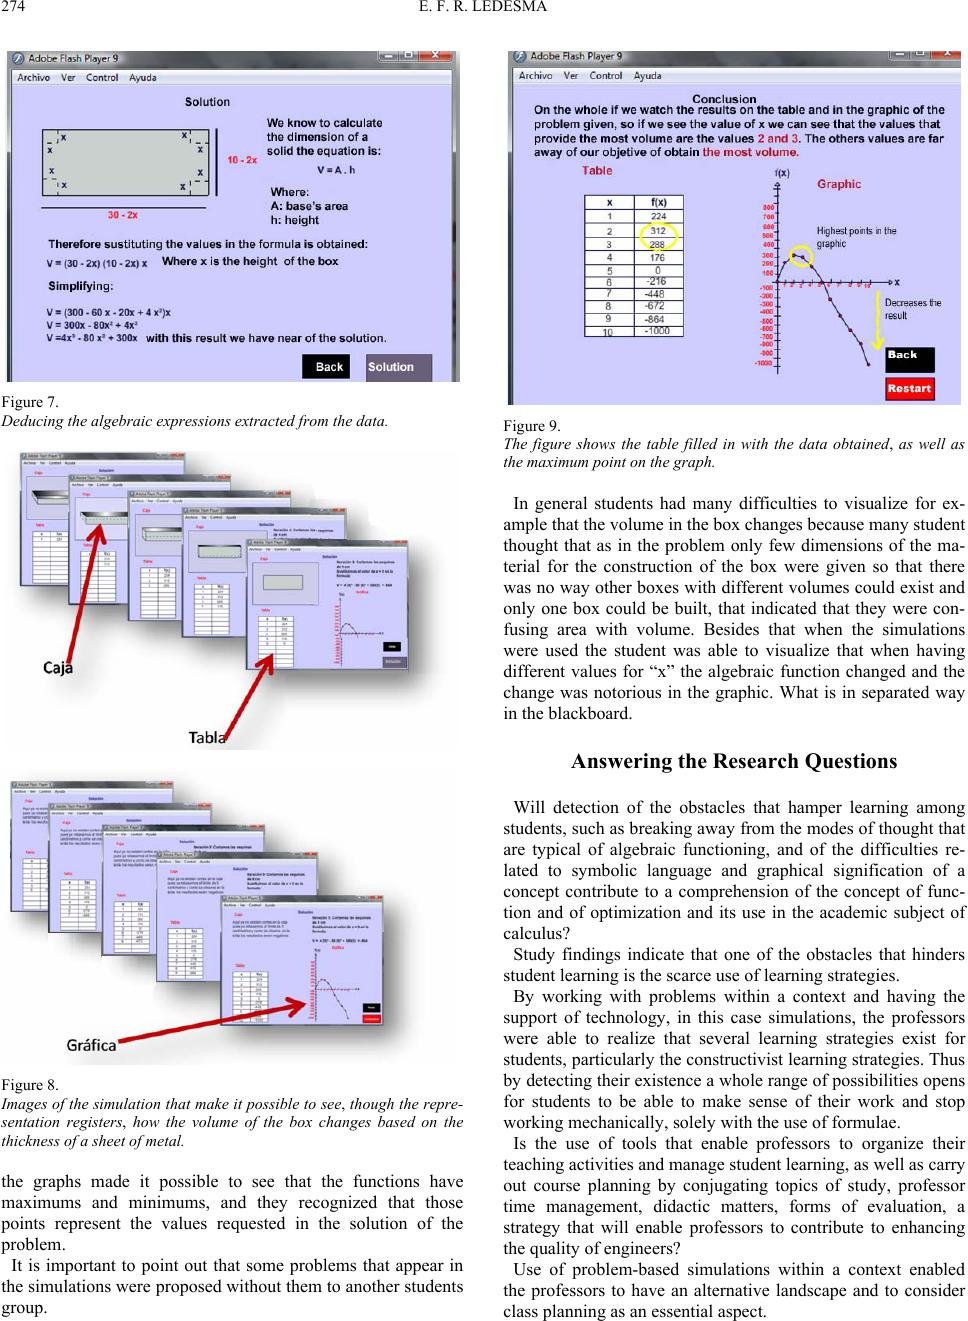 E. F. R. LEDESMA 274 Figure 7. Deducing the algebraic expressions extracted from the data. Figure 8. Images of the simulation that make it possible to see, though the repre- sentation registers, how the volume of the box changes based on the thickness of a sheet of metal. the graphs made it possible to see that the functions have maximums and minimums, and they recognized that those points represent the values requested in the solution of the problem. It is important to point out that some problems that appear in the simulations were proposed without them to another students group. Figure 9. The figure shows the table filled in with the data obtained, as well as the maximum point on the grap h. In general students had many difficulties to visualize for ex- ample that the volume in the box changes because many student thought that as in the problem only few dimensions of the ma- terial for the construction of the box were given so that there was no way other boxes with different volumes could exist and only one box could be built, that indicated that they were con- fusing area with volume. Besides that when the simulations were used the student was able to visualize that when having different values for “x” the algebraic function changed and the change was notorious in the graphic. What is in separated way in the blackboard. Answering the Research Questions Will detection of the obstacles that hamper learning among students, such as breaking away from the modes of thought that are typical of algebraic functioning, and of the difficulties re- lated to symbolic language and graphical signification of a concept contribute to a comprehension of the concept of func- tion and of optimization and its use in the academic subject of calculus? Study findings indicate that one of the obstacles that hinders student learning is the scarce use of learning strategies. By working with problems within a context and having the support of technology, in this case simulations, the professors were able to realize that several learning strategies exist for students, particularly the constructivist learning strategies. Thus by detecting their existence a whole range of possibilities opens for students to be able to make sense of their work and stop working mechanically, solely with the use of formulae. Is the use of tools that enable professors to organize their teaching activities and manage student learning, as well as carry out course planning by conjugating topics of study, professor time management, didactic matters, forms of evaluation, a strategy that will enable professors to contribute to enhancing the quality of engineers? Use of problem-based simulations within a context enabled the professors to have an alternative landscape and to consider class planning as an essential aspect.  E. F. R. LEDESMA 275 Use of other learning strategies has the number one goal of fueling thought processes concerning the practice, turning them into systematic processes. Another goal is to promote incur- poration of concepts derived from the Didactic. In order to improve the quality of teaching offered. The mode of work is based on the following: determining the class problem, design- ing the didactic actions, preparing materials, application and observation, analysis and visualization of conflicts. Professors in the sample subscribe to the idea of developing varied and multiple didactic actions aimed at promoting learn- ing that have a greater degree of signification. The methodo- logical eclecticism proposed makes it possible to formulate different actions that are able to meet the needs of each working group. Conclusion In view of the freedom of lecture, the manners in which pro- fessors teach have to do with their beliefs. Generally the man- ner of teaching at the level of high school and higher education at the IPN is by presenting the theory, algorithm procedures, solution of exercises and problems, practice using graph calcu- lators, some verification work, but without getting into demon- strations. And all of this is, of course, to the extent that the pro- fessors feel that their students need those tasks. The epistemological approach (disciplinary knowledge) of the course should make it possible to integrate prior structured learning from academic periods at the high school and higher education levels, so that they can be recovered at this level. The objective of the foregoing would be to significantly deal with the concept of variation, including its different techniques, pro- cedures and applications at a level of conceptual depth that makes it possible to raise and solve problems in context, prob- lems that involve important use of algebraic functions as well as the derivatives of those functions. Engineers take on the tasks of designing and building. And this is why, at the beginning, drawings, graphs and diagrams were a resource inherent in their work. In our training of engi- neers, use of geometry must be recovered so that the level of visualization they achieve will enable them to develop projects expeditiously. References Arcavi, A., & Hadas, N. (2002). Computer mediated learning: An ex- ample of an approach. In F. Hitt (Ed.), Representations and mathe- matics visualization. International Group for the Psychology of Mathematics Education North American Chapter and Cinvestav-IPN. México. Duval, R. (1998). Registros de representación semiótica y funciona- miento cognitivo del pensamiento. In: F. Hitt (Ed.), Investigaciones en matemática educativa II. Grupo Editorial Iberoamérica, 5, 101- 120. Hitt, F. (2003). The role of the external representations in the construc- tions of mathematical concepts. L’educazione Matematica, 5, 205- 227. Hitt, F. (2002a) Representations and mathematics visualization. Inter- national Group for the Psychology of Mathematics Education North American Chapter and Cinvestav-IPN. México. Hitt, F. (2002b). Funciones en contexto. México: Pearson Educación (Prentice Hall). Hitt, F. (1994). Teachers’ difficulties with the construction of continu- ous and discontinuous functions. Focus on Learning Problems in Mathematics, 16, 10-20. Plan y Programa de Estudios Cálculo A pl i ca d o 2 0 0 9 ESCOM. IPN. Ruiz, E. F. (2010). Estrategias didácticas en la enseñanza del cálculo diferencial e integral en ingeniería. Reporte técnico de proyecto de investigación registrado en la Secretaría de Investigación y Posgrado (SIP), del IPN con núm. de registro CGPI 20100398, México, IPN. Ruiz, E. F. (2011). Indicadores teóricos para la constricción de conceptos del cálculo diferencial. Proyecto de investigación registrado en la Secretaría de Investigación y Posgrado (SIP), del IPN con núm. de registro CGPI 2011 0343 . México, IPN. |