L. L. Zhao et al. / J. Biomedical Science and Engineering 2 (2009) 363-365 365
SciRes Copyright © 2009
RPE cells, the outer segment at top may be disarranged,
but the pillar-like shape can be observed (Figure 2(a)).
When focusing the imaging plane slightly into the
specimen, we can see the rod is aligned annularly,
round in shape and 2 µm in diameter (Figure 2(b)) and
the center is dark. With focusing the objective further
into the specimen, the autofluorescence of cone outer
segment, which locates in the center, can be detected,
and the size of the cones is becoming larger and larger
(Figure 2(c) and Figure 2(d)), whereas the autofluo-
rescence of rod outer segment weakens.
excitation is quadratically dependent on the intensity, it
is susceptible to photondamage at the focal point. In our
work, the structure and properties of procine eyes are
very similar to human eyes, so the laser power on the
sample is limited to the order of mW (3-4mW), which
accords with ANSI about laser safety criteria for human
eye. Moreover, this in vitro autofluorescence imaging of
photoreceptors can give much detailed structural and
functional information at high spatial resolution, which
can help to more clearly understand the in vivo ocular
fundus autofluorescence images obtained by confocal
scanning laser ophthalmoscopy. And also, two photon
excitation is IR illumination, which can penetrate the
anterior segment of eyes, such as cornea and lens, and
get the whole autofluorescence characteristics of the
living retina, and eliminate the autofluorescence inter-
ference of the anterior segment of eyes by tightly focus
without confocal pinhole. Thus, in vitro autofluores-
cence imaging of photoreceptors using two photon exci-
tation can provide a clue and develop a two-photon laser
scanning ophthalmoscope for in vivo living retina imag-
ing. Although much research remains to be done, it ap-
pears that this technique has great potential to bridge the
gap between clinical examination and invasive biopsy
and thus facilitate the early detection and diagnosis of
ocular diseases. The distribution and intensity of auto-
fluorescence may provide an insight into the sequence of
events that leads to retinal damage and may help eluci-
date pathological mechanisms.
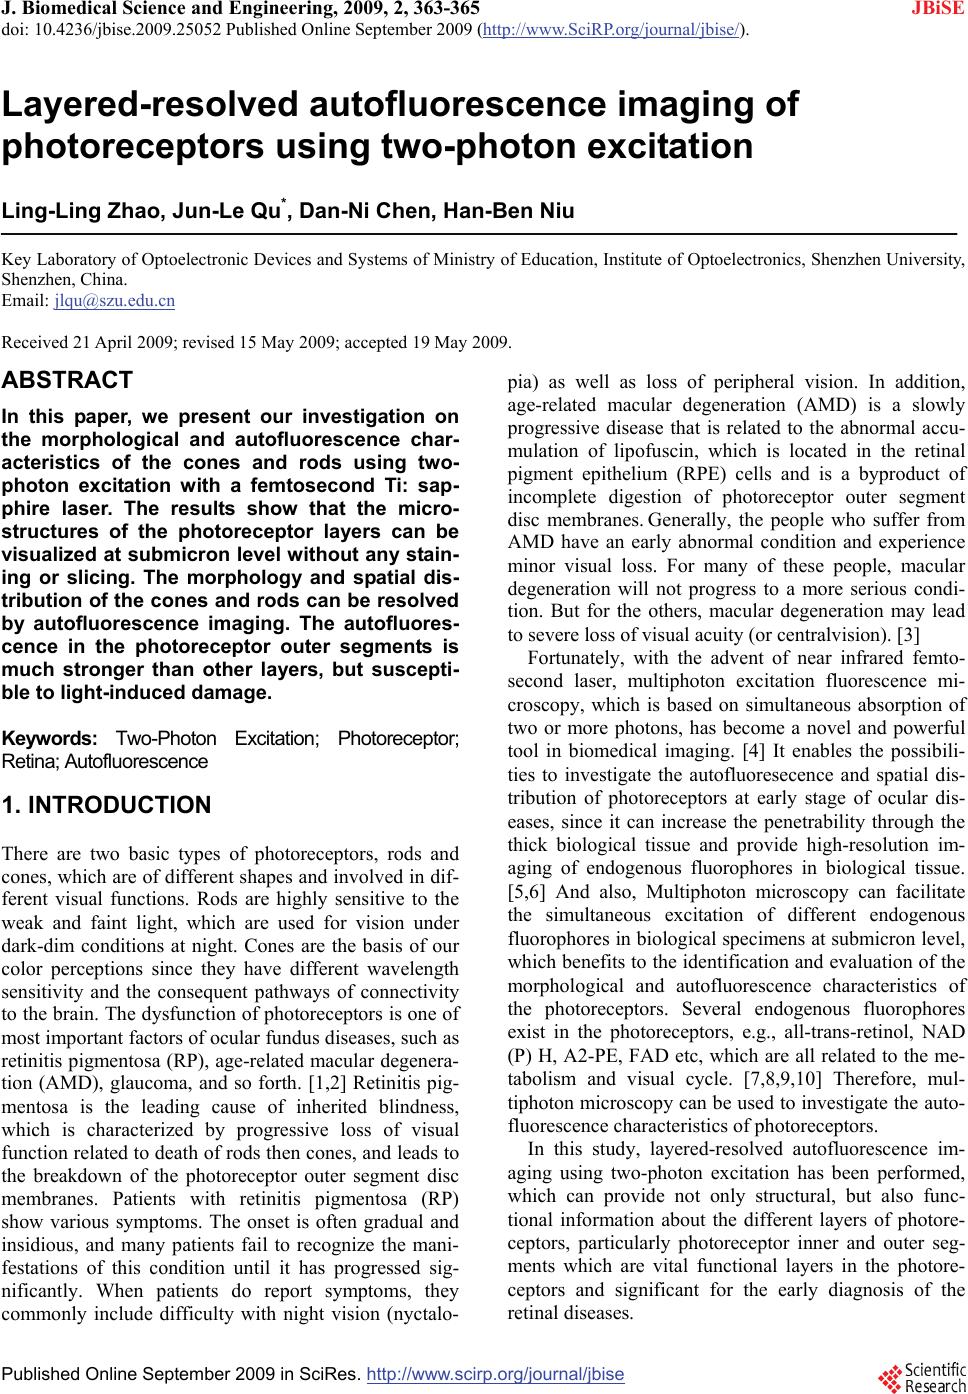
Figure 3 shows the autofluorescence image of photo-
receptor inner segment. The bigger cell is corresponding
to the cone inner segment whose diameter is around 6
µm. Rod inner segment is around the cone and the di-
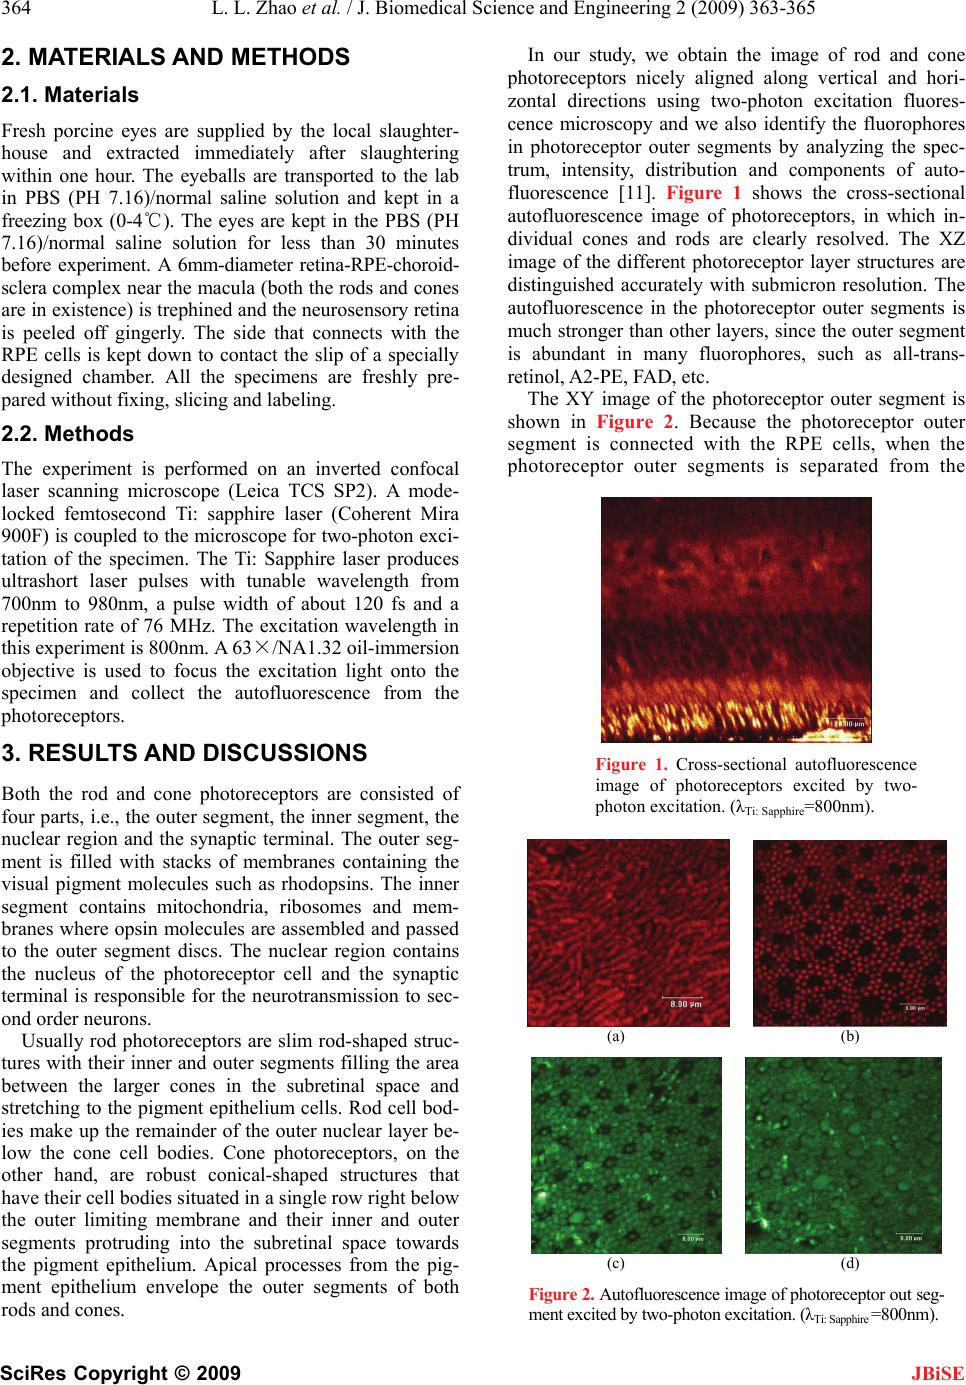
ameter is about 2µm. Figure 4 is the autofluorescence
image of photoreceptor nuclear region, which contains
the nucleus of the photoreceptor cell.
4. CONCLUSIONS
Our results demonstrate, for the first time, that morpho-
logical and autofluorescence characteristics of different
layers of photoreceptors can be identified by autofluo-
rescence imaging using two-photon excitation. Since the
cross section of two photon excitation is much smaller
than that of single photon excitation, and two photon
5. ACKNOWLEDGMENTS
This work is supported by the National Natural Science Foundation of
China (NSFC) under contract No. 60627003 and No. 60408011, and is
also supported in part by Guangdong Natural Science Foundation grant
No. 5010500.
REFERENCES
[1] Jiangang, G. and Kyeongmi, C., (2002) PNAS, 99(8),
5698.
[2] Kayatz, P., Thumann, G., Luther, T. T., et al., (2001)
Invest. Ophthalmol. Vis. Sci., 42, 241.
Figure 3. Autofluorescence image of pho-
toreceptor inner segment. [3] Hopkins, J., Walsh, A. and Chakravarthy, U., (2006)
Invest. Ophthalmol. Vis. Sci., 47, 2269.
[4] Brakenhoff, G. J., Squier, J., Norris, T. and Blito, A. C.,
(1996) J. Microsc., 181, 253.
[5] Denk, W., Strickler, J. H., (1990) Science, 248, 73.
[6] Han, M. and Giese, G., (2007) Journal of Biomedical
Optics, 12(2), 024012.
[7] Chunhe, C., (2005) Biophysical Journal, 88, 2278.
[8] Kim, S. R. and Nakanishi, K., (2006) Experimental Eye
Research, 82, 828.
[9] Laura, L. E. and John, S. D., (2004) Photochemistry and
Photobiology, 79(2), 127.
[10] Schweitzer, D., Schenke, S., and Hammer, M., (2007)
Microscopy Research and Technique, 70, 410.
(a) (b)
Figure 4. Autofluorescence image of cone nuclear region (a)
and rod nuclear region (b), excited by wo-photon excitation
(λTi: Sapphire=800nm).
[11] Zhao, L., Qu J., and Niu, H., (2007) Proc. SPIE, 6826,
682614.
JBiSE