N. Miyatake et al. / Health 3 (2011) 498-503
Copyright © 2011 SciRes. http://www.scirp.org/journal/HEALTH/
502
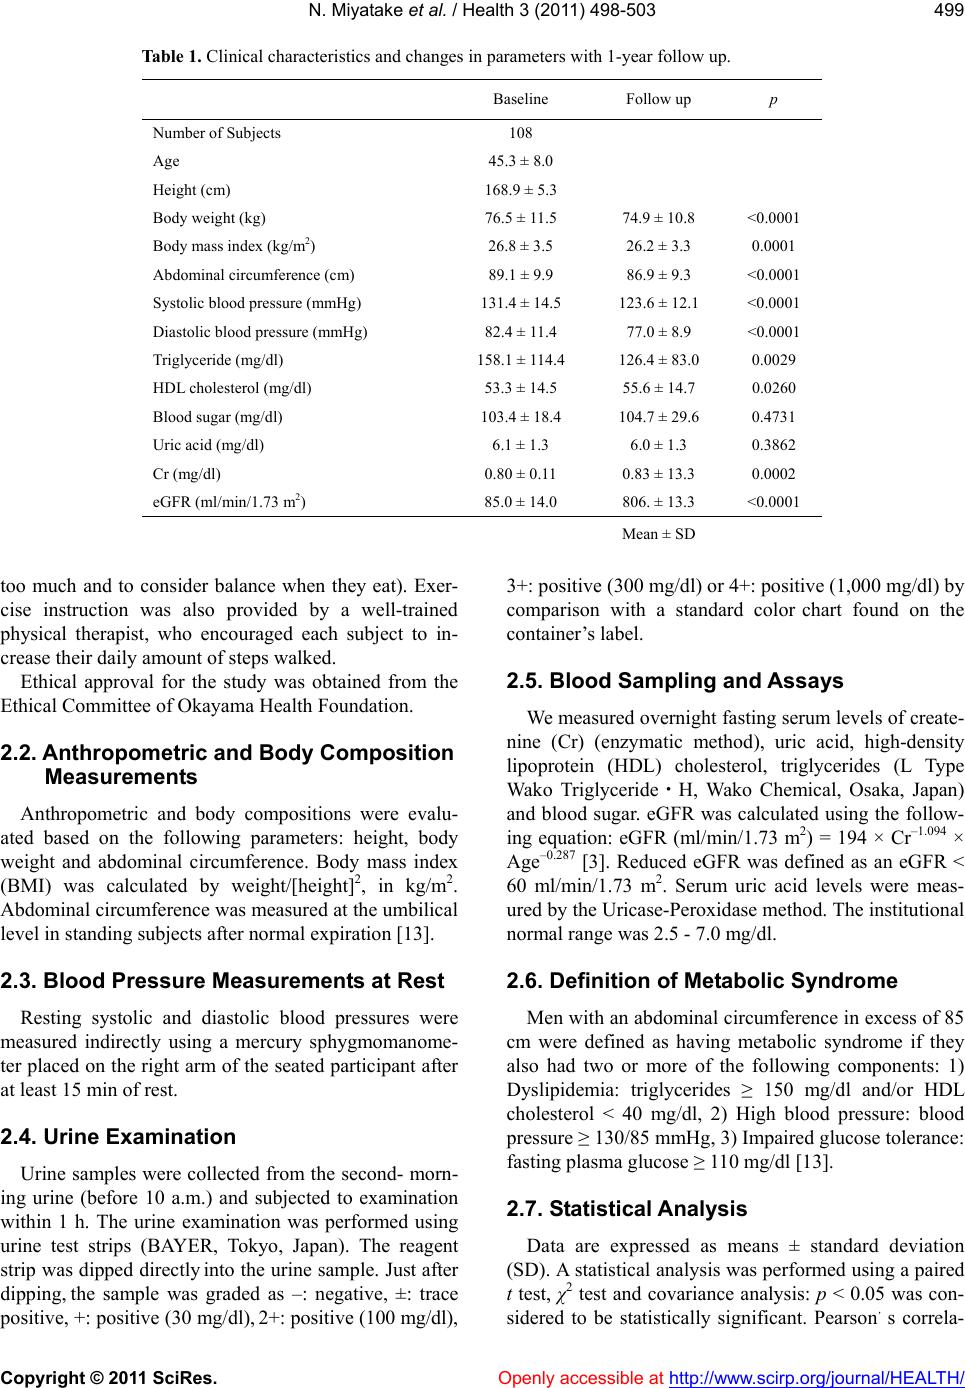
subjects was diagnosed as having metabolic syndrome,
using the Japanese criteria, at baseline and seventeen
subjects were diagnosed as having metabolic syndrome
at the 1-year follow up. We have previously reported that
the prevalence of metabolic syndrome was 30.7% in
Japanese men [18]. In this study, with lifestyle modifica-
tion after the initial health check-up, metabolic compo-
nents were significantly improved in men without medi-
cations at the one year follow-up. Although eGFR and
serum uric acid levels were not improved after one year,
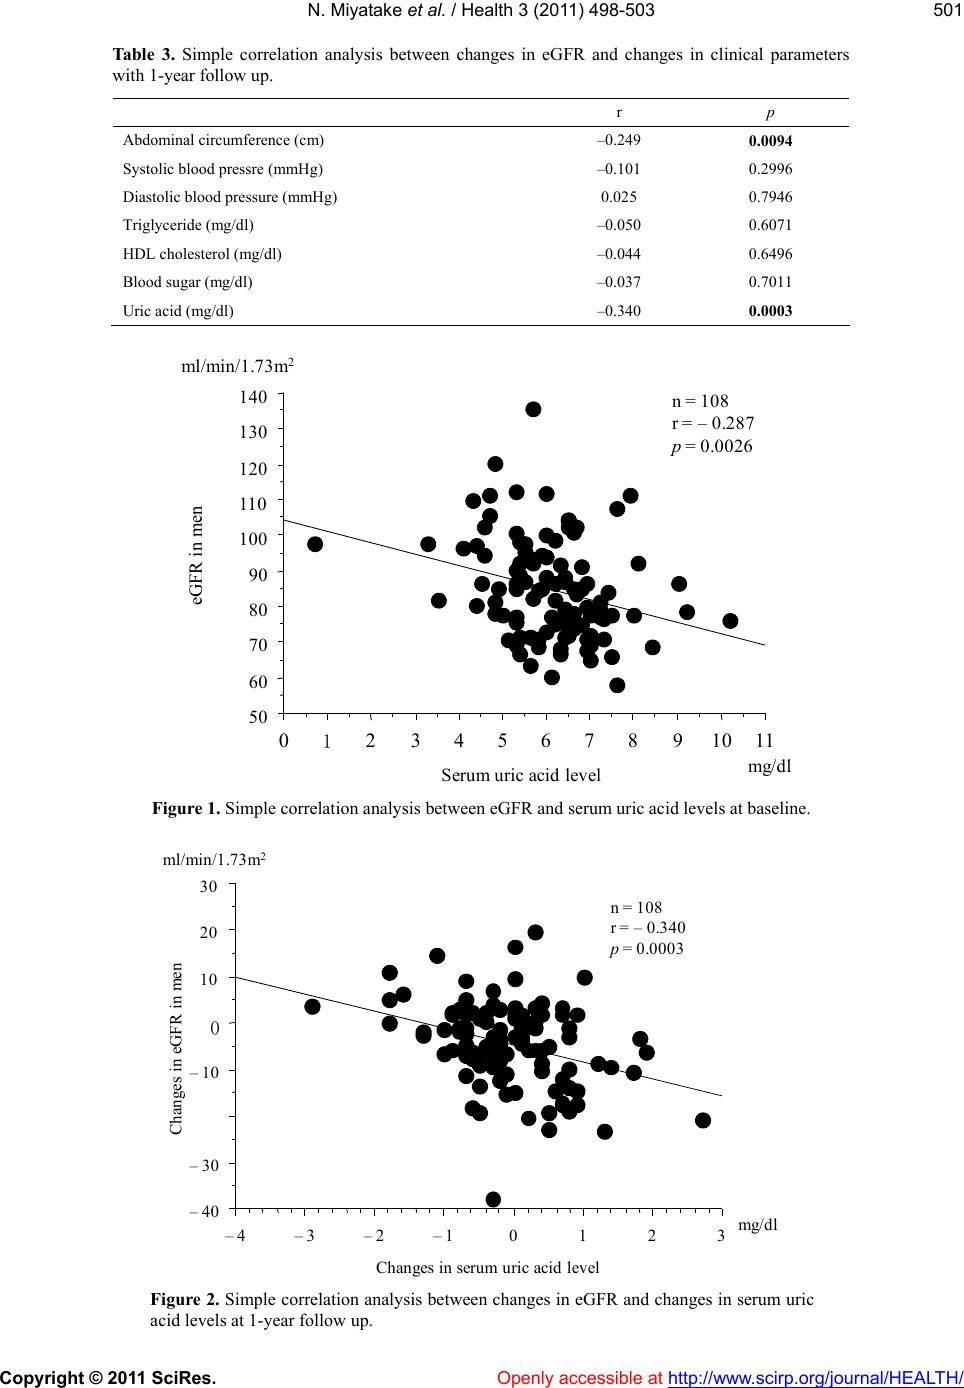
changes in eGFR were negatively correlated with changes
in serum uric acid levels. Taken together, reducing serum
uric acid levels such as medications may be useful for
improving eGFR in Japanese men.
Openly accessible at
Higher serum uric acid levels contribute to the devel-
opment of renal injury and end-stage renal disease [7-12].
Satirapoj B et al. reported in a cross-sectional study that
high serum uric acid level was independently associated
with increased prevalence of CKD in 5546 Southeast
Asian population [7]. The age-adjusted odds ration for
CKD, with subjects with no hyperuricemia and no meta-
bolic syndrome, was 5.85 for subjects with both hyperu-
ricemia and metabolic syndrome [8]. Yen CJ et al. also
showed that serum uric acid levels were associated with
eGFR and decline in renal function in elderly Taiwanese
subjects by longitudinal analysis [9]. In Japanese, hype-
ruricemia, hypercholesterolemia and diabetes are risk
factors for CKD in peripheral arterial disease [19]. In the
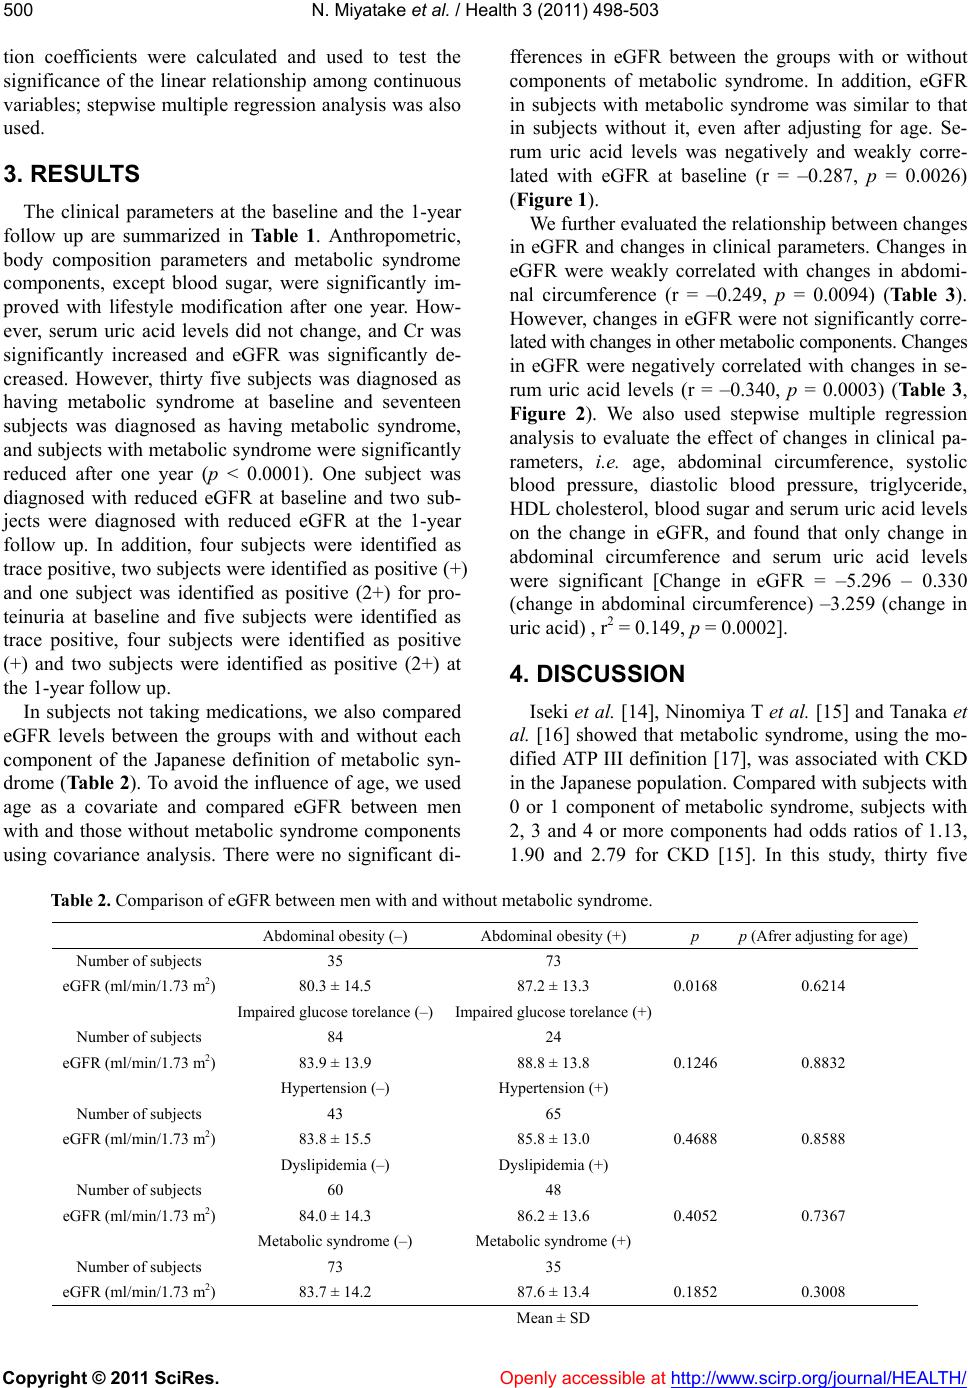
present study, there was weak relationship between
eGFR and serum uric acid levels at baseline. In addition,
we revealed that, changes in serum uric acid levels were
correlated with changes in eGFR in men without medi-
cations. Changes in other metabolic components, except
abdominal circumference, were not linked to changes in
eGFR. Therefore, the clinical impact of serum uric acid
levels on eGFR was noted in Japanese men.
Potential limitations remain in our study. First, the
small sample size in our study makes it difficult to infer
causality between eGFR and serum uric acid levels. In
addition, eGFR and serum uric acid levels were not in-
creased with lifestyle modification after one year. Sec-
ond, we also could not reveal the mechanism of the lin-
kage between eGFR and serum uric acid levels. Third,
most of the enrolled subjects were not diagnosed as
CKD at baseline. Therefore, the results in this study may
not apply for patients with CKD. Further prospective
studies using medications are needed in Japanese sub-
jects.
5. ACKNOWLEDGEMENTS
This research was supported in part by Health and Labor Sciences
Research Grants from the Ministry of Health, Labor and Welfare,
Japan.
REFERENCES
[1] National Kidney Foundation (2002) K/DOQI clinical
practice guidelines for chronic kidney disease: Evalua-
tion, classification, and stratification. Kidney disease
outcome quality initiative. American Journal of Kidney
Diseases, 39, S1-S266.
[2] Imai, E., Horio, M., Iseki, K., et al. (2007) Prevalence of
chronic kidney disease (CKD) in the Japanese general
population predicted by the MDRD equation modified by
a Japanese coefficient. Clinical and Experimental Ne-
phrology, 11, 156-163. doi:10.1007/s10157-007-0463-x
[3] Matsuo, S., Imai, E., Horio, M., et al. (2009) Revised
equations for estimated GFR from serum creatinine in
Japan. American Journal of Kidney Diseases, 53, 982-
992. doi:10.1053/j.ajkd.2008.12.034
[4] Miyatake, N., Shikata, K., Makino, H. and Numata, T.
(2010) Relationship between estimated glomerular filtra-
tion rate (eGFR) and metabolic syndrome in the Japanese
population. Acta Medica Okayama, 64, 203-208.
[5] Miyatake, N., Shikata, K., Makino, H. and Numata, T.
(2011) Decreasing abdominal circumference is associated
with improving estimated glomerular filtration rate (e-
GFR) with lifestyle modification in Japanese men: A pi-
lot study. Acta Medica Okayama, in press.
[6] Miyatake, N., Shikata, K., Makino, H. and Numata, T.
(2010) Decreasing systolic blood pressure is associated
with improving estimated glomerular filtration rate
(eGFR) with lifestyle modification in healthy Japanese
women. Acta Medica Okayama, 64, 253-258.
[7] Satirapoj, B., Supasyndh, O., Chaiprasert, A., et al. (2010)
Relationship between serum uric acid levels with chronic
kidney disease in a Southeaset Asian population. Ne-
phrology (Carlton), 15, 253-258.
doi:10.1111/j.1440-1797.2009.01179.x
[8] See, L.C., Kuo, C.F., Chang, F.H., et al. (2011) Hyperu-
ricemia and metabolic syndrome: Associations with
chronic kidney disease. Clinical Rheumatology, 30, 323-
330. doi:10.1007/s10067-010-1461-z
[9] Yen, C.J., Chiang, C.K., Ho, L.C., et al. (2009) Hyperu-
ricemia associated with rapid renal function decline in
elderly Taiwanese subjects. Journal of the Formosan
Medical Association, 108, 921-928.
doi:10.1016/S0929-6646(10)60004-6
[10] Cain, L., Shankar, A., Ducatman, A.M. and Steenland, K.
(2010) The relationship between serum uric acid and
chronic kidney disease among Appalachian adults. Ne-
phrology Dialysis Transplantation, 25, 3593-3599.
doi:10.1093/ndt/gfq262
[11] Madero, M., Sarnak, M.J., Wang, X., et al. (2009) Uric
acid and long-term outcomes in CKD. American Journal
of Kidney Diseases, 53, 796-803.
doi:10.1053/j.ajkd.2008.12.021
[12] Sturm, G., Kollerits, B., Neyer, U., et al. (2008) MMKD
study group: Uric acid as a risk factor for progression of
non-diabetic chronic kidney disease? The mild to moder-
ate kidney disease (MMKD) study. Experimental Geron-
tology, 43, 347-352. doi:10.1016/j.exger.2008.01.006
[13] Anonym (2005) Definition and the diagnostic standard