Vol.2, No.3, 375-381 (2011)
doi:10.4236/as.2011.23049
Copyright © 2011 SciRes. Openly accessible at http://www.scirp.org/journal/AS/
Agricultural Sciences
Chemical properties during different development
stages of fruit orchards in the mekong delta (Vietnam)
Pham van Quang1, Vo thi Guong2
1Department of Soil Science and Natural Resources, Faculty of Agriculture and Natural Resources, An Giang University,
Long Xuyên; Vietnam; Corresponding Author: phamvq@kth.se
2Department of Soil Science and Natural Resources, Agriculture and Applied Biology College, Can Tho University,
Can Tho, Vietnam, Corresponding Author: vtguong@ctu.edu.vn
Received 1 July2011; revised 28 July 2011; accepted 6 August 2011.
ABSTRACT
This study to examine soil fertility status was
conducted on 10 citrus plantations in Hau Giang
province within the Vietnamese Mekong Delta,
Vietnam. Fruit trees are mostly grown on the
raised beds to avoid annual flood with alluvial
soil type. Soil sampling was done in the dry
season of 2010 at two soil depths, for each
raised bed. Development ages of raised beds
were represented by two groups, young age
group (30 years) and old age group (>30 years).
For chemical analysis, pH, organic matter, CEC,
total nitrogen, 4,
+
NH
3 and exchangeable Ca,
Mg and K were determined. The results showed
that the pH (water) was strongly acid. The CEC
was in average 19.2 cmol·kg–1 in topsoil (0 - 20
cm depth) and 18.7 cmol·kg–1 in subsoil (20 - 50
cm depth) for young age group. Similarly, the
CEC was 16.7 cmol·kg–1 in topsoil and 15.8
cmol·kg–1 in subsoil for old age group. Organic
matter on young age group (7.38% and 5.47% on
average for topsoil and subsoil respectively)
was significantly higher than that of old age
group (5.20% and 3.81% on average for topsoil
and subsoil respectively). Total nitrogen was
not significantly different between the sites for
the age groups of raised as well as the soil lay-
ers. Ammonium-N levels were excessive, and
NO
3-N levels were high. Potassium and Mg2+
were significantly different between age groups
of raised beds and the same pattern between
soil layers, while Ca2+ did not vary significantly.
Potassium and Ca2+ levels were moderate, Mg2+
was high and P levels were very high. Soil fer-
tility in the raised beds subjected to an adverse
on plant growth and an imbalance in soil nutri-
ents under low pH conditions. Loss of soil qual-
ity was exhibited in reduced organic matter with
the aging of raised beds.
NO
Keywords: Citrus Orchards; Soil Properties;
Alluvial Soil; Nutrient Balance; Soil Fertility; Mekong
Delta; Vietnam
1. INTRODUCTION
There are seven major soil types in the Vietnamese
Mekong Delta (MD); those are alluvial, acid sulphate,
saline, saline acid sulphate, old alluvial, peat and moun-
tainous [1,2].
The MD is the main area of fruit production that cov-
ered approximately 285,300 ha by the year 2009 ac-
counting for about 38% of the fruit tree area of Vietnam
[3]. Most of the land used for fruit trees in the MD is
lowland alluvial plain; therefore, raised beds are com-
monly constructed to avoid annual flooding. The raised
beds are long raised soil trips that are higher than the
original ground surface by piling up soil materials and
excavating from adjacent lateral ditches. The ages of
raised beds are also widely different which lots of them
have lasted more than 30 years old. Soil layers on the
raised beds are commonly arranged in reverse or the
same order as natural soil. Thus, the soil is disturbed by
the effect of human activities. With time, the soil may
have changed under influence of physical and natural
conditions as well as management practices. Soil degra-
dation is considered as a subsequent limitation on plant
growth. Major reasons of soil degradation are compac-
tion, loss of organic matter, salinization, nutrient deple-
tion and pollution [4,5]. Degradation of top soils may be
easily resilient, whereas degradation of sub soils is much
more difficult to restore and the degradation may even
be permanent [6].
A record from this investigation was that the plant
productivity has decreased as from the third or the fourth
P. van Quang et al. / Agricultural Science 2 (2011) 375-381
Copyright © 2011 SciRes. Openly accessible at http://www.scirp.org/journal/AS/
376
harvests due to young fruit drop and root rot. Many
growers had to plant/sow new seeds into their soil. In
some cases, they also had to introduce new soil below
the stumps but this did not improve the situations either.
A hypothesis can be raised related to soil degradation on
fruit plantations that the old raised beds may expose
more adverse restrictions to plant growth than the young
ones. Additionally, there are many factors, which may
cause the decrease in soil productivity, such as natural
conditions and soil tillage. Although soil is a major
source of nutrients that plants need to grow, the compo-
sition of fertilizer supplement is also necessary in return
for the losses by plant uptake. Studies on soil chemical
fertilizers, plants and their relationship were performed
to recommend various formulations of NPK fertilizers
by Phong et al. [7], Chau [8] and Hau [9], and these
have helped fruit growers achieve balanced fertilization.
However, the formulations of fertilizer application may
be out of date if they are not periodically updated based
on the nature of the soil in the field. Nutrient deficien-
cies and/or excesses have an adverse effect on plant
growth and resulting plant yields. High concentrations of
one nutritious substance in soil may cause imbalances or
deficiencies of other elements [10].
A problem is that most of the land growing fruit plan-
tation in the MD has acid soils with a low level of cal-
cium (Ca2+), magnesium (Mg2+), and high levels of iron
(Fe3+) and free aluminum (Al3+). Due to these character-
istics, phosphate is fixed in less available forms [10].
The fixation of phosphate and potassium may be severe
in some soils with a high clay content [11 ,12]. The acid-
ity and salinity effects of fertilizers are important con-
siderations in the selection and application of fertilizers
[13]. In addition, the fertilization habits of growers in the
MD often use a single rather than compound fertilizer,
which stress the use of nitrogen while phosphorus, po-
tassium, lime and micronutrients are less appropriately
considered.
The objectives of this paper were to 1) assess the soil
fertility by measuring pH, organic matter, CEC, total
nitrogen, 4
NH
, 3
NO
and exchangeable Ca, Mg and K;
2) compare different ages of the raised beds to see if they
differ in soil fertility; 3) identify possible nutrient im-
balances.
2. MATERIALS AND METHODS
2.1. Site Description
This study was conducted on 10 selected citrus plan-
tations in Hau Giang province, Mekong Delta, Vietnam
with different ages (Figure 1). The plantations were di-
vided into two main categories based on age: young age
group: less than 30 years of age (normally 10 - 30 years),
n = 4, and old age group: more than 30 years, n = 6 (Ta-
ble 1). The soil was classified as alluvial soil [14, 15].
Figure 1. (a) Provincial Administrative Boundary Map of the Mekong Delta, (b) Map of Hau Giang Province, (c) Studied Sites
MapExtracted from Google Earth.
P. van Quang et al. / Agricultural Science 2 (2011) 375-381
Copyright © 2011 SciRes. Openly accessible at http://www.scirp.org/journal/AS/
377377
Ta b le 1. The ten study locations selected in Hau Giang prov-
ince, Mekong Delta, Vietnam.
Locations Latitude Longitude Construction year
1 9˚5344.38 105˚4341.09 1995
2 9˚5328 105˚4357.14 1993
3 9˚5335.74 105˚4347.75 1991
4 9˚5331.7 105˚4342.78 1980
5 9˚5328 105˚4329.46 1979
6 9˚5335.7 105˚4341.27 1978
7 9˚5329.18 105˚4350.7 1978
8 9˚5338.47 105˚4345.34 1977
9 9˚542.7 105˚4349.4 Prior 1975
10 9˚5329.22 105˚4341.16 Prior 1975
the year that raised beds were established
This study was conducted on 10 selected citrus plan-
tations in Hau Giang province, Mekong Delta, Vietnam
with different ages (Figure 1). The plantations were di-
vided into two main categories based on age: young age
group: less than 30 years of age (normally 10 - 30 years),
n = 4, and old age group: more than 30 years, n = 6 (Ta-
ble 1). The soil was classified as alluvial soil [14,15].
The climate is characterized by two distinct seasons, a
dry season from January to April and a rainy season
from May to December. The annual rainfall ranges from
less than 1000 mm to over 1300 mm, however most of
the rain (90%) falls during the rainy season. The mean
temperature ranges from 23 - 25˚C during the coldest
months to 32 - 33˚C during the warmest months. The
humidity is highest in September (91%), and the lowest
in the dry season (79% - 82%).
The data was collected in the beginning of the dry
season, January 2010. Soil samples were taken from
each of the raised beds for chemical analyses at 0 - 20
cm and 20 - 50 cm depth with 4 replications at each site
and about 4 kg for each layer.
2.2. Soil Analysis
Soil samples were air-dried, homogenized and sieved
through a 2mm mesh screen to determine soil chemical
properties including pH, organic matter, CEC, total ni-
trogen, 4
N
H, 3
N
O and exchangeable Ca2+, Mg2+ and
K+.
pH was measured in water at 1:2.5 soil:water ratio.
Organic carbon was determined by the Walkley and
Black method [16] with the correction factor of 1.33
(recovery of 75%). The percent of soil organic matter
was calculated by multiplying the percent organic car-
bon by a factor of 1.724, following the standard practice
that organic matter is composed of 58% carbon [17].
Cation Exchange Capacity was determined by the bar-
ium chloride method. Total nitrogen was analyzed using
the Macro Kjeldahl method, where the soil sample is
digested by sulphuric-salicylic acid with a catalyst, and
titrated by volumetry with 0.1N H2SO4. The available
phosphorous of the soil was extracted according to Bray-
2 method and the concentration was then determined
colorimetrically [18]. The exchangeable cations Ca2+,
Mg2+, K+ and Na+ were extracted with BaCl2 and ana-
lysed by flame atomic absorption spectrometer. Inorganic
N (3
N
O
and 4
N
H
) was extracted with 2 M KCl fol-
lowed by determination according to standard colorimet-
ric pro- cedures.
Statistical analyses were performed using SPSS soft-
ware. One-way ANOVA with four treatments were per-
formed using a 5% significance level. The treatments
included:
Topsoil: 0 - 20 cm depth and young age group of
raised beds: 10 - 30 years old;
Subsoil: 20 - 50 cm depth and young age group of
raised beds: 10 - 30 years old;
Topsoil: 0 - 20 cm depth and old age group of raised
beds: >30 years old;
Subsoil: 20 - 50 cm depth and old age group of raised
beds: >30 years old.
3. RESULTS AND DISCUSSIONS
3.1. Soil pH (Water 1:2.5)
The results of soil pH showed that the pH was higher
in the young raised beds compared to the old raised beds
and the same pattern for soil layers (Tables 2 and 3).
However, there were no significant differences between
the two age groups of raised beds as well as between soil
layers for the young age group, while the pH was sig-
nificantly different between topsoil and subsoil for the
old age group.
The low pH may be caused by some factors such as
plant uptake of base cations, nutrition leaching, accumu-
lation of hydrogen ion (H+) and unbalanced fertilizer
Table 2. Soil pH (water), cation exchange capacity (CEC) and
organic matter of young-group and old-group of raised beds for
0 - 20 cm depth.
Group Site pH-water
(1:2.5)
CEC
(cmol·kg–1)
Organic matter
(%)
1 4.71 22.07 12.19
2 4.44 20.02 5.18
3 4.35 19.23 6.61
Young
4 4.24 15.59 5.54
Means4.43 19.23* 7.38*
5 4.43 17.37 4.45
6 4.36 14.87 4.57
7 4.35 18.73 4.46
8 4.49 16.78 4.36
9 4.21 16.17 4.53
Old
10 3.93 16.35 8.81
Means4.29 16.71* 5.20*
*The mean difference is significant at the 0.05 level between age group;
The mean difference is significant at the 0.05 level between soil layers for
young age group; The mean difference is significant at the 0.05 between
soil layers for old age group.
P. van Quang et al. / Agricultural Science 2 (2011) 375-381
Copyright © 2011 SciRes. Openly accessible at http://www.scirp.org/journal/AS/
378
Table 3. Soil pH (water), Cation Exchange Capacity (CEC)
and Organic Matter of Young-group and Old-group of Raised
Beds for 20 – 50 cm Depth.
Group Site pH-water
(1:2.5)
CEC
(cmol·kg–1)
Organic matter
(%)
1 5.11 21.60 9.59
2 4.89 20.40 3.55
3 4.52 17.70 4.34
Young
4 4.13 15.15 4.38
Means 4.67 18.71* 5.47*
5 4.80 16.27 3.41
6 4.55 14.18 3.25
7 4.58 18.07 3.11
8 4.70 15.71 2.99
9 4.27 14.93 3.65
Old
10 4.23 15.74 6.47
Means 4.52 15.82* 3.81*
*The mean difference is significant at the 0.05 level between age group;
The mean difference is significant at the 0.05 level between soil layers for
young age group; The mean difference is significant at the 0.05 between
soil layers for old age group.
supply. The range of soil pH for citrus growth is between
5.5 and 8.0, however, the best soil pH for citrus planta-
tion is between 5.5 and 6.5 [19]. When the pH falls be-
low 5.0, it can lead to aluminum toxicity and manganese
toxicity in root zone. A low pH condition can also cause
a deficiency of nutrients such as calcium, magnesium,
phosphorus, and molybdenum [20]. Decreasing soil pH
can also cause decline of the mineralization and nitrifi-
cation [21,22]. Soil pH at all sites was rated as strongly
acid [23], therefore, deficiency of major plant nutrients
such as calcium, magnesium, nitrogen and phosphorus
may occur. In the low range of soil pH, the adsorbed H+
and Al3+ may predominate the cation exchange capacity.
3.2. Cation Exchange Capacity (CEC)
Cation exchange capacity (CEC) in the two groups of
raised beds is shown in Tab les 2 and 3 for topsoil and
subsoil. The CEC of the old age group was significantly
lower than that of the young age group, while there were
no significant differences between topsoil and subsoil
for both age groups.
Cation exchange capacity of a soil refers to the amount
of positively charge ions that a soil can retain. When a
soil becomes more acidic the base cations are replaced
by H+, Al3+ and Mn2+ and this also produce higher CEC
values [24]. The higher the CEC, the more amounts of
nutrients the soil is able to supply [24]. The CEC of the
soil depends on the kind of clay, organic matter content,
pH and soil formation. The CEC of all study sites was
ranked as moderate [25], this may indicate the restriction
of soil nutrients to plants. However, the aging of raised
beds is also an important factor. Because decreases in
soil pH and organic matter with the aging of raised beds
may contribute to the decrease in negatively charge
components and this may then reduce nutrient holding
capacity of the soil.
3.3 Organic matter
Organic matter content for the young age group (7.4%
and 5.5% on average for topsoil and subsoil respectively)
was significantly higher than that of the old age group
(5.2% and 3.8% on average for topsoil and subsoil re-
spectively). The topsoil contained more organic matter
than the subsoil in both age groups (Tables 2 and 3). The
results showed that the amount of organic matter was
remarkably high for site 1 and site 10 compared to the
others. For site 1, the raised bed was built up on low
landform and there had existed a humus layer in the soil
profile with many decayed and semi-decayed materials
from 0.5 to 2 m depth. Because of the raised bed con-
struction, part of the humus layer below was brought to
the surface; this was probably a reason for the higher
organic matter content of site 1. For site 10, rather good
management practices of the owner’s raised bed garden
were executed by returning the residual materials of
plant or vegetation into the soil.
Organic matter play a crucial role in soil fertility,
buffering capacity, water holding capacity and stabiliza-
tion of soil structure [10,26].
3.4. Exchangeable Cations
Tab les 4 and 5 show the mean values for exchange-
able cations (K+, Na+, Mg2+ and Ca2+) between different
ages of raised beds and between soil layers.
The results showed that the concentrations of K+ and
Mg2+ were significantly lower for the old age group,
while it was not significantly different for Ca2+ (Tables 4
and 5). The base cations concentrations were higher in
Ta ble 4. Exchangeable cations of young-group and old-group
of raised beds for 0 - 20 cm depth.
K+ Mg2+ Ca2+
GroupSite (cmol·kg–1)
1 0.46 3.45 9.85
2 0.53 5.02 6.99
3 0.81 3.20 7.72
Young
4 0.26 2.52 5.24
Means 0.52*† 3.55* 7.45
% CEC 2.65 18.38 38.33
5 0.24 2.94 8.00
6 0.27 2.75 6.42
7 0.33 2.62 6.90
8 0.40 3.34 6.76
9 0.33 1.45 4.58
Old
10 0.46 2.81 7.46
Means 0.34*‡ 2.65* 6.69
% CEC 2.03 15.91 40.05
*The mean difference is significant at the 0.05 level between age group;
The mean difference is significant at the 0.05 level between soil layers for
young age group; The mean difference is significant at the 0.05 between
soil layers for old age group.
P. van Quang et al. / Agricultural Science 2 (2011) 375-381
Copyright © 2011 SciRes. Openly accessible at http://www.scirp.org/journal/AS/
379379
Ta ble 5. Exchangeable cations of young-group and old-group
of raised beds for 20 - 50 cm depth.
Group Site K+ Mg2+ Ca2+
1 0.54 3.25 9.69
2 0.33 6.43 5.71
3 0.58 2.66 7.08
Young
4 0.23 2.08 5.06
Means 0.42*† 3.60* 6.89
% CEC 2.23 18.83 36.56
5 0.25 2.52 6.96
6 0.22 2.29 5.99
7 0.29 2.93 6.09
8 0.26 3.17 6.23
9 0.22 1.69 4.41
Old
10 0.34 3.10 6.63
Means 0.26*‡ 2.62* 6.05
% CEC 1.66 16.51 38.34
*The mean difference is significant at the 0.05 level between age group;
The mean difference is significant at the 0.05 level between soil layers for
young age group; The mean difference is significant at the 0.05 between
soil layers for old age group.
topsoil compared to subsoil for within the same age
group as well as for between age groups. The amount of
K+ and Ca2+ was ranked as a moderate level, while Mg2+
was ranked as a high level [27]. The percent base satura-
tion of calcium, magnesium, sodium, and potassium in
the soil may indicate that there was a deficiency and/or
excess in the balance of available nutrients to plants. The
following proportions of the various cations suggested
by Abbott [28] for optimum crop performance are usu-
ally within the following ranges: potassium 1% - 5%,
magnesium 10% - 15%, calcium 65% - 80% and sodium
<2.5%. Based on most efficient range suggested above,
for this study, only exchangeable potassium/CEC (%)
was in a good range, while exchangeable magnesium
/CEC (%) was slightly higher and exchangeable cal-
cium/CEC (%) was rather lower (Ta b l e s 4 and 5). This
indicated that there existed an imbalance of cations in
both young and old age group of raised beds.
3.5. Total Nitrogen, Ammonium and
Exchangeable Nitrate
Total nitrogen varied in the range from 0.14% - 0.27%
in young age group and 0.15% - 0.22% in old age group
for topsoil (Table 6 ), from 0.10% - 0.13% in young age
group and 0.10% - 0.16% in old age group for subsoil
(Ta ble 7). Total nitrogen was not significantly different
between the two age groups, while it was significantly
higher in topsoil compared to subsoil for both age
groups (Tables 6 and 7).
Ammonium concentrations were 21.0 - 32.8 mg·kg–1
in young age group and 14.3 - 37.4 mg·kg–1 in old age
group for topsoil (Ta ble 6). For subsoil, the values are
15.6 - 33.6 mg·kg–1 in young age group and 20.8 - 32.8
mg· k g –1 in old age group (Table 7).
Exchangeable nitrate changed between 27.2 and 64.8
Table 6. Total Nitrogen, Exchangeable Ammonium, Ex-
changeable Nitrate and available P of Young-group and Old-
group of Raised Beds for 0 - 20 cm Depth.
GroupSite Ntotal NH4+ NO3 P
(%) (mg·kg–1)
1 0.2732.10 41.85 26.90
2 0.1421.02 27.18 23.01
3 0.1532.79 64.83 37.64
Young
4 0.1624.39 63.40 24.41
Means0.1827.57 49.31*† 27.99
5 0.2214.31 44.62 31.87
6 0.1525.32 26.38 41.94
7 0.1918.00 24.25 43.21
8 0.1537.44 40.03 16.60
9 0.1928.21 44.81 41.97
Old
10 0.2234.67 33.87 19.78
Means0.1926.32 35.66*‡ 32.56
*The mean difference is significant at the 0.05 level between age group;
The mean difference is significant at the 0.05 level between soil layers for
young age group; The mean difference is significant at the 0.05 between
soil layers for old age group.
Table 7. Total Nitrogen, Exchangeable Ammonium, Ex-
changeable Nitrate and available P of Young-group and Old-
group of Raised Beds for 20 - 50 cm Depth.
GroupSite Ntotal NH4+ NO3 P
(%) (mg·kg–1)
1 0.2033.25 14.63 28.61
2 0.1015.65 15.06 25.75
3 0.1031.76 17.99 21.71
Young
4 0.1318.08 17.12 30.01
Means0.1324.68 16.20 26.52
5 0.1632.84 21.29 18.25
6 0.1120.78 13.37 31.68
7 0.1325.41 19.39 37.22
8 0.1032.61 19.47 24.23
9 0.1622.55 9.37 26.40
Old
10 0.1628.16 13.25 14.64
Means0.1322.18 16.02 25.40
*The mean difference is significant at the 0.05 level between age group;
The mean difference is significant at the 0.05 level between soil layers for
young age group; The mean difference is significant at the 0.05 between
soil layers for old age group.
mg·kg–1 in young age group, between 24.2 - 44.8 mg·kg-1
in old age group for topsoil (Table 6). The values for
subsoil changed between 14.6 - 18.0 mg·kg–1 in young
age group, between 9.4 - 21.3 mg·kg–1 in old age group
(Table 7). The 3
N
O
amount in young age group was
significantly higher than that in old age group for topsoil,
however, for subsoil, there was no significant difference
between the age groups. Furthermore, there was a sig-
nificant difference on NO3
between topsoil and subsoil
for the young age group as well as for the old age group.
Rating according to Bruce and Rayment [23], the soils
of this study were moderate in total nitrogen, high in
organic carbon and in C:N ratio. However, the C:N ratio
was lower in old age group than in young age group.
This indicated that the decomposition process was faster
in old age group; and therefore, there is usually a release
P. van Quang et al. / Agricultural Science 2 (2011) 375-381
Copyright © 2011 SciRes. Openly accessible at http://www.scirp.org/journal/AS/
380
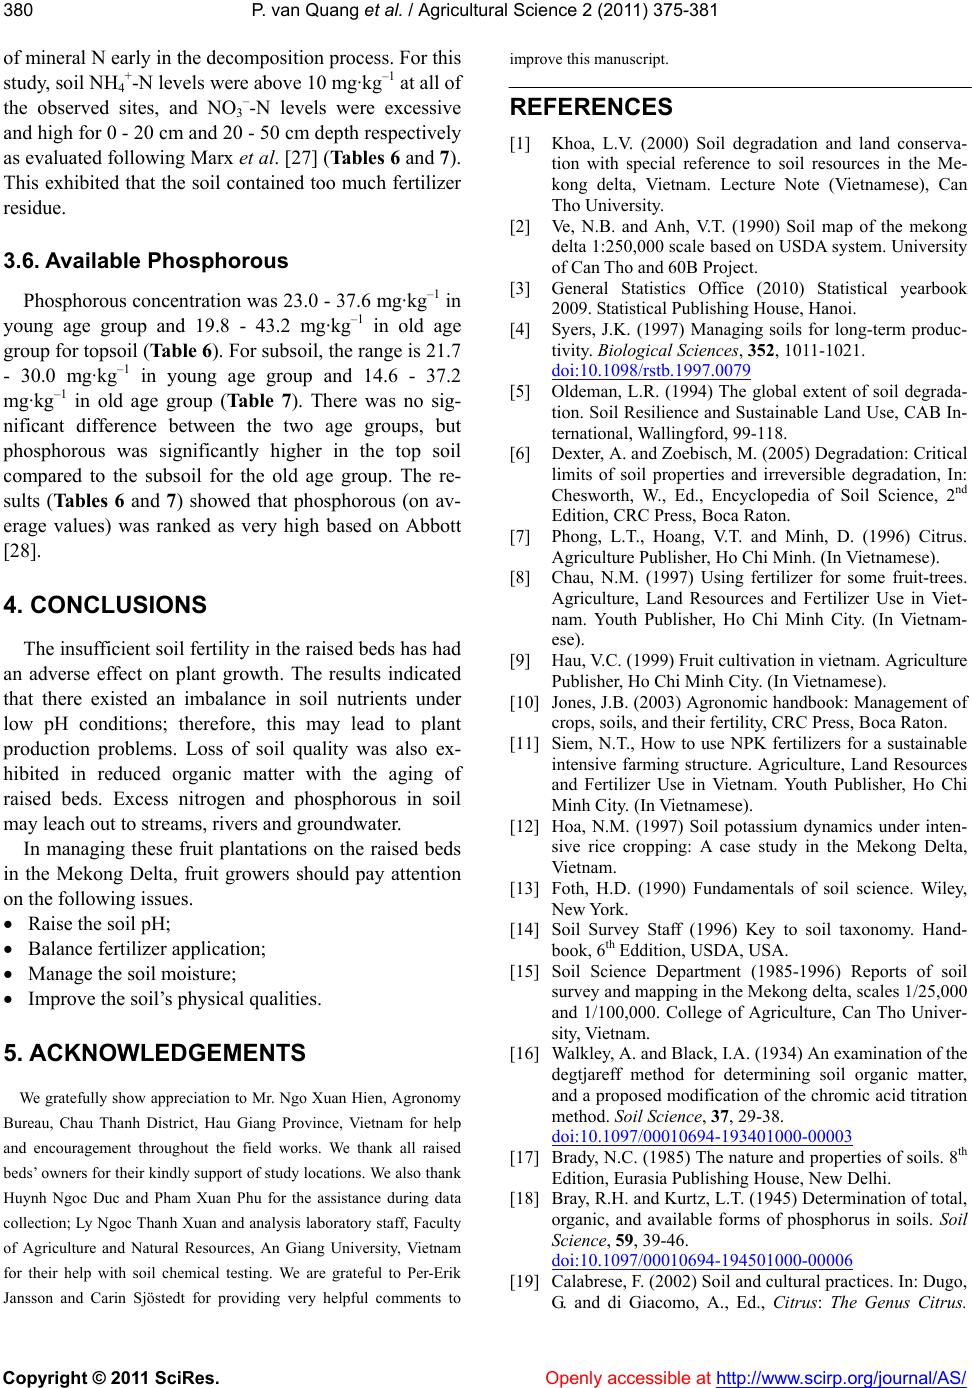
of mineral N early in the decomposition process. For this
study, soil NH4
+-N levels were above 10 mg·kg–1 at all of
the observed sites, and NO3
-N levels were excessive
and high for 0 - 20 cm and 20 - 50 cm depth respectively
as evaluated following Marx et al. [27] (Tables 6 and 7).
This exhibited that the soil contained too much fertilizer
residue.
3.6. Available Phosphorous
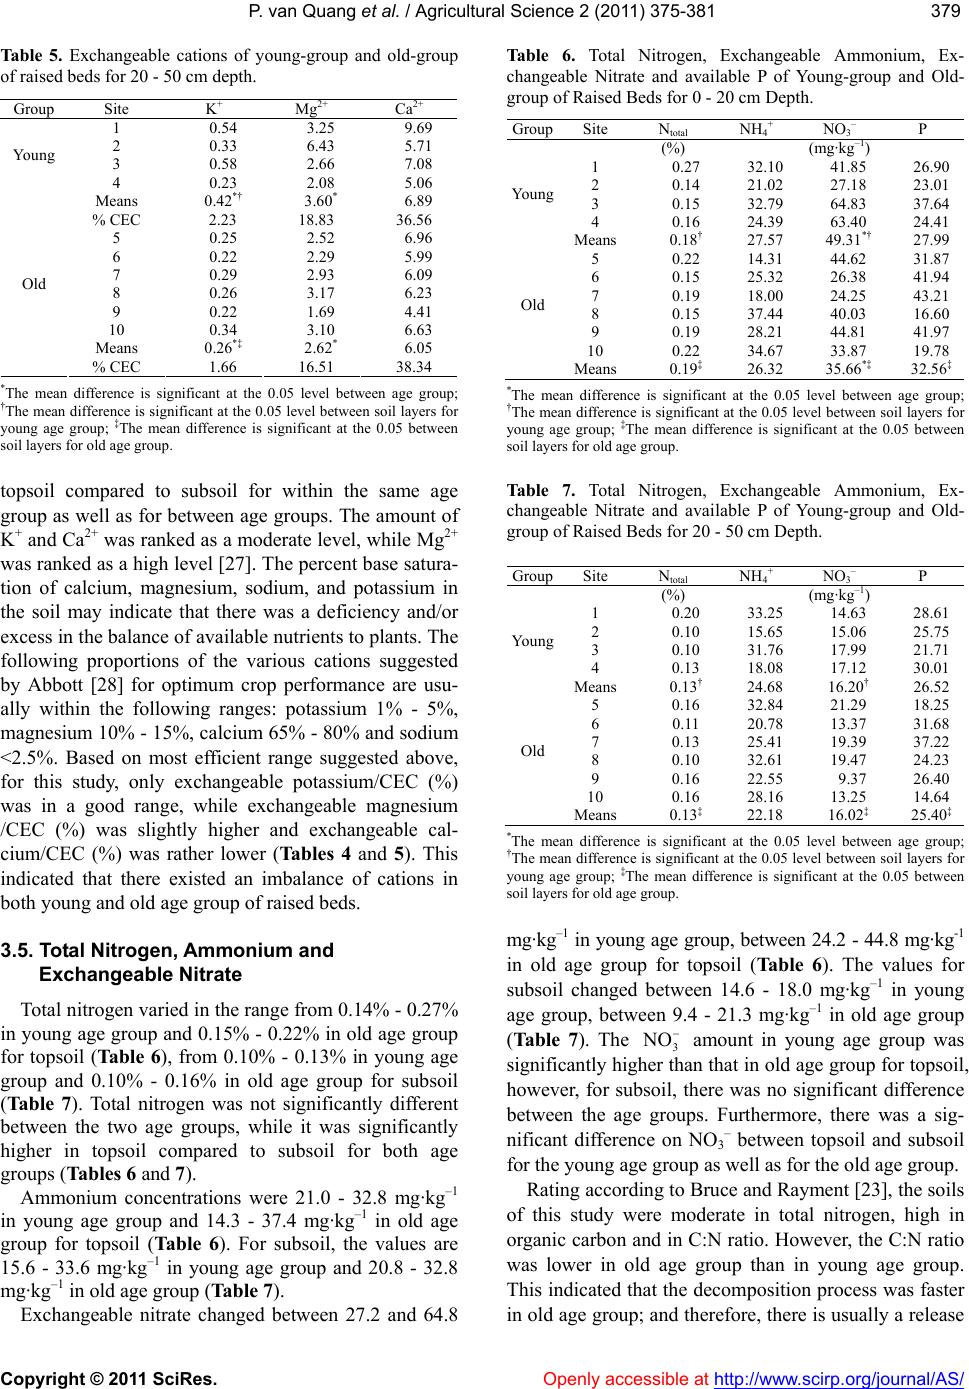
Phosphorous concentration was 23.0 - 37.6 mg·kg–1 in
young age group and 19.8 - 43.2 mg·kg–1 in old age
group for topsoil (Table 6). For subsoil, the range is 21.7
- 30.0 mg·kg–1 in young age group and 14.6 - 37.2
mg· k g –1 in old age group (Tab le 7). There was no sig-
nificant difference between the two age groups, but
phosphorous was significantly higher in the top soil
compared to the subsoil for the old age group. The re-
sults (Ta bl es 6 and 7) showed that phosphorous (on av-
erage values) was ranked as very high based on Abbott
[28].
4. CONCLUSIONS
The insufficient soil fertility in the raised beds has had
an adverse effect on plant growth. The results indicated
that there existed an imbalance in soil nutrients under
low pH conditions; therefore, this may lead to plant
production problems. Loss of soil quality was also ex-
hibited in reduced organic matter with the aging of
raised beds. Excess nitrogen and phosphorous in soil
may leach out to streams, rivers and groundwater.
In managing these fruit plantations on the raised beds
in the Mekong Delta, fruit growers should pay attention
on the following issues.
Raise the soil pH;
Balance fertilizer application;
Manage the soil moisture;
Improve the soil’s physical qualities.
5. ACKNOWLEDGEMENTS
We gratefully show appreciation to Mr. Ngo Xuan Hien, Agronomy
Bureau, Chau Thanh District, Hau Giang Province, Vietnam for help
and encouragement throughout the field works. We thank all raised
beds’ owners for their kindly support of study locations. We also thank
Huynh Ngoc Duc and Pham Xuan Phu for the assistance during data
collection; Ly Ngoc Thanh Xuan and analysis laboratory staff, Faculty
of Agriculture and Natural Resources, An Giang University, Vietnam
for their help with soil chemical testing. We are grateful to Per-Erik
Jansson and Carin Sjöstedt for providing very helpful comments to
improve this manuscript.
REFERENCES
[1] Khoa, L.V. (2000) Soil degradation and land conserva-
tion with special reference to soil resources in the Me-
kong delta, Vietnam. Lecture Note (Vietnamese), Can
Tho University.
[2] Ve, N.B. and Anh, V.T. (1990) Soil map of the mekong
delta 1:250,000 scale based on USDA system. University
of Can Tho and 60B Project.
[3] General Statistics Office (2010) Statistical yearbook
2009. Statistical Publishing House, Hanoi.
[4] Syers, J.K. (1997) Managing soils for long-term produc-
tivity. Biological Sciences, 352, 1011-1021.
doi:10.1098/rstb.1997.0079
[5] Oldeman, L.R. (1994) The global extent of soil degrada-
tion. Soil Resilience and Sustainable Land Use, CAB In-
ternational, Wallingford, 99-118.
[6] Dexter, A. and Zoebisch, M. (2005) Degradation: Critical
limits of soil properties and irreversible degradation, In:
Chesworth, W., Ed., Encyclopedia of Soil Science, 2nd
Edition, CRC Press, Boca Raton.
[7] Phong, L.T., Hoang, V.T. and Minh, D. (1996) Citrus.
Agriculture Publisher, Ho Chi Minh. (In Vietnamese).
[8] Chau, N.M. (1997) Using fertilizer for some fruit-trees.
Agriculture, Land Resources and Fertilizer Use in Viet-
nam. Youth Publisher, Ho Chi Minh City. (In Vietnam-
ese).
[9] Hau, V.C. (1999) Fruit cultivation in vietnam. Agriculture
Publisher, Ho Chi Minh City. (In Vietnamese).
[10] Jones, J.B. (2003) Agronomic handbook: Management of
crops, soils, and their fertility, CRC Press, Boca Raton.
[11] Siem, N.T., How to use NPK fertilizers for a sustainable
intensive farming structure. Agriculture, Land Resources
and Fertilizer Use in Vietnam. Youth Publisher, Ho Chi
Minh City. (In Vietnamese).
[12] Hoa, N.M. (1997) Soil potassium dynamics under inten-
sive rice cropping: A case study in the Mekong Delta,
Vietnam.
[13] Foth, H.D. (1990) Fundamentals of soil science. Wiley,
New York.
[14] Soil Survey Staff (1996) Key to soil taxonomy. Hand-
book, 6th Eddition, USDA, USA.
[15] Soil Science Department (1985-1996) Reports of soil
survey and mapping in the Mekong delta, scales 1/25,000
and 1/100,000. College of Agriculture, Can Tho Univer-
sity, Vietnam.
[16] Walkley, A. and Black, I.A. (1934) An examination of the
degtjareff method for determining soil organic matter,
and a proposed modification of the chromic acid titration
method. Soil Science, 37, 29-38.
doi:10.1097/00010694-193401000-00003
[17] Brady, N.C. (1985) The nature and properties of soils. 8th
Edition, Eurasia Publishing House, New Delhi.
[18] Bray, R.H. and Kurtz, L.T. (1945) Determination of total,
organic, and available forms of phosphorus in soils. Soil
Science, 59, 39-46.
doi:10.1097/00010694-194501000-00006
[19] Calabrese, F. (2002) Soil and cultural practices. In: Dugo,
G. and di Giacomo, A., Ed., Citrus: The Genus Citrus.
P. van Quang et al. / Agricultural Science 2 (2011) 375-381
Copyright © 2011 SciRes. http://www.scirp.org/journal/AS/Openly accessible at
381381
Medicinal and Aromatic Plants-Industrial Profiles, Tay-
lor and Francis, London and New York, 1027-4502.
[20] Tan, K.H. (2005) Soil sampling, preparation, and analysis.
Books in soils, plants, and the environment. Taylor &
Francis, Boca Raton.
[21] Fu, M.H., Xu, X.C. and Tabatabai, M.A. (1987) Effect of
pH on nitrogen mineralization in crop-residue-treated
soils. Biology and Fertility of Soils, 5, 115-119.
doi:10.1007/BF00257645
[22] Slattery, J.F., Slattery, W.J. and Carmody, B.C. (1999)
Influence of soil chemical characteristics on medic
rhizobia in the alkaline soils of south eastern Australia. In:
Martinez, E. and Hernandez, G., Eds., Highlights of Ni-
trogen Fixation Research, Kluwer Academic/Plenum
Publishers, New York, 243-249.
[23] Bruce, R.C. and Rayment, G.E. (1982) Analytical meth-
ods and interpretations used by the Agricultural Chemis-
try Branch for soil and land use surveys. Queensland
Department of Primary Industries Bulletin No. QB82004,
Brisbane.
[24] McKenzie, N. (2004) Australian soils and landscapes: An
illustrated compendium. CSIRO, Collingwood.
[25] Metson, A.J. (1961) Methods of chemical analysis for
soil survey samples, soil bureau bulletin 12. Department
of Scientific and Industrial Research, New Zealand.
[26] Lal, R. and Shukla, M.K. (2004) Principles of soil phys-
ics. Marcel Dekker, New York.
[27] Marx, E., et al. (1996) Soil test interpretation guide.
Oregon State University Extension Service.
[28] Abbott, T.S. (1985) Soil Testing service—methods and
interpretation. NSW Department of Agriculture, Sydney.