 Vol.2, No.3, 273-282 (2011) doi:10.4236/as.2011.23036 Copyright © 2011 SciRes. Openly accessible at http://www.scirp.org/journal/AS/ Agricultural Scienc es Water use efficiency and yield of winter wheat under different irrigation regimes in a semi-arid region Mohamed Hakim Kharrou1*, Salah Er-Raki2, Ahmed Chehbouni3, Benoit Duchemin4, Vincent Simonneaux4, Michel LePage4, Lahcen Ouzine1, Lionel Jarlan4,5 1ORMVAH, Office Régional de Mise en Valeur Agricole du Haouz, Marrakech, Morocco; *Corresponding Author: hakimkharrou1@yahoo.fr 2LP2M2E, Department of Physics, Faculty of Sciences and Technology, Marrakech, Morocco; 3FSSM, Faculté des Sciences Semlalia Marrakech, Morocco; 4CESBIO, Centre des Etudes Spatiales de la BIOsphère, Toulouse, France; 5Direction de la Météorologie Nationale, Casablanca, Maroc. Received 27 May 2011; revised 19 July 2011; accepted 31 July 2011. ABSTRACT In irrigation schemes under rotational water supply in semi-arid region, the water allocation and irrigation scheduling are often based on a fixed-area proportionate water depth with every irrigation cycle irrespective of crops and their growth st ages, for an equitable water supply. An experiment was conducted during the 2004- 2005 seas on in Haouz irrigated area in Morocc o, which objective w as 1) to evaluate the effects of the surface irrigation scheduling method (ex- isting rule) adopted by the irrigation agency on winter wheat production compared to a full ir- rigation method and 2) to evaluate drip irrigation versus surface irrigation impacts on water sav- ing and yield of w inter wheat. The methodology was based on the FAO-56 dual approach for the surface irrigation scheduling. Ground measure- ments of the Normalized Difference Vegetation Index (NDVI) were used to derive the basal crop coefficient and the vegetation fraction cover. The simple FAO-56 approach was used for drip irrigation scheduling. For surface irrigation, the existing rule approach resulted in yield and WUE reductions of 22% and 15%, respectively, compared with the optimized irrigation sched- uling proposed by the FAO-56 for full irrigation treatment. This revealed the negative effects of the irrigation schedules adopted in irrigation schemes under rot ationa l water supply on crops productivity. It was also demonstrated that drip irrigation applied to wheat was more efficient with 20% of water saving in comparison with surface irrigation (full irrigation treatment). Drip irrigation gives also higher wheat yield com- pared to surface irrigation (+28% and +52% for full irrigation and existing rule treatments re- spectively). The same improvement was ob- served for water use efficiency (+24% and +59% respectively). Keywords: Water Use Efficency; Yield; Surface and Drip Irrigation; FAO-56; Irrigation Sche duling; Wheat 1. INTRODUCTION Water demand has significantly increased over the last decades while available water resources are becoming increasingly scarce. This is mainly due to the combined effect of climate change, persistent drought and the in- crease of water demands related to increase in irrigated surfaces, urbanization and tourism recreational projects. In this context, improvement of water management in agriculture, which is the biggest water consumer, is nec- essary to enhance agricultural productivity in order to meet food demands of the growing population. The Moroccan agriculture sector contributes 19% of the GNP and plays a substantial role in the macroeco- nomic balance of the country. Cereal crops, mainly win- ter wheat, occupy 75% of agricultural areas, and directly contribute to the food security of the country [1]. How- ever, the cereal productivity is still below the potential mainly because of the traditional management of farms and the climatic conditions characterized by poor and irregular rainfall (a reduction in spring precipitation has already been highlighted by [2]) which requires exten- sive irrigation for cereal production stability. Therefore in irrigated areas, a reasonable irrigation scheduling is a  M. H. Kharrou et al. / Agricultural Science 2 (2011) 273-282 Copyright © 2011 SciRes. Openly accessible at http://www.scirp.org/journal/AS/ 274 key factor to help farmers increase crop yield and save water regarding limited water resources. The water use efficiency (WUE) is one of the most important indices for determining optimal water management practices; its use has been reviewed by [3,4]. When irrigation is ap- plied at the critical stages of plant development, values of WUE are larger, especially under deficit irrigation [5]. Also, high irrigation water use efficiency (WUE) for wheat could be achieved by saving irrigation rates under drip system [6]. This result is of great importance since the Moroccan government has promoted the use of water saving technologies by providing financial support for infrastructure which requires great training and exten- sion efforts [1]. Moreover, in irrigation schemes under rotational water supply in semiarid environment, the existing rules for water allocation are often based on applying a fixed-area proportionate depth of water with every irrigation cycle irrespective of the crops and their growth stages and that for ease of irrigation schemes operation. This frequently is likely to result in excessive water depths being applied when large amount of water are available or, by contrast, water stress periods occurring when irrigation intervals are too large. This is the case in the area of study, the Haouz plain, one of the most important agricultural areas in Morocco. Thus, the effects of these irrigation sched- uling rules on crops productivity have to be assessed in order to improve water management. A fundamental requirement for accurate irrigation scheduling is to determine crop water needs or crop evapotranspiration (ETc). The most common and practi- cal approach used for estimating crop evapotranspira- tion is the FAO-56 method published by the Food and Agricultural Organization (FAO) of the UN as FAO irri- gation and Drainage paper No. 56 [7]. This approach has been widely used due to its simplicity and its applicabil- ity at operational basis with satisfying results under various climates and over several crops [8-18]. In addi- tion to the single crop coefficient (Kc) approach, FAO- 56 introduced dual crop coefficient procedure where the single Kc is separated into a basal crop coefficient, or Kcb (primary crop transpiration), and a soil evaporation coefficient (Ke). The FAO-56 dual procedure provides an excellent framework for calculating daily ETc. How- ever, successful application is highly dependent on the ability to derive an appropriate Kcb curve that matches the actual crop growth and ETc conditions that occur during a given season [7]. Multispectral vegetation indices, such as the Normal- ized Difference Vegetation Index (NDVI), have gained wide acceptance for estimating several crop growth pa- rameters. Several studies have highlighted the potential of using NDVI for crop coefficients estimation [10,12,15, 17]. In this study, we have used ground radiometric mea- surements to derive NDVI-based Kcb and NDVI-based fraction cover (fc) along with the FAO-56 dual proce- dure to schedule surface irrigation and the single Kc pro- cedure for drip irrigation scheduling. It has been found that the impact of limited irrigation and soil water deficit on crop yield or WUE depends on the particular growth stage of the crop, and the most sensitive stage can vary region-by-region due to regional variability in environment and agronomic practices [19]. In the Mediterranean region, [20] reported that wheat response to water stress is more sensitive from stem- elongation to booting, followed by anthesis and grain- filling stages. For the Loess Plateau of China, [21] found that winter wheat sensitivity to drought occurs, in de- creasing order of importance, during the stages of anthe- sis, booting, stem elongation, and grain filling. Although relationships between wheat Grain yield (GY) and amounts of water applied or evapotranspira- tion, reported by several authors, have been widely used as a guideline for irrigation [4,20,22], the effects of tim- ing applications, dictated by the irrigation schedules, on wheat GY and WUE cannot be explained by these rela- tionships. So, the objective of this research was to evalu- ate the effects of the existing rules of surface irrigation allocation and scheduling in a rotational irrigation sys- tem on yield and water use efficiency of winter wheat in a semi arid environment. Also, a comparison with drip irrigation method was included in the study. 2. MATERIALS AND METHODS 2.1. Experimental Site and Data Collection Field experiment was conducted during 2004-2005 season at the experimental station of the irrigation agency called Office Régional de Mise en Valeur Agri- cole du Haouz (ORMVAH). This station which is about 6 hectares was created in 1990 and located 15 km West of Marrakech city in an irrigation scheme (latitude 31˚37′56″N, longitude 8˚09′24″, 412 m over mean sea level). The climate of the region is typically Mediterra- nean semi-arid, with around 250 mm of average annual rainfall, concentrated mainly from autumn to spring, and an average annual reference evapotranspiration (ETo) of about 1600 mm. The soil at the experimental site is a silty clay loam with a bulk density of 1.4 g/cm3. Winter wheat (“Arrehane 1774” cultivar) was sown on 8th De- cember 2004 at a rate of 216 Kg/ha. The experimental area consisted of two plots PG3 and PL3 of 0.60 and 0.36 ha respectively. All the experimental plots had the same characteristics and the same crop management practice (soil preparation, fertilizer and pest control etc.) and they were fallowed  M. H. Kharrou et al. / Agricultural Science 2 (2011) 273-282 Copyright © 2011 SciRes. Openly accessible at http://www.scirp.org/journal/AS/ 275275 since 2002. They differ only in the irrigation timing and water amounts applied in order to limit the complexities in the discussion of the influence of different irrigation scheduling rules. Fertilizer was applied manually in four split applications, with the first application at planting, consisting of 200 kg·ha−1 of ammonium sulfate (21% N), 225 kg·ha−1 of triple super phosphate (45% P2O5), and 100 kg·ha−1 of sulfate of potash (48% K2O). The other applications were at 51, 100 and 121 days after planting and included 133, 109 and 72 kg·ha−1 of urea respec- tively. Weeds were controlled with specific chemical applications. A weather station installed in the experi- mental station provided hourly measurements of climatic parameters (solar radiation, wind speed, relative humid- ity, and air temperature). Punctual measurements of soil water content at different depths (from 0.10 m to 0.80 m) were made using gravimetric soil water sampling. Also, crop height (Ht) and root depth (Zr) were measured dur- ing the growing season. In order to assess wheat crop phenology and evaluate the irrigation treatments effects on it, the Leaf Area In- dex (m²/m²) was measured every two weeks using hemi- spherical photographs, based on a method calibrated in a previous study using LAI ground measurements [23]. Before harvesting, five 1 m2 plots were selected at ran- dom to measure the grain yield components and yield was measured by weighing after harvesting. Finally, measurements of canopy reflectance were carried out using a hand-held radiometer (MSR87 Mul- tiSpectral Radiometer, Cropscan Inc., USA) at the same dates of hemispherical photo shots. From the reflectance measurements, the normalized difference vegetation index [24] was computed. In addition, the fraction cover of the vegetation was derived from NDVI using a rela- tionship previously calibrated on this crop in the area [12]: c f1.18NDVI NDVI min (1) where NDVImin is the NDVI value for the bare soil equal to 0.147. 2.2. Irrigation Treatments and Irrigation Scheduling Methods Two surface irrigation scheduling treatments were ap- plied in the PG3 plot, with two replications each: irriga- tion scheduling based on the FAO-56 dual procedure (full irrigation) and irrigation scheduling according to the existing rule adopted by the irrigation agency (exist- ing rule approach). Another treatment (drip irrigation) consisting of FAO-56 single approach for drip irrigation scheduling was employed within PL3 plot. The irrigation amounts applied were volumetrically measured using records of water level in a tank with 200 m3 capacity in the surface irrigation case and, using a water meter in the drip irrigation case. For the two surface irrigation treatments, the border system, which is the most common irrigation practice in the region, was adopted and the water was applied to strips of 5 m wide and 25 m length. The drip irrigation system adopted comprises a laterals spacing of 1.0 m which were 16 mm in diameter. The emitters were inline type with spacing of 0.4 m and had 4.0 l/h flow rate at 1.0 atm pressure. The irrigation is scheduled, in the case of existing rule approach, according to the water delivery schedules pre- pared by irrigation managers for the irrigation scheme. Predetermined annual quota according to surface water availability in dams is allocated for irrigation at the be- ginning of the season. This water volume is distributed on a fixed-area proportionate water allocation basis pro- viding the same water depth per hectare to farmers. Then, the dates and duration of water delivery to the fields (using rotational irrigation) are pre-sets for every irriga- tion cycle throughout the season in arrangement with the Water User Associations representing the farmers of the irrigation scheme. In the case of full irrigation treatment, the timing and the amounts of water to apply were planned in order to avoid crop water stress. Thus, irrigation was scheduled to cancel the soil water depletion and the water depth was calculated in order to bring the soil water content to its total available water (TAW). The irrigation timing, in this case, is determined when the stress coefficient (Ks) reached a threshold value considered equal to 0.6 for the wheat according to [25]. The irrigation is scheduled, for drip irrigation treat- ment, based on the soil water balance method in which the drainage and runoff were neglected and the net irri- gation depth was estimated by subtracting the rainfall from the calculated crop evapotranspiration on daily basis using this relationship: IRETo KcR (2) where IR, ETo, Kc and R refer respectively to net depth of irrigation (mm·d−1), reference evapotranspiration (mm·d−1), crop coefficient and rainfall (mm·d−1). 2.3. FAO-56 Procedure Parameters and Water Use Efficiency The FAO-56 is based on the concepts of reference evapotranspiration ETo and crop coefficients introduced to separate the standard climatic demand (ETo) from the plant response ETc [7]. The single method relies on the following equation: ETcKc ETo (3)  M. H. Kharrou et al. / Agricultural Science 2 (2011) 273-282 Copyright © 2011 SciRes. Openly accessible at http://www.scirp.org/journal/AS/ 276 where Kc is the single crop coefficient. The daily refer- ence evapotranspiration, ETo, is calculated according to the FAO Penman-Monteith method [7]. Daily values of the climatic parameters used for calculating ETo are ob- tained from the weather station installed in the experi- mental station. The dual method accounts for variations in soil water availability, inducing either stress and soil evaporation, and is based on the following equation: cb e ETcKs KKETo (4) where Kcb is the basal crop coefficient derived from NDVI using this previously calibrated relationship for wheat crop in the region [23] : cb min K1.64NDVI NDVI (5) Ke and Ks are calculated based on daily water balance computation in the surface soil evaporation layer of ef- fective depth (Ze) and in the root zone (Zr), respectively, according to [7]. The soil parameters that were used in the FAO-56 procedure for calculating Ke, Ks and thus crop evapo- transpiration (ETc) are presented in Table 1. p is the fraction of TAW that a crop can extract from the root zone without suffering water stress. The rec- ommended values for p, given in Table 2 of FAO-56 paper [7], apply for ETc ≈ 5 mm/day. In this study, the value for p was adjusted for different ETc according to p = p (the table 22 in FAO-56 paper) + 0.04x(5 – ETc) [7]. The FAO-56 dual procedure for the full irrigation treatment was implemented using a software developed in EXCEL [7]. Once the model parameters were updated using data collected, and in order to predict future dates and amounts of irrigation, daily average climatic data (ETo, wind speed and relative humidity), and linear ex- trapolations for crop parameters (Kcb, fc, crop height Ht and root depth Zr) were used. Since, the water balance approach for irrigation scheduling is based on estimates and is not always accurate, actual readings of crop height (Ht) and root depth (Zr) were taken during the growing season to adjust the predictions, and also the measured Tab le 1 . The soil parameters used for the determination of Ke, Ks and crop evapotranspiration (ETc) following the FAO-56 methodology. Soil parameters Values Field capacity, θFC (m3/m3) Wilting point, θwp (m3/m3) Maximum effective rooting depth, Zr (m) Depth of the evaporation soil layer, Ze (m) Total evaporable water, TEW (mm) Readily evaporable water, REW (mm) Total available water, TAW (mm/m) Wetting fraction, fw (fraction) Readily available water, RAW (mm/m) 0.36 0.20 0.80 0.12 32 12 165 1.0 p × TAW soil water was used to update, if necessary, the estimated Root zone depletion (Dr) [26]. In the case of existing rule treatment, although irriga- tion was not driven by FAO budget, the same parameters as for full irrigation plots were observed and computed in order to compare the two treatments and especially their effects on stress. Finally, for drip irrigation treatment, the crop evapo- transpiration was calculated using the FAO simple crop coefficient approach with Kc values of 0.30 for Kcini, 1.15 for Kcmid and 0.4 for Kcend taken directly from the table 12 in FAO-56 paper [7]. Water use efficiency (WUE, kg·m−3) regarding yield was finally calculated as [27]: WUE0.1GY / ET (6) where ET (mm) is the evapotranspiration calculated using the previous FAO method and GY is the measured Grain Yield (kg·ha−1). 3. RESULTS AND DIS CUSSION 3.1. Water Consumption The irrigation timing and the water depths applied for the different irrigation schedules are shown in Table 2. The main difference between three treatments was the annual amount of irrigation water, which was 455, 396 and 362 mm for full irrigation, existing rule and Drip irrigation treatments, respectively. Because the season was dry (only 52 mm amount of rainfall during the growing cycle), the irrigation water was very important and represented about 90% of the total water applied. Drip irrigation scheduling was found to be more efficient with water saving of about 20% comparatively to surface irrigation with the full irrigation approach. The latter consumes 10% more water than the existing rule ap- proach to avoid crop stress. Also, it can be seen that for Table 2. Irrigation date and water amount (mm). water amount applied per treatment (mm) Irrigation date Full irrigation Existing rule Drip irrigation 12/22/0476.5 DEC 12/23/04 70 19 01/13/05 68 JAN 01/14/0565.5 65 02/02/0557 FEB 02/16/05 64.5 72 03/17/05115 MARCH 03/20/05 57.5 111 04/02/05 136 APRIL 04/04/05141 95 TOTAL Irrigation 455 396 362 TOTAL Rainfall 52 52 52 TOTAL (Irrigation + Rainfall) 507 448 414 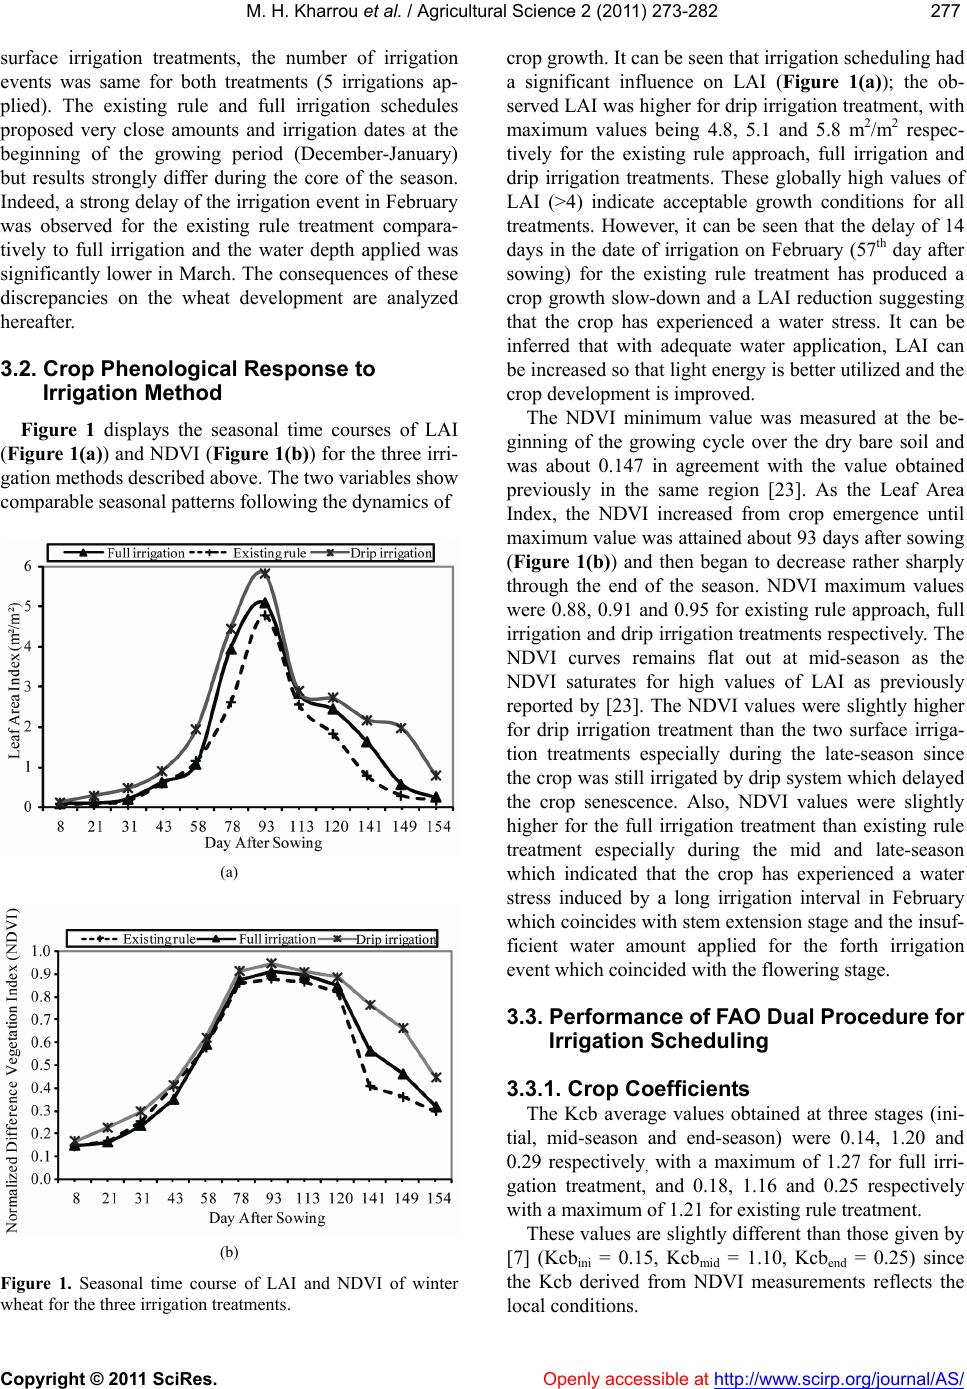 M. H. Kharrou et al. / Agricultural Science 2 (2011) 273-282 Copyright © 2011 SciRes. Openly accessible at http://www.scirp.org/journal/AS/ 277277 surface irrigation treatments, the number of irrigation events was same for both treatments (5 irrigations ap- plied). The existing rule and full irrigation schedules proposed very close amounts and irrigation dates at the beginning of the growing period (December-January) but results strongly differ during the core of the season. Indeed, a strong delay of the irrigation event in February was observed for the existing rule treatment compara- tively to full irrigation and the water depth applied was significantly lower in March. The consequences of these discrepancies on the wheat development are analyzed hereafter. 3.2. Crop Phenological Response to Irrigation Method Figure 1 displays the seasonal time courses of LAI (Figure 1(a)) and NDVI (Figure 1(b)) for the three irri- gation methods described above. The two variables show comparable seasonal patterns following the dynamics of (a) (b) Figure 1. Seasonal time course of LAI and NDVI of winter wheat for the three irrigation treatments. crop growth. It can be seen that irrigation scheduling had a significant influence on LAI (Figure 1(a)); the ob- served LAI was higher for drip irrigation treatment, with maximum values being 4.8, 5.1 and 5.8 m2/m2 respec- tively for the existing rule approach, full irrigation and drip irrigation treatments. These globally high values of LAI (>4) indicate acceptable growth conditions for all treatments. However, it can be seen that the delay of 14 days in the date of irrigation on February (57th day after sowing) for the existing rule treatment has produced a crop growth slow-down and a LAI reduction suggesting that the crop has experienced a water stress. It can be inferred that with adequate water application, LAI can be increased so that light energy is better utilized and the crop development is improved. The NDVI minimum value was measured at the be- ginning of the growing cycle over the dry bare soil and was about 0.147 in agreement with the value obtained previously in the same region [23]. As the Leaf Area Index, the NDVI increased from crop emergence until maximum value was attained about 93 days after sowing (Figure 1(b)) and then began to decrease rather sharply through the end of the season. NDVI maximum values were 0.88, 0.91 and 0.95 for existing rule approach, full irrigation and drip irrigation treatments respectively. The NDVI curves remains flat out at mid-season as the NDVI saturates for high values of LAI as previously reported by [23]. The NDVI values were slightly higher for drip irrigation treatment than the two surface irriga- tion treatments especially during the late-season since the crop was still irrigated by drip system which delayed the crop senescence. Also, NDVI values were slightly higher for the full irrigation treatment than existing rule treatment especially during the mid and late-season which indicated that the crop has experienced a water stress induced by a long irrigation interval in February which coincides with stem extension stage and the insuf- ficient water amount applied for the forth irrigation event which coincided with the flowering stage. 3.3. Performance of FAO Dual Procedure for Irrigation Scheduling 3.3.1. Crop Coefficients The Kcb average values obtained at three stages (ini- tial, mid-season and end-season) were 0.14, 1.20 and 0.29 respectively, with a maximum of 1.27 for full irri- gation treatment, and 0.18, 1.16 and 0.25 respectively with a maximum of 1.21 for existing rule treatment. These values are slightly different than those given by [7] (Kcbini = 0.15, Kcbmid = 1.10, Kcbend = 0.25) since the Kcb derived from NDVI measurements reflects the local conditions.  M. H. Kharrou et al. / Agricultural Science 2 (2011) 273-282 Copyright © 2011 SciRes. Openly accessible at http://www.scirp.org/journal/AS/ 278 This result illustrates the interest of remote sensing data to derive Kcb values since it offers first the ability to account for variations in plant growth due to specific weather conditions, and also improved irrigation sched- uling due to better estimation of water use and more ap- propriate timing of irrigations [10,28]. During the initial stage, there were no differences be- tween the adjusted Kc (Kc-adj = Kcb·Ks + Ke) and Ke values for the two treatments since the irrigation events occurred at almost the same time suggesting a similar crop development. However, the existing rule scheduling approach adopted by the irrigation managers implies a large irrigation interval (34 days between the second and the third irrigation, and 14 days between the two treat- ments for the third irrigation) which caused a decrease of the Kc-adj and Ke values. In particular, the Kc-adj reached a minimum value of 0.33 indicating a strong water stress effect. The stress coefficients Ks calculated for the two sur- face irrigation treatments were also compared (Figure 3). In the case of existing rule treatment, as explained pre- viously, winter wheat experienced a water stress at the crop-development stage due to the large irrigation inter- (a) (b) Figure 2. Evolution of crop coefficients during the winter wheat crop season under two surface irrigation treatments: (a) full irrigation, (b) existing rule. Figure 3. Estimated daily stress coefficient Ks by the FAO-56 dual Kc approach for full irrigation and existing rule treatments during 2004-2005 growing season. Amounts and dates of irri- gation applied for both treatments are also shown. val, the Ks decreased below the threshold value for 10 days. Also, due to the insufficient water quantity applied during the fourth irrigation event, the Ks started to de- cline earlier than for the full irrigation treatment. This experiment revealed that although the irrigation scheduling adopted by the irrigation agency proposed the same number of irrigation events as those required by the FAO method used for the full irrigation schedul- ing (five irrigations received throughout the season), the irrigation timing and water amounts were not optimal suggesting an inadequate water irrigation delivery. In fact, in Haouz irrigated schemes, as previously explained, the irrigation depths are defined for each irrigation cycle, in an equitable manner (a fixed-area proportionate water amount for all farmers) according to the water availabil- ity in reservoirs irrespective of the crops and their growth stages. 3.3.2. Soil Water Depletion The crop water stress is also appreciated by analyzing the root zone soil water depletion (Dr) during the crop season. Figure 4 illustrates Dr estimated by the FAO procedure for the two treatments: full irrigation treat- ment (Figure 4(a)) and existing rule treatment (Figure 4(b)). The total available water (TAW) curve increases dur- ing the crop season regarding the root development which reached a maximum value of 0.80 m according to the root depth measurements made during the season. The readily available water (RAW) curve shows some variations during crop season due to the ratio of RAW to TAW parameter “p” which varies with the daily crop evapotranspiration. Since the 2004-2005 season was dry (with a precipita- tion of 116 mm from September 2004 to August 2005 which is lower than the regional climatic average of 240 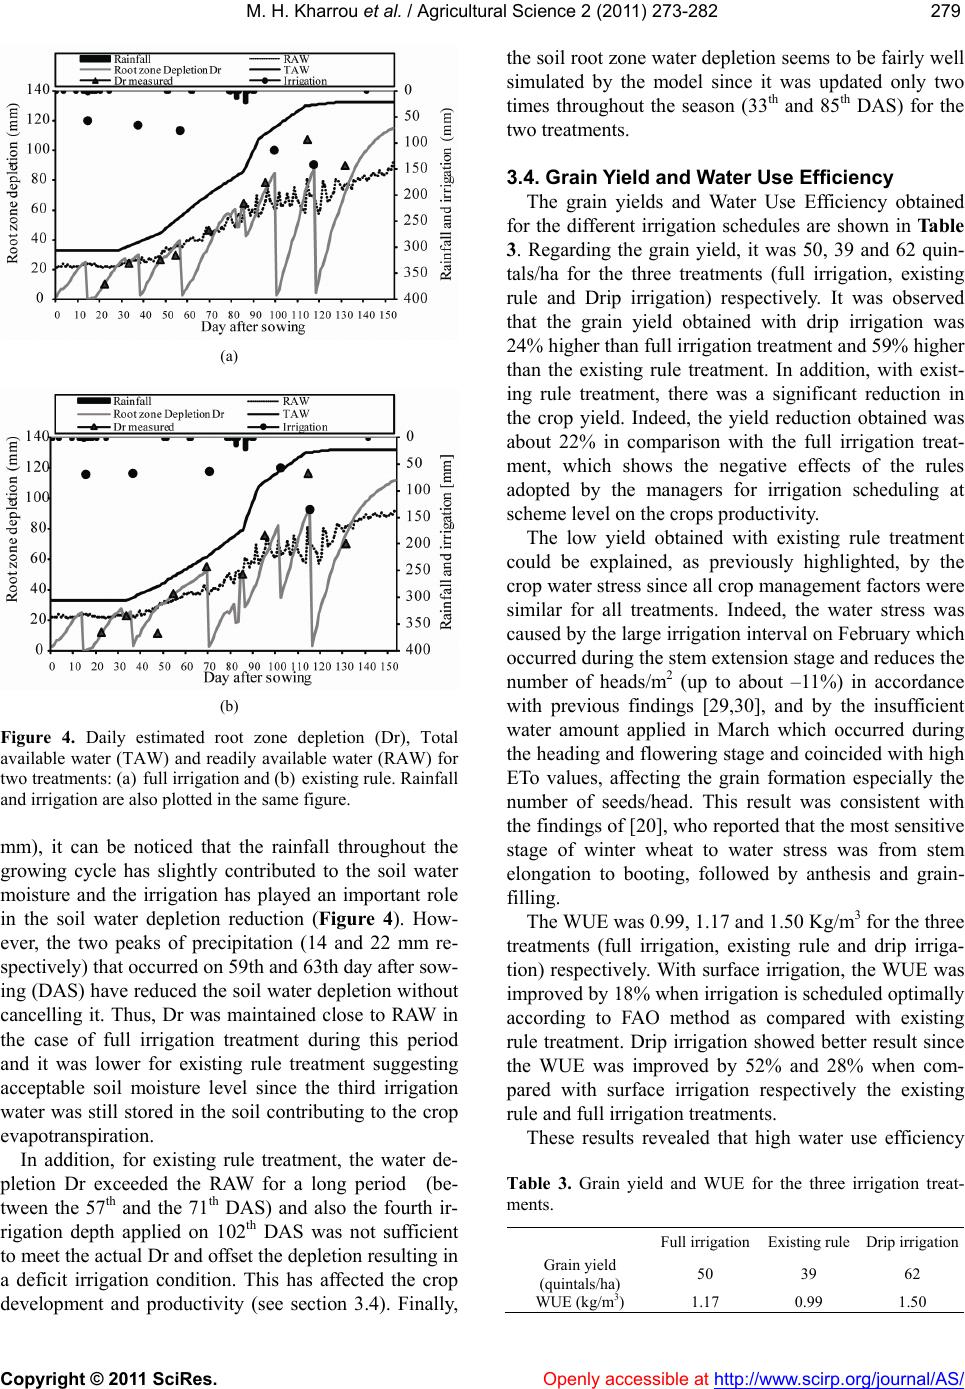 M. H. Kharrou et al. / Agricultural Science 2 (2011) 273-282 Copyright © 2011 SciRes. Openly accessible at http://www.scirp.org/journal/AS/ 279279 (a) (b) Figure 4. Daily estimated root zone depletion (Dr), Total available water (TAW) and readily available water (RAW) for two treatments: (a) full irrigation and (b) existing rule. Rainfall and irrigation are also plotted in the same figure. mm), it can be noticed that the rainfall throughout the growing cycle has slightly contributed to the soil water moisture and the irrigation has played an important role in the soil water depletion reduction (Figure 4). How- ever, the two peaks of precipitation (14 and 22 mm re- spectively) that occurred on 59th and 63th day after sow- ing (DAS) have reduced the soil water depletion without cancelling it. Thus, Dr was maintained close to RAW in the case of full irrigation treatment during this period and it was lower for existing rule treatment suggesting acceptable soil moisture level since the third irrigation water was still stored in the soil contributing to the crop evapotranspiration. In addition, for existing rule treatment, the water de- pletion Dr exceeded the RAW for a long period (be- tween the 57th and the 71th DAS) and also the fourth ir- rigation depth applied on 102th DAS was not sufficient to meet the actual Dr and offset the depletion resulting in a deficit irrigation condition. This has affected the crop development and productivity (see section 3.4). Finally, the soil root zone water depletion seems to be fairly well simulated by the model since it was updated only two times throughout the season (33th and 85th DAS) for the two treatments. 3.4. Grain Yield and Water Use Efficiency The grain yields and Water Use Efficiency obtained for the different irrigation schedules are shown in Table 3. Regarding the grain yield, it was 50, 39 and 62 quin- tals/ha for the three treatments (full irrigation, existing rule and Drip irrigation) respectively. It was observed that the grain yield obtained with drip irrigation was 24% higher than full irrigation treatment and 59% higher than the existing rule treatment. In addition, with exist- ing rule treatment, there was a significant reduction in the crop yield. Indeed, the yield reduction obtained was about 22% in comparison with the full irrigation treat- ment, which shows the negative effects of the rules adopted by the managers for irrigation scheduling at scheme level on the crops productivity. The low yield obtained with existing rule treatment could be explained, as previously highlighted, by the crop water stress since all crop management factors were similar for all treatments. Indeed, the water stress was caused by the large irrigation interval on February which occurred during the stem extension stage and reduces the number of heads/m2 (up to about –11%) in accordance with previous findings [29,30], and by the insufficient water amount applied in March which occurred during the heading and flowering stage and coincided with high ETo values, affecting the grain formation especially the number of seeds/head. This result was consistent with the findings of [20], who reported that the most sensitive stage of winter wheat to water stress was from stem elongation to booting, followed by anthesis and grain- filling. The WUE was 0.99, 1.17 and 1.50 Kg/m3 for the three treatments (full irrigation, existing rule and drip irriga- tion) respectively. With surface irrigation, the WUE was improved by 18% when irrigation is scheduled optimally according to FAO method as compared with existing rule treatment. Drip irrigation showed better result since the WUE was improved by 52% and 28% when com- pared with surface irrigation respectively the existing rule and full irrigation treatments. These results revealed that high water use efficiency Table 3. Grain yield and WUE for the three irrigation treat- ments. Full irrigation Existing rule Drip irrigation Grain yield (quintals/ha) 50 39 62 WUE (kg/m3) 1.17 0.99 1.50  M. H. Kharrou et al. / Agricultural Science 2 (2011) 273-282 Copyright © 2011 SciRes. Openly accessible at http://www.scirp.org/journal/AS/ 280 could be achieved either by improving yield and saving water under drip irrigation system. Also, even with sur- face irrigation method, good management of irrigation water (i.e. better irrigation scheduling) could lead to a better water use efficiency. The values obtained are close to those found in other studies [4,20,31-34]. It was re- ported that in general, the wheat WUE ranges from 0.40 to 1.83 kg/m3 globally on a yield basis. For example, with the irrigated wheat in the US southern plains, WUE was 0.50 - 1.20 kg/m3 with a yield of 3000 - 8000 kg/ha [4,31,32]. A higher WUE of 0.70 - 1.51 kg/m3 in winter wheat was found in the North China Plain [20,33,35]. Recently, [32] reported a much higher WUE of 0.97 - 1.83 kg/m3 in winter wheat in the North China Plain (NCP). With drip irrigation, WUE values of 1.13 - 1.20 kg/m3 for wheat were found in North Sinai (Egypt) de- pending on the drip system adopted [6]. A high effi- ciency of water use is extremely important for farmers and irrigation agencies in water scarce areas. 4. CONCLUSIONS Irrigation schemes in semi-arid environment are gen- erally subject to rotational irrigation supply based on fixed-area proportionate water depths applied every irri- gation cycle irrespective to crops and their growth stages. In this study, a dedicated experiment was conceived and implemented to evaluate the effects of the existing rule of surface irrigation allocation and scheduling in such rotational irrigation systems on yield and water use effi- ciency of winter wheat compared to a full irrigation ap- proach and the drip irrigation method, both based on FAO-56 procedure. The results showed that irrigation scheduling methods had obviously significant effects on growth and yield of winter wheat. For surface irrigation, the existing rule approach re- sulted in yield and WUE reductions of 22% and 15%, respectively, compared with optimized irrigation sched- uling proposed by the FAO-56 for full irrigation treat- ment. This revealed the negative effects of the irrigation schedules adopted in irrigation schemes under rotational water supply on crops productivity. Considering the ab- solute necessity for water saving and sustainable food production, it can be recommended to irrigation manag- ers to move from equitable, and rigid delivery schedules to more flexible delivery system operation and crop- based schedules. The results also suggested that incorporating remote sensing-based vegetation indices, such as NDVI, used to derive Kcb for the FAO method provides an opportunity to improve irrigation scheduling by a better estimation of water use and a more appropriate timing of irrigations. This study has demonstrated also that drip irrigation could be applied to the wheat crop, usually cultivated in rotation with other crops, which may justify the drip irrigation system adoption by farmers but economic pa- rameters are to be considered more closely. It is also demonstrated, as expected, that drip irriga- tion applied to wheat was more efficient with 20% of water saving in comparison with surface irrigation (full irrigation treatment). Drip irrigation gives also higher wheat yield compared with surface irrigation (+28% and +52% for full irrigation and existing rule treatments re- spectively). The same improvement was observed for water use efficiency (+24% and +59% respectively). It can be recommended that, flexibility of on-farm irriga- tion scheduling can be improved by providing a storage capacity (reservoirs) below the delivery point, so as to compensate for the expected mismatch, especially in time, between deliveries and consumption. Water can be pumped from the reservoir, which implies additional investment and operating costs but may allow the appli- cation of drip irrigation and also the conjunctive use of groundwater with the surface water when this latter is not available. 5. ACKNOWLEDGEMENTS This study was supported by SUDMED (IRD-UCAM) funded by the European Union (PCRD). The authors thanks the SudMed techni- cal partners especially ORMVAH (‘Office Regional de Mise en Valeur Agricole du Haouz’, Marrakech, Morocco) for its technical help and for access to use the field site. REFERENCES [1] ADA (2009) Green morocco plan. http://www.ada.gov.ma/en/Plan_Maroc_Vert/plan-maroc- vert.php [2] Driouech, F. (2010) Distribution des précipitations hiver- nales sur le Maroc dans le cadre d’un changement cli- matique: Descente d’échelle et incertitudes. Ph.D. Dis- sertation, Institut National Polytechnique de Toulouse, France. [3] Taylor, H.M., Jordan, W.R. and Sinclair, T.R. (1983) Limitations to efficient water use in crop production. American Society of Agronomy, Crop Science Society of America, Soil Science Society of America, Madison, Wisconsin. [4] Musick, J.T., Jones, O.R., Stewart, B.A. and Dusek, D.A. (1994) Water-Yield relationship for irrigated and dryland wheat in the US southern plains. Agronomy Journal, 86, 980-986. doi:10.2134/agronj1994.00021962008600060010x [5] Oweis, T., Pala, M. and Ryan, J. (1998) Stabilizing rain- fed wheat yields with supplemental irrigation and nitro- gen in a Mediterranean climate. Agronomy Journal, 90, 672-681. doi:10.2134/agronj1998.00021962009000050017x [6] El-Rahman, G.A. (2009) Water use efficiency of wheat under drip irrigation systems at Al-Maghara area, North Sinai, Egypt. American-Eurasian Journal of Scientific  M. H. Kharrou et al. / Agricultural Science 2 (2011) 273-282 Copyright © 2011 SciRes. Openly accessible at http://www.scirp.org/journal/AS/ 281281 Research, 5, 664-670. [7] Allen, R.G., Pereira, L.A., Raes, D. and Smith, M. (1998) Crop evapotranspiration. FAO Irrigation and Drainage Paper 56. FAO, Rome. [8] Allen, R.G. (2000) Using the FAO-56 dual crop coeffi- cient method over an irrigated region as part of an evapotranspiration intercomparison study. Journal of Hydrology, 229, 27-41. doi:10.1016/S0022-1694(99)00194-8 [9] Allen, R.G., Pereira, L.S., Smith, M., Raes, D. and Wrigh, J.L. (2005) FAO-56 dual crop coefficient method for es- timating evaporation from soil and application extensions. Journal of Irrigation and Drainage Engineering, 131, 2- 13. doi:10.1061/(ASCE)0733-9437(2005)131:1(2) [10] Hunsaker, D.J., Pinter, P.J. Jr., Kimball, B.A. (2005) Wheat basal crop coefficients determined by normalized difference vegetation index. Irrigation Science, 24, 1-14. doi:10.1007/s00271-005-0001-0 [11] Paço, T.A., Ferreira, M.I. and Conceiçao, N. (2006) Peach orchard evapotranspiration in a sandy soil: Com- parison between eddy covariance measurements and es- timates by the FAO 56 approach. Agricultural Water Management, 85, 305-313. [12] Er-Raki, S., Chehbouni, G., Guemouria, N., Duchemin, B., Ezzahar, J. and Hadria, R. (2007). Combining FAO-56 model and ground-based remote sensing to es- timate water consumptions of wheat crops in a semi-arid region. Agricultural Water Management, 87, 41-54. doi:10.1016/j.agwat.2006.02.004 [13] Er-Raki, S., Chehbouni, A., Hoedjes, J., Ezzahar, J., Duchemin, B. and Jacob, F. (2008) Improvement of FAO-56 method for olive orchards through sequential as- similation of Thermal infrared based estimates of ET. Agricultural Water Management, 95, 309-321. doi:10.1016/j.agwat.2007.10.013 [14] Er-Raki, S., Chehbouni, A., Guemouria, N., Ezzahar, J., Khabba, S., Boulet, G. and Hanich, L. (2009). Citrus or- chard evapotranspiration: Comparison between eddy co- variance measurements and the FAO 56 approach esti- mates. Plant Biosystems, 143, 201-208. doi:10.1080/11263500802709897 [15] Er-Raki, S., Chehbouni, A. and Duchemin, B. (2010a) Combining satellite remote sensing data with the FAO-56 dual approach for water use mapping in irrigated wheat fields of a semi-arid region. Remote Sensing, 2, 375-387. doi:10.3390/rs2010375 [16] Er-Raki, S., Chehbouni, A., Boulet, G. and Williams, D.G. (2010b) Using the dual approach of FAO-56 for parti- tioning ET into soil and plant components for olive or- chards in a semi-arid region. Agricultural Water Man- agement, 97, 1769-1778. doi:10.1016/j.agwat.2010.06.009 [17] González-Dugo, M.P. and Mateos, L. (2008). Spectral vegetation indices for benchmarking water productivity of irrigated cotton and sugarbeet crops. Agricultural Wa- ter Management, 95, 48-58. doi:10.1016/j.agwat.2009.07.003 [18] Liu, Y. and Luo, Y. (2010) A consolidated evaluation of the FAO-56 dual crop coefficient approach using the lysimeter data in the north China plain. Agricultural Wa- ter Management, 97, 31-40. [19] Singh, P.K., Mishra, A.K. and Imtiyaz, M. (1991) Mois- ture stress and the water use efficiency of mustard. Agri- cultural Water Management, 20, 245-253. doi:10.1016/0378-3774(91)90021-A [20] Zhang, H. and Oweis, T. (1999). Water-yield relations and optimal irrigation scheduling of wheat in the Medi- terranean region. Agricultural Water Management, 38, 195-211 doi:10.1016/S0378-3774(98)00069-9 [21] Liang, Y., Kang, S. and Liang, Z. (1998) Crop water production function and water supply model of winter wheat on Loess Plateau of China (in Chinese). Progress in Geography, 17, 55-61. [22] Kang, S., Zhang, L., Liang, Y. and Cai, H. (2002) Effects of limited irrigation on yield and water use efficiency of winter wheat on the Loess Plateau of China. In: McVicar, T.R., Rui, L., Walker, J., Fitzpatrick, R.W. and Chang- ming, L., Eds., Regional Water and Soil Assessment for Managing Sustainable Agriculture in China and Austra- lia, (Monograph No. 84), Australian Centre for Interna- tional Agricultural Research, Canberra, 105-116. [23] Duchemin, B., Hadria, R., Er-Raki, S., Boulet, G., Mai- songrande, P., Chehbouni, A., Escadafal, R., Ezzahar, J., Hoedjes, J., Kharrou, H., Khabba, S., Mougenot, B., Olioso, A., Rodriguez, J.-C. and Simonneaux, V. (2006) Monitoring wheat phenology and irrigation in central Morocco: On the use of relationship between evapotran- spiration, crops coefficients, leaf area index and re- motely-sensed vegetation indices. Agricultural Water Management, 79, 1-27. doi:10.1016/j.agwat.2005.02.013 [24] Rouse, J.W., Haas, R.H., Schell, J.A., Deering, D.W. and Harlan, J.C., (1974) Monitoring the vernal advancement and retrogradation of natural vegetation. NASA/GSFC, Type III, Final report, Greenbelt MD, 1-371. [25] Jackson, R.D., Pinter, P.J., Reginato, R.J. and Idso, S.-B. (1986) Detection of plant stresses for crop management decisions. IEEE Transactions on Geoscience and Remote Sensing, 24, 99-106. doi:10.1109/TGRS.1986.289690 [26] Harris, G. (2004) Irrigation: Water balance scheduling. DPI & FNotes, Department Primary Industries & Fisher- ies, Queensland, 1-6. [27] Hussain, G., Al-Jaloud, A.A., Al-Shammary, S.F. and Karimulla, S. (1995) Effect of saline irrigation on the biomass yield and the protein, nitrogen, phosphorus and potassium composition of alfalfa in a pot experiment. Journal of Plant Nutrition, 18, 2389-2408. doi:10.1080/01904169509365073 [28] Bausch, W.C and Neale, C.M.U. (1989) Spectral inputs improve corn crop coefficients and irrigation scheduling. Transactions of the ASAE, 32, 1901-1908. [29] Gate, P., Bouthier, A. and Monier, J.L. (1992) La tolé- rance à la sécheresse, une réalité à valoriser. Perspectives in Agriculture, 169, 62-67. [30] Debaeke, P., Puech, J., Casals, M.L. and Petibon, P. (1996) Elaboration du rendement du blé d’hiver en con- ditions de déficit hydrique. I. Etude en lysimètres. Agronomie, 16, 3-23. doi:10.1051/agro:19960101 [31] Eck, H.V. (1988) Winter wheat response to nitrogen and irrigation. Agronomy Journal, 80, 902-908. doi:10.2134/agronj1988.00021962008000060013x [32] Howell, T.A., Steiner, J.L., Schneider, A.D. and Evett, S.R. (1995) Evapotranspiration of irrigated winter wheat:  M. H. Kharrou et al. / Agricultural Science 2 (2011) 273-282 Copyright © 2011 SciRes. http://www.scirp.org/journal/AS/Openly accessible at 282 southern high plains. Transactions of the ASAE, 38, 745- 759. [33] Wang, H., Zhang, L., Dawes, W.R. and Liu, C. (2001) Improving water use efficiency of irrigated crops in the north China plain-measurements and modelling. Agri- cultural Water Management, 48, 151-167. doi:10.1016/S0378-3774(00)00118-9 [34] Sun, H.Y., Liu, C.M., Zhang, X.Y., Shen, Y.J. and Zhang, Y.Q. (2006) Effects of irrigation on water balance, yield and WUE of Winter wheat in the north China plain. Ag- ricultural Water Management, 85, 211-218. doi:10.1016/j.agwat.2006.04.008 [35] Zhang, X., Chen, S., Liu, M., Pei, D. and Sun, H. (2005) Improved water use efficiency associated with cultivars and agronomic management in the north China plain. Agronomy Journal, 97, 783-790. doi:10.2134/agronj2004.0194
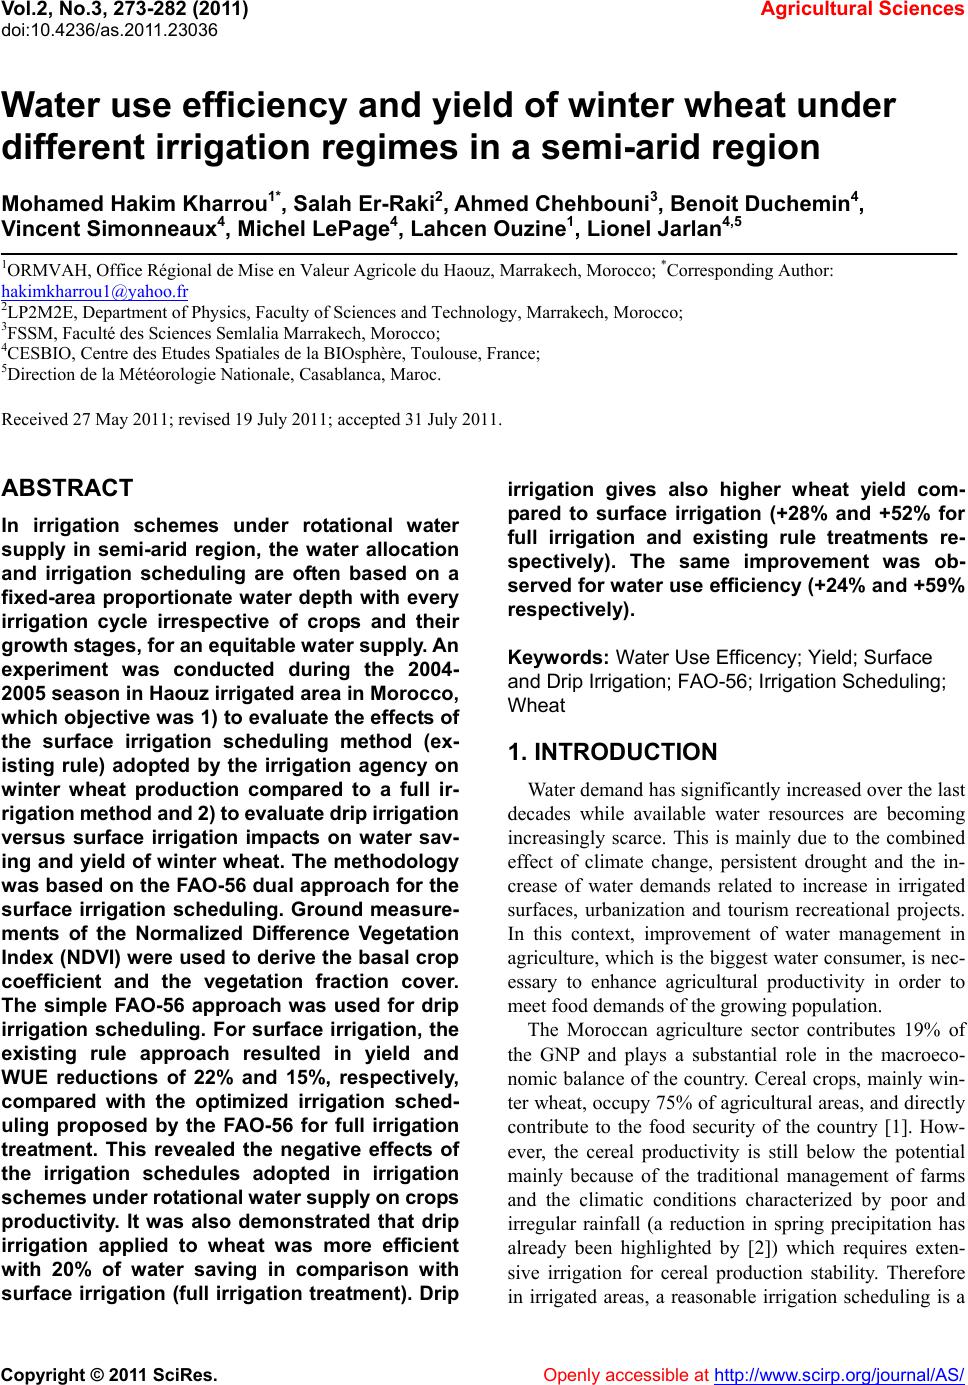
|