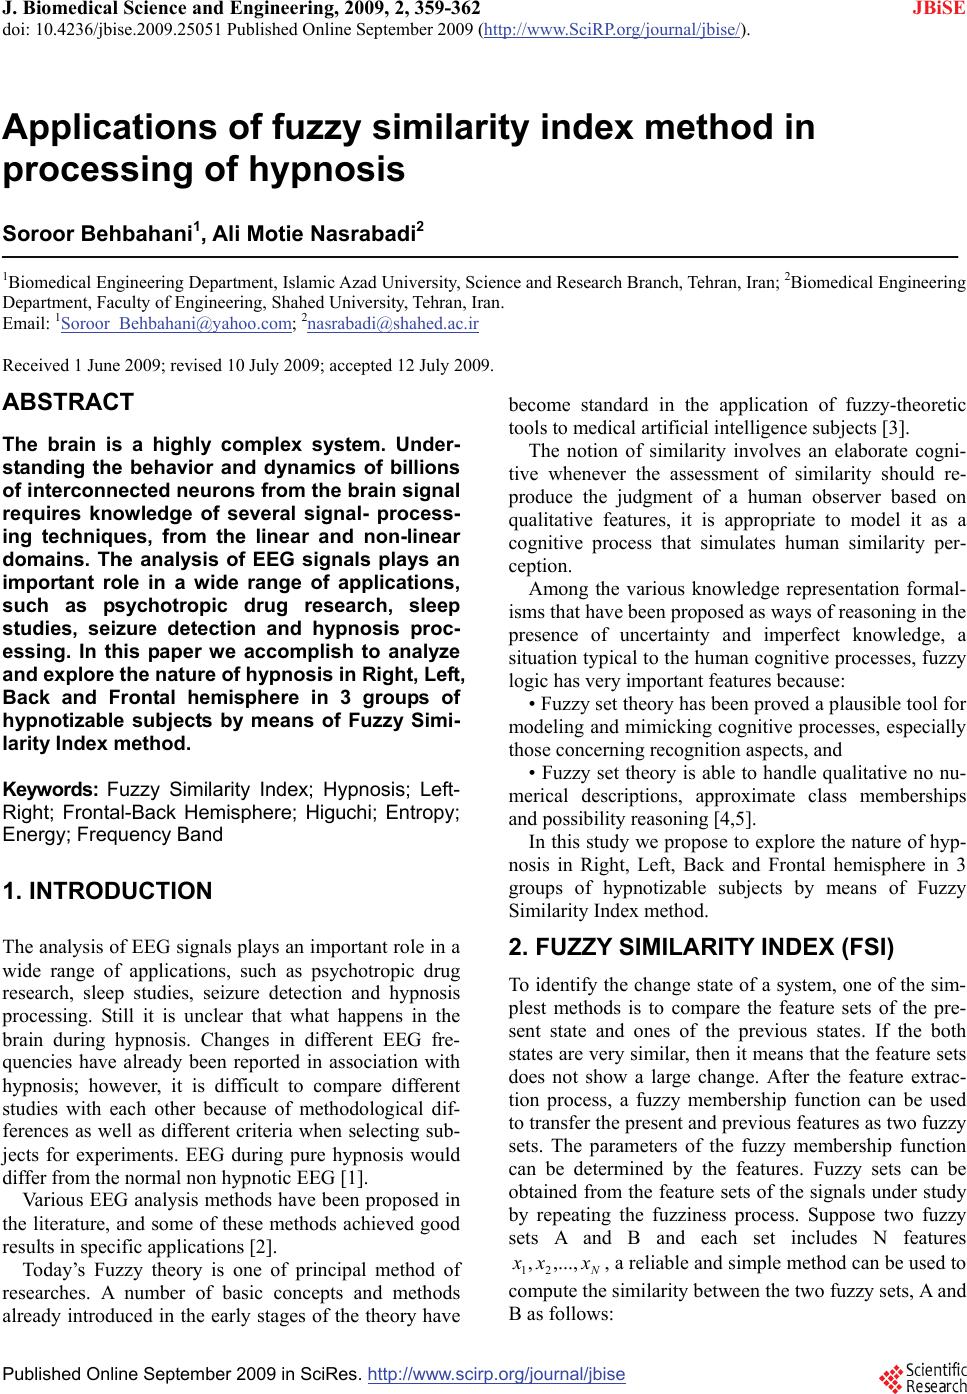
 J. Biomedical Science and Engineering, 2009, 2, 359-362 doi: 10.4236/jbise.2009.25051 Published Online September 2009 (http://www.SciRP.org/journal/jbise/ JBiSE ). Published Online September 2009 in SciRes. http://www.scirp.org/journal/jbise Applications of fuzzy similarity index method in processing of hypnosis Soroor Behbahani1, Ali Motie Nasrabadi2 1Biomedical Engineering Department, Islamic Azad University, Science and Research Branch, Tehran, Iran; 2Biomedical Engineering Department, Faculty of Engineering, Shahed University, Tehran, Iran. Email: 1Soroor_Behbahani@yahoo.com; 2nasrabadi@shahed.ac.ir Received 1 June 2009; revised 10 July 2009; accepted 12 July 2009. ABSTRACT The brain is a highly complex system. Under- standing the behavior and dynamics of billions of interconnected neurons from the brain signal requires knowledge of several signal- process- ing techniques, from the linear and non-linear domains. The analysis of EEG signals plays an important role in a wide range of applications, such as psychotropic drug research, sleep studies, seizure detection and hypnosis proc- essing. In this paper we accomplish to analyze and explore the nature of hypnosis in Right, Left, Back and Frontal hemisphere in 3 groups of hypnotizable subjects by means of Fuzzy Simi- larity Index method. Keywords: Fuzzy Similarity Index; Hypnosis; Left- Right; Frontal-Back Hemisphere; Higuchi; Entropy; Energy; Frequency Band 1. INTRODUCTION The analysis of EEG signals plays an important role in a wide range of applications, such as psychotropic drug research, sleep studies, seizure detection and hypnosis processing. Still it is unclear that what happens in the brain during hypnosis. Changes in different EEG fre- quencies have already been reported in association with hypnosis; however, it is difficult to compare different studies with each other because of methodological dif- ferences as well as different criteria when selecting sub- jects for experiments. EEG during pure hypnosis would differ from the normal non hypnotic EEG [1]. Various EEG analysis methods have been proposed in the literature, and some of these methods achieved good results in specific applications [2]. Today’s Fuzzy theory is one of principal method of researches. A number of basic concepts and methods already introduced in the early stages of the theory have become standard in the application of fuzzy-theoretic tools to medical artificial intelligence subjects [3]. The notion of similarity involves an elaborate cogni- tive whenever the assessment of similarity should re- produce the judgment of a human observer based on qualitative features, it is appropriate to model it as a cognitive process that simulates human similarity per- ception. Among the various knowledge representation formal- isms that have been proposed as ways of reasoning in the presence of uncertainty and imperfect knowledge, a situation typical to the human cognitive processes, fuzzy logic has very important features because: • Fuzzy set theory has been proved a plausible tool for modeling and mimicking cognitive processes, especially those concerning recognition aspects, and • Fuzzy set theory is able to handle qualitative no nu- merical descriptions, approximate class memberships and possibility reasoning [4,5]. In this study we propose to explore the nature of hyp- nosis in Right, Left, Back and Frontal hemisphere in 3 groups of hypnotizable subjects by means of Fuzzy Similarity Index method. 2. FUZZY SIMILARITY INDEX (FSI) To identify the change state of a system, one of the sim- plest methods is to compare the feature sets of the pre- sent state and ones of the previous states. If the both states are very similar, then it means that the feature sets does not show a large change. After the feature extrac- tion process, a fuzzy membership function can be used to transfer the present and previous features as two fuzzy sets. The parameters of the fuzzy membership function can be determined by the features. Fuzzy sets can be obtained from the feature sets of the signals under study by repeating the fuzziness process. Suppose two fuzzy sets A and B and each set includes N features , a reliable and simple method can be used to compute the similarity between the two fuzzy sets, A and B as follows: N xxx ,...,, 21  360 S. Behbahani et al. / J. Biomedical Science and Engineering 2 (2009) 359-362 SciRes Copyright © 2009 JBiSE xx BAS N i iBiA 1 )()(1 ),( (1) where )()(1 iBiA xx can be regarded as the simi- larity degree of fuzzy sets A and B on the features xi. S (A, B) is the average of the similarity degree of fuzzy sets A and B, called fuzzy similarity index. The range of is from 0 to 1, which corresponds to the dif- ferent similarity degree. , means the two signals are identical; otherwise there exist a difference between the two signals [5]. ),( BAS 1),( BAS Decision making is performing in two stages: feature extraction by computing the entropy and energy of each signal and computing fuzzy similarity index of feature sets between the reference EEG signals and the other classes of EEG signals. 2.1. Experimental Data EEG data used in this study was collected by Ali Moti Nasrabadi [6]. The data collected from 32 Right hand subjects, 4 low (below 20 at Stanford scale), 16 medium (between 20-40) and 12 subjects were high (more than 40) hypnotizable. EEG signals are obtained from sub- jects using 19 electrodes placed at fp2,fp1,f8,f4, fz,f3,f7, t4,c4,cz,c3,t3,t6,p4,pz,p3,t5,o2,o1 locations. The elec- trodes are positioned as per the international 10 -20 sys- tem illustrated in Figure 1 [7]. The sampling frequency was 256 Hz. To explore the relation of hypnotizability and similarity of Right–Left and Frontal-Back hemispheres during the hypnosis process between the 3 groups of hypnotizable subjects, 16 and 14 channels of electrodes placed at the fp2,fp1,f8, f4,f3,f7,t4,c4,c3,t3,t6,p4,p3,t5,o2,o1(Right-Left) and fp1, fp2, f3, f4, fz, pz, p3, p4, f8, f7, t6, t5, o1, o2 (Fron- tal-Back) locations was chosen respectively. 3. FEATURE EXTRACTION In this experiment a simple algorithm is used to extract the features from the EEG signals. Although Similarity Figure 1. Electrode positions for data collection (10-20 standard). Index method is usually perform with two features (en- ergy, entropy) we decided to find the best features which could discriminate 3 groups of hypnotizability in Left- Right and Frontal-Back hemispheres during hypnosis. We performed the similarity index method wit 3 kinds of features, at first exam we use the usual features, en- ergy and entropy, at second we use the entropy, Higuchi fractal dimension and at third, entropy, Higuchi and fre- quency band features were used. 3.1. Entropy An entropy measure (Shannon’s entropy) can be calcu- lated directly from the EEG data samples by examining the probability distribution of the amplitudes of the data values: )log( 1 i M i ippSE (2) where, is the number of bin that the amplitudes of the EEG are partitioned into and is the probability associated with the bin. i p th i 3.2. Fractal Dimension Fractal dimension can be used as a feature to show the complexity and self similarity of the signal. It has a rela- tion with entropy, and entropy has a direct relationship with the amount of information inside a signal. Fractal dimension can be interpreted simply as the degree me- andering (or roughness or irregularity) of a signal. Consider be the time sequence to be analyzed. Construct new time series as )(),...,2(),1( Nxxx ),1(x k m x )(),...,2( Nxx kkmN /)mxkmx ((),...,( mxxk m),( km ,..,2,1 For where indicates the initial time value, indicates the discrete time interval between points(delay) and means integer part of a. for each of curves or time series constructed, the average length is computed as m )(Nx a )( kLm ),...,2(),1( xx k m x kkmN imxikmxN kmL KmN /)( )1(()()1( ),( /)( (3) where is the length of time sequence and N kkmNN ]/)int[(1( )(kL k /) is a normalize factor. To- tal average length is computed for all time series having the same delay but different as: m k m mkLkL 1 )()( (4) This procedure is repeated for each ranging from k 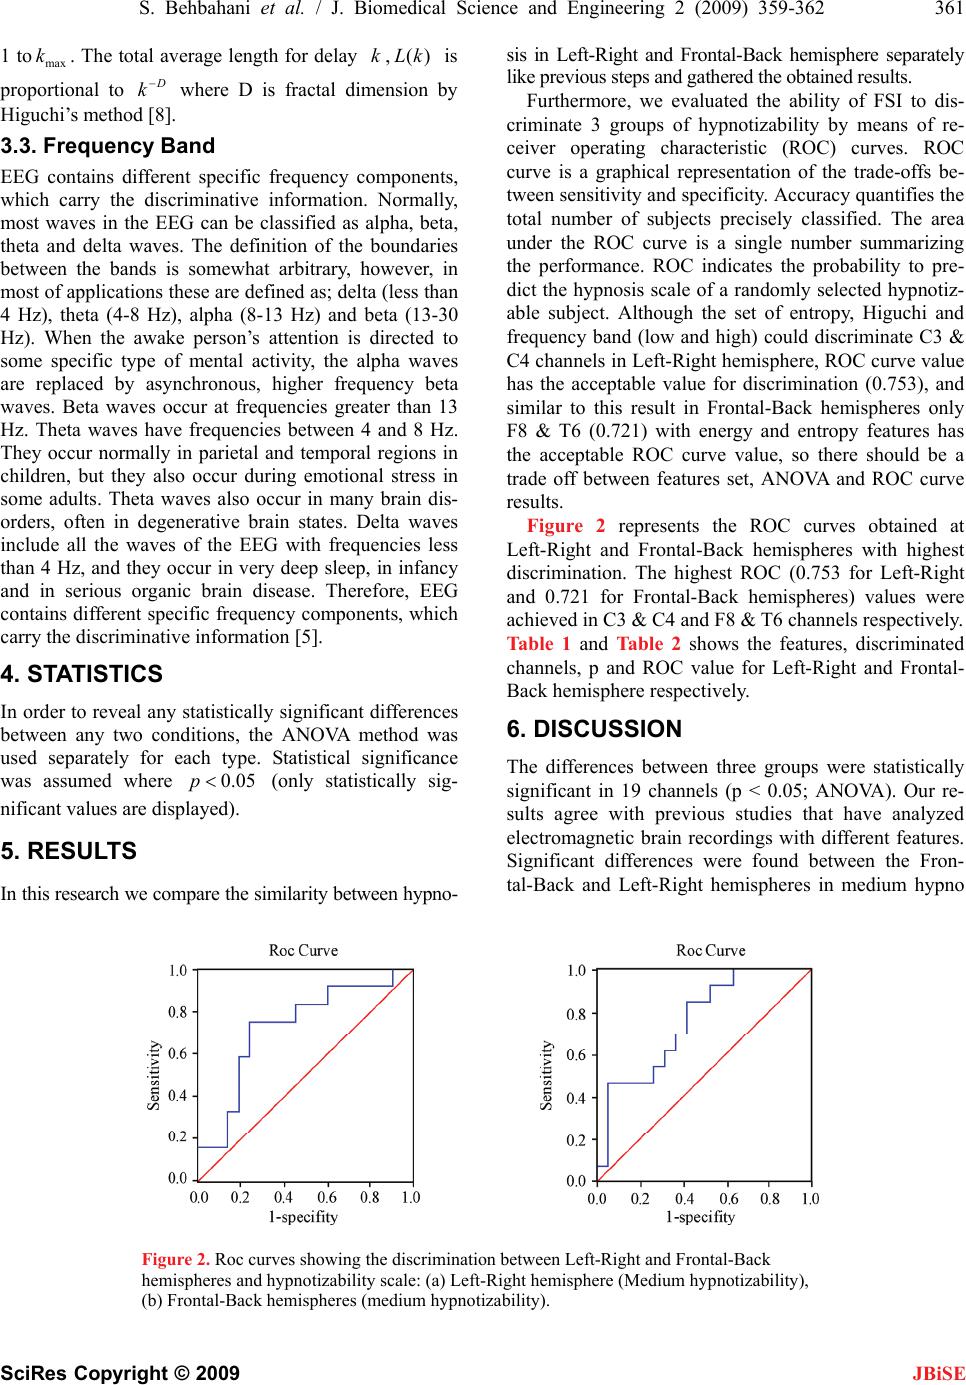 S. Behbahani et al. / J. Biomedical Science and Engineering 2 (2009) 359-362 361 SciRes Copyright © 2009 1 to. The total average length for delay , is proportional to where D is fractal dimension by Higuchi’s method [8]. max kk)( kL D k JBiSE EEG contains different specific frequency components, which carry the discriminative information. Normally, most waves in the EEG can be classified as alpha, beta, theta and delta waves. The definition of the boundaries between the bands is somewhat arbitrary, however, in most of applications these are defined as; delta (less than 4 Hz), theta (4-8 Hz), alpha (8-13 Hz) and beta (13-30 Hz). When the awake person’s attention is directed to some specific type of mental activity, the alpha waves are replaced by asynchronous, higher frequency beta waves. Beta waves occur at frequencies greater than 13 Hz. Theta waves have frequencies between 4 and 8 Hz. They occur normally in parietal and temporal regions in children, but they also occur during emotional stress in some adults. Theta waves also occur in many brain dis- orders, often in degenerative brain states. Delta waves include all the waves of the EEG with frequencies less than 4 Hz, and they occur in very deep sleep, in infancy and in serious organic brain disease. Therefore, EEG contains different specific frequency components, which carry the discriminative information [5]. 3.3. Frequency Band 4. STATISTICS In order to reveal any statistically significant differences between any two conditions, the ANOVA method was used separately for each type. Statistical significance was assumed where (only statistically sig- nificant values are displayed). 05.0p 5. RESULTS In this research we compare the similarity between hypno- sis in Left-Right and Frontal-Back hemisphere separately like previous steps and gathered the obtained results. Furthermore, we evaluated the ability of FSI to dis- criminate 3 groups of hypnotizability by means of re- ceiver operating characteristic (ROC) curves. ROC curve is a graphical representation of the trade-offs be- tween sensitivity and specificity. Accuracy quantifies the total number of subjects precisely classified. The area under the ROC curve is a single number summarizing the performance. ROC indicates the probability to pre- dict the hypnosis scale of a randomly selected hypnotiz- able subject. Although the set of entropy, Higuchi and frequency band (low and high) could discriminate C3 & C4 channels in Left-Right hemisphere, ROC curve value has the acceptable value for discrimination (0.753), and similar to this result in Frontal-Back hemispheres only F8 & T6 (0.721) with energy and entropy features has the acceptable ROC curve value, so there should be a trade off between features set, ANOVA and ROC curve results. Figure 2 represents the ROC curves obtained at Left-Right and Frontal-Back hemispheres with highest discrimination. The highest ROC (0.753 for Left-Right and 0.721 for Frontal-Back hemispheres) values were achieved in C3 & C4 and F8 & T6 channels respectively. Table 1 and Table 2 shows the features, discriminated channels, p and ROC value for Left-Right and Frontal- Back hemisphere respectively. 6. DISCUSSION The differences between three groups were statistically significant in 19 channels (p < 0.05; ANOVA). Our re- sults agree with previous studies that have analyzed electromagnetic brain recordings with different features. Significant differences were found between the Fron- tal-Back and Left-Right hemispheres in medium hypno Figure 2. Roc curves showing the discrimination between Left-Right and Frontal-Back hemispheres and hypnotizability scale: (a) Left-Right hemisphere (Medium hypnotizability), (b) Frontal-Back hemispheres (medium hypnotizability).  362 S. Behbahani et al. / J. Biomedical Science and Engineering 2 (2009) 359-362 SciRes Copyright © 2009 JBiSE Table 1. The features, discriminated channels, p and ROC values for Left-Right Hemispheres. Features Discriminate channels sig.<0.05 ROC Energy, Entropy non non non Entropy, Higuchi non non non Energy, Entropy, Frequency Band(low) C3&C4 0.011 0.753 Energy, Entropy, Frequency Band(high) C3&C4 0.043 0.518 Energy, Entropy, Frequency Band(low & high) non non non Table 2. The features, discriminated channels, p and ROC values for Frontal-Back Hemispheres. Features Discriminate channels sig.<0.05 ROC Energy, Entropy F8&T6 0.042 0.721 Entropy, Higuchi PZ&FZ 0.036 0.389 Energy, Entropy, Frequency Band(low) non non non Energy, Entropy, Frequency Band(high) P4&F4-T5&F7 0.016-0.006 0.198-0.389 Energy, Entropy, Frequency Band(low & high) PZ&FZ 0.031 0.555 tizable subjects. The discriminated channels were ana- lyzed by means of a ROC curve. The highest ROC (0.753 for Left-Right and 0.721 for Frontal-Back hemi- spheres) values were achieved in C3 & C4 and F8 & T6 channels respectively. REFERENCES [1] Fingelkurts, A. A., Kallio, S., and Revonsuo, A. (2007) Hypnosis induces a changed composition of brain oscil- lations in EEG. Contemp. Hypnosis, 24(1), 3–18. [2] Xu, W., Guan, C., Siong, C. E., Ranganatha, S., Thulasi- das, M. and Wu, J., (2004) High accuracy classification of EEG signal, Intl. Conference on Pattern Recognition, 391–394. [3] Andrzejak, R. G., Lehnertz, K., Mormann, F., Rieke, C., David, P., and Elger, C. E., (2001) Indications of nonlin- ear deterministic and finite-dimensional structures in time series of brain electrical activity: Dependence on recording region and brain state. Phys Rev E, 64, 061907. [4] Binaghi, E., Ventura, A. D., Rampini, A., and Schettini, R. (1993) Fuzzy reasoning approach to similarity evaluation in image analysis. International Journal of Intelligent Systems, 8, 749-769. [5] Tolias, Y. A., Panas, S. M., and Tsoukalas, L. H., (2001) Generalized fuzzy indices for similarity matching, Fuzzy Sets and Systems, 120(2), 255-270. [6] Ali Moti Nasrabadi. [7] Domenick, D. G. (1998) International 10-20 electrode placement system for sleep. http://members.aol.com/aduial/1020sys.html. [8] Sabeti, a M., Boostani, a R., Katebi, a S. D., and Price, G. W. (2007) Selection of relevant features for EEG signals classi- fication of schizophrenic patients. 10.1016/j.bspc.03.003. [9] Übeyli, E. D. Fuzzy similarity index for discrimination of EEG signals. EMBS Annual. [10] Gómez, C., et al. (2008) Use of the Higuchi’s fractal dimension for the analysis of MEG recordings from Alz- heimer’s disease patients. Med Eng Phys, doi:10.1016/j. medengphy.06.010. [11] Stam, C. J. (2005) Nonlinear dynamical analysis of EEG and MEG: Review of an emerging field. Clin Neuro- physiol, 116, 2266–301. [12] Accardo, A., Affinito, M., Carrozzi, M., and Bouquet, F. ( 1997) Use of fractal dimension for the analysis of elec- troencephalographic time series. Biol Cybern, 77, 339–50. [13] Kwang, H. L., Song, Y.-S., and Lee, K.-M. (1994) Simi- larity measure between fuzzy sets and between elements, Fuzzy Sets and Systems, 62(3), 291–293.
|