Vol.3, No.8, 490-497 (2011)
doi:10.4236/health.2011.38081
Copyright © 2011 SciRes. Openly accessible at http://www.scirp.org/journal/HEALTH/
Health
Life style of patient before and after diagnosis of
hypertension in Kathmandu
Radha Achary a1, Hom Nath Chalise2*
1Department of Nursing, Kathmandu University School of Medical Sciences, Dhulikhel, Kavre;
2Department of Public Health, Asian College for Advance Studies, Satdobato, Lalitpur; *Cor responding Author: chalisehkpp@gmail.com
Received 20 April 2011; revised 30 May 2011; accepted 18 June 2011.
ABSTRACT
Hypertension is an important public health-
challenge in the developing and the developed
world alike. However, hospital-based studies on
cardiovascular diseases including hypertension
in a developing country like Nepal have been
limited. Objective: The objective of the present
study w as to determine the life style of patients
before and after diagnosis of hypertension. Me-
thods: A total of 100 adult hypertensive pa-
tients over 30 years of age who were attending
in medical out patients department within 6
month to 2 years after first diagnosis of hyper-
tension in Shahid Gangalal National Heart Cen-
tre and Tribhuvan University Teaching Hospital,
in Kathmandu, Nepal, in April 2009, were in-
cluded using a descriptive research design. The
data was collected by interview using a ques-
tionnaire consisting of a combination of struc-
tured and semi- structured questions. The data
was analyzed by using SPSS 11.5 version. Re-
sults: This study found the respondents’
knowledge regarding hypertension was poor.
Regarding life style of hypertensive patients,
majorities (90%) of them were non-vegetarian
before diagnosis but after diagnosis of hyper-
tension the percentage of non-vegetarian was
reduced by 10%. Similarly, the reduction in
consumption of meat, eggs, ghee and oil (mus-
tard, sunflower) by hyperten- sive patients was
statistically significant dif- ference (p = 0.000)
after the diagnosis of hypertension. Regarding
soya- bean oil consumption, additional salty
food and amount of salt intake there was no
statistical significant difference before and after
the diagnosis of hypertension. Likewise,
physical exercise and str ess red ucti on a ctiv ities
performed by hypertensive patients and change
in drinking alcohol and smoking was found to
be statistically significant difference (p = 0.000)
after the diagnosis of hypertension. Conclusion:
The adverse consequences of hypertension can
be reduced by modifying the life sty le. Therefore
more focus should be given in increasing the
awareness about hypertension by developing
information, education and communication ma-
terials on hypertension and setting up hyper-
tensive counseling clinic in each hospitals.
Keywords: Hypertension; Lifestyle; Hypertensive
Patient; Nepal
1. INTRODUCTION
About a quarter of the world’s population have been
estimated to have hypertension at the turn of the millen-
nium. It has remained an important public health chal-
lenge in the developing and the developed world alike.
The burden of chronic conditions such as hypertension
has been likened to an iceberg phenomenon in which the
cases that we see are only a part of the whole problem.
Even within the ‘visible’ portion, there are different
strata of hypertension with or without controlled blood
pressure [1].
Hypertension has become one of the very common
diseases in the modern society. It is the result of the
mental tension and steeping into th e highly sophisticated
life style of the so-called modern society. Besides that
lack of knowledge of the people on their food habit or
diet intake has also played crucial role on the expansion
of the disease. Likewise, increasing pace of urbanization
and industrialization of the developing countries has
contributed significant impact on accelerating the dis-
ease. It can be assumed that there is highly positive cor-
relation between increased number of hypertension and
the pace of modernization [1].
Hypertension is a major health burden and the leading
cause of death in the world. Although hypertension is
more common in economically developed countries than
R. Acharya et al. / Health 3 (2011) 490-497
Copyright © 2011 SciRes. Openly accessible at http://www.scirp.org/journal/HEALTH/
491
in economically developing ones, it is a greater popu-
lation burden in the latter because of the much larger
population. WHO estimated about 62% of cardiovascu-
lar disease and 49% of ischemic heart disease burden
worldwide. Hypertension is estimated to cause 7.1 mil-
lion deaths annually accounting for 13% of all deaths
globally. Overall 26.4% adult world population was esti-
mated to have hypertension in the year 2000, a number
that was projected to increase to 29.2% by 2025 [2].
Certain life style habits, including unhealthy dietary
habits, cigarette smoking and inactivity are risk factors
for cardiovascular disease that in part may be mediated
through effects on blood pressure and body weight.
These life style factors may also be established during
childhood and adolescence, however, their associations
with weight status and blood pressure in childhood and
adolescence are less clear than in adulthood [3].
The main objective of this study was to know what is
the awareness of hypertensive patient about their disease
and life style of patient before and after diagnosis of
hypertension.
2. METHODOLOGY
This is a cross-sectional study. A face to face inter-
view survey method using structured questionnaire was
adopted for this survey.
3. STUDY SITE AND STUDY
POPULATION
This study was co nducted in 2008 in 100 hyp erten sive
patients above 30 years of age in two hospitals namely
Shahid Gangalal National Heart Centre and Tribhuvan
University Teaching Hospital (TUTH) in Kathmandu.
Respondents for this study were patients who were hy-
pertensive since 6 month to 2 years (diagnosed cases of
hypertension) and they were under the treatment regi-
men and who were attended in medical outpatient de-
partment and follow up treatment of hypertension in the
above two hospitals. The patients were selected from
OPD card and according to Diagnosis (isolated hyper-
tension) by the Doctor.
Patients having associated disease like Heart disease,
Kidney disease, Diabetes etc. were excluded. The study
was conducted over a month period from first August to
first September, 200 8.
Purposively 100 respondents were taken as sample for
this study. Among 100 patients, 15 patients were taken
from those who attended TUTH (From 065/4/12 to
065/4/16 Bikram Sambat Nepali Calendar) and 85 from
SGNHC (From 065/4/17 to 065/5/6 Bikram Sambat
Nepali Calendar). Only few patients were taken from
TUTH due to lesser number of hypertensive patients
attending this hospital. For the selection of respondents,
Out Patient Department files of the hypertensive patients
were analyzed. And th e first hundred patients whose file
met the requirement were taken as the sample. All the
patients meeting the criteria were interviewed on first
come first basis till 100 samples were met.
3.1. Ethical Consideration
The study was conducted after receiving approval
from the Thesis Committee of Maharajgunj Nursing
Campus, Tribhuvan University. Before we started our
study a written permission was obtained from the con-
cerned authorities of the selected hospitals fo r this study.
The study respondents were adequately informed and
explained about the purposes of the study. They were
assured of the privacy and confidentiality of the infor-
mation. So, verbal informed consent was obtained before
a respondent was interviewed which is qu ite commo n in
previous stu dy t oo [ 4, 5] .
3.2. Data Analysis
SPSS 11.5 version soft ware was used to analyze the
data. First, distribution in the form of frequencies and
percentages, and measures of central tendency for all
independent and dependent variable were reviewed. Chi-
square test was done to compare the life style modi-
fication before and after diagnosis of hypertension and
p-value < 0.05 was considered as significant.
4. RESULTS
Table 1 shows the socio-demographic characteristics
of the study population. Age distribution of the respon-
dents shows that age ranged from 31 years to 76 years
with mean (SD) age 51.26 (0.78). Similarly, 57% were
male and 43% were female. According to the location of
the respondents, 64% were urban and 36% were from
rural area. Among the four religious groups, 80% re-
spondents were Hindus. Similarly in the ethnic composi-
tion of the respondents, 32% were Newars, 30% Brah-
mins, 15% Mongolian and 7% Terai cast. In the educa-
tional level, 31% were illiterate, 79% were literate among
them 35% had higher secondary and above education
status. As per the occupational distribution of the re-
spondents, 42% fr om house hold work secto r, 25% fro m
service sector, 17% from business and 16% were from
the agriculture sector. Economic status of respondents
was measured on the basis of food sufficiency to eat.
10% respondents do not have sufficient food for a year,
60% have sufficient for a year and 30% respondents
have some saving also. Duration of Hypertension shows
that majority of the respond ents were suffering from one
to two year and 20% were suffering from six to one year.
R. Acharya et al. / Health 3 (2011) 490-497
Copyright © 2011 SciRes. Openly accessible at http://www.scirp.org/journal/HEALTH/
492
Table 1. Socio-demographic characteristics of the hypertensive
patients (n = 100).
Variables Number Percent
Age Group
31 - 40 18 18
41 - 50 34 34
51 - 60 25 25
Above 60 23 23
Mean age 51.26 (minimum 31 maximum 76)
Sex
Male 57 57
Female 43 43
Marital Status
Unmarried 2 2
Married 91 91
Widow 7 7
Residence
VDC 36 36
Municipality 64 64
Religion
Hindu 80 80
Buddhist 14 14
Christian 4 4
Kirant 2 2
Ethnicity
Brahmin 30 31
Chhetri 16 16
Newar 32 32
Mongolian 15 15
Teraicastes(Shah, Gup-
ta, Chaudhary) 7 7
Educational Status
Illiterate 31 31
Literate(Non formal
education) 10 10
Primary 8 8
Secondary 16 16
Higher secondary and
above 35 35
Occupation
Agriculture 16 16
Business 17 17
Service 25 25
House hold work 42 42
Economic Status
Not sufficie nt to eat for
1 year 10 10
Sufficient to eat for 1
Year 60 60
Extra saving 30 30
Family Type
Nuclear 53 53
Joint 31 31
Extended 16 16
Duration of Hypertension
6 month - 1 years 20 20
1 year - 2 years 80 80
The respondents were asked about hypertension but
they have poor kno wledge regarding its causes, sign and
symptoms, control measure and complications. Among
the total respondents 31% answered excessive salt and
fat intake as the factors leading to disease occurrence
followed by stress/tension (24%), smoking/alcohol (10%)
and five percent answered over weight and heredity
(Table 2). Further 55% respondents answered main
symptoms of hypertension was dizziness (55%) followed
by Headache (47%), Fatigue (18%), Palpitation (8%),
Blurred vis io n ( 7%), and Flushing face (6% ).
Out of total respondents, majority (63%) of the re-
spondents reported that taking medicine can help the
control of blood pressure. Similarly, 49% respondents
reported taking low salt and low fat diet is to control
blood pressure. Few (3%) of them reported weight re-
duction can help to control the blood pressure (Table 3).
Regarding the complication related with hypertension
42% respondents reported heart attack followed by pa-
ralysis (26%), kidney disease (15%), stroke (10%) and
blindness (5%) (Table 3).
Regarding the food habit of respondents, majorities
(90%) of respondents were non-vegetarian and only 10%
were vegetarian before diagnosis, whereas after diagno-
sis of hypertension, vegetarian were found to have in-
creased from 10% to 20%, which is not shown here in
the table.
Table 4 shows the change in frequency of meat and
eggs consumed by non-vegetarian after diagnosis of hy-
pertension. Majority of respondents (81%) used to take
mutton before diagnosis and it reduced to 59% after di-
agnosis. After diagnosis of hypertension, daily consum-
ers reduced from 17% to 5% and weekly consumers
from 42 to 18 where as occasional consumers increased
from 22% to 30%. Similarly pork consumers declined
from 16 to 8%, chicken consumers declined from 76%
Table 2. Awareness on symptoms and factors that may lead to
hypertension (n = 100).
Symptoms/factors Number (%)
Symptoms
Dizziness 55 (55)
Headache 47 (47)
Fatigue 18 (18)
Epistaxis 2 (2)
Blurred vision 7 (7)
Palpitation 8 (8)
Flushing face 6 (6)
Disease causing factors
Over weight 5 (5)
Heredity 5 (5)
Smoking/alcohol 10 (10)
Excessive salt and fat intake 31 (31)
Stress/tension 24 (24)
R. Acharya et al. / Health 3 (2011) 490-497
Copyright © 2011 SciRes. Openly accessible at http://www.scirp.org/journal/HEALTH/
493
Table 3. Awareness on complication and control measure of
hypertension, n = 100.
Complication and awareness Number (%)
Complications of Hypertension
Heart attack 42 (42)
Kidney disease 15 (15)
Blindness 5 (5)
Stroke 10 (10)
Other (paraly sis) 26 (26)
Control measures
Reducing weight 3 (3)
Low salt and low fat diet 49 (49)
Stop smoking 11 (11)
Regular exercise 27 (27)
Reducing stress 22 (22)
Taking medicine 63 (63)
Table 4. Type of meat and eggs consumed by respondents (n =
90).
Varia bles Frequency of consumption Chi-square
p-value
Type of
Meat Daily Weekly Occasionally Total
Mutton
Before
diagnosis 17
(19%) 42 (47%) 22 (24%) 81 (90%)
After
diagnosis 5 (6%) 18 (20%) 30 (33%) 53(59%) 0.000
Pork
Before
diagnosis 1 (1%) 5 (6%) 8 (9%) 14(16%)
After
diagnosis - 2 (3%) 5 (6%) 7(8%) 0.000
Chicken
Before
diagnosis 26
(29%) 38 (42%) 12 (13%) 76(84%)
After
diagnosis 15
(17%) 32 (36%) 21 (23%) 68(76%) 0.000
Fish
Before
diagnosis - 6 (7%) 16 (18%) 22(24%)
After
diagnosis - 5 (6%) 12 (13%) 17(19%) 0.000
Eggs
Before
diagnosis 35
(39%) 24 (27%) 26 (29%) 85(94%)
After
diagnosis 14
(16%) 25 (28%) 25 (28%) 64(71%) 0.000
to 68%, fish consumption from 22% to 17% and egg
from 94% to 71%. The table also shows the frequency
item consumption also declined after the diagnosis of
hypertension. The change in food pattern after the diag-
nosis of hypertension was statistically significant (P-
value = 0.000).
Table 5 shows the changing pattern of oil and ghee
consumed by the respondents after diagnosis of hyper-
tension. Majority (79%) of respondents used animal
ghee before diagnosis. After diagnosis of hypertension
daily users were found to have shifted occasional and
non users. Hence, non users found increased from 21%
to 67% after diagnosis. Similarly vegetable ghee users
also changed from occasion to non-users after the diag-
nosis of hypertension.
Most of the respondents used mustard oil before di-
agnosis of hypertension. After the diagnosis of hyperten-
sion the daily users reduced from 76% to 41% and
weekly and occasional users shifted to non users. After
the diagnosis of hypertension 59% discontinued the
mustard oil.
The number of soybean oil consumers before diagno-
ses were 18% and after diagnosis increased from 18% to
26% in daily users. Very few respondents were occa-
sional users. The use of soybean oil shows insignificant
association (p-value = 0.281) with change in oil consum-
ption after the diagnosis of hypertension.
Out of total respondents, only 5% respondents used
sunflower oil daily and the number of daily user sharply
increased from 5% to 29% after diagnosis of hyperten-
sion. There was statistically significant increase in the
consumption of sunflower oil after the diagnosis of hy-
pertension.
Out of total respondents, majority (54%) had taken
normal (as usual) salt, 41% were found taking additional
or above normal and only 5% were taking low salt be-
fore diagnosis. But after diagnosis, majority (65%) had
taken low salt, 33% usual and 2% had taken additional
salt. The change in the amount of consumption of salt
after the diagnosis was not statistically significant (p =
0.431) (Table 6).
Additional salty food comprises papad, bottle pickle
and potatochips/dalmoth etc. Out of total respondents,
76% were found to be using additional salty food before
diagnosis and 60% still used it after the d iagnosis. There
was no statistically significant difference in consumption
of additional salty food after the diagnosis.
Ta b l e 7 shows the smoking and alcohol consumption
of respondents before and after diagnosis of hyperten-
sion. Out of total respondents 44% smoked before diag-
nosis and it reduced to 35% after diagnosis of hyperten-
sion. There was statistically significant difference (p =
0.000) in smoking habit after the diagnosis of hyperten-
sion. After diagnosis of hypertension many respondents
decreased the frequency of smoking. Similarly 60% re-
spondents consumed alcohol before diagnosis. Among
them daily users were 33%, weekly 3% and occasional
users were 24%. However, 70% respondents did not
consume alcohol after the diagnosis of hypertension.
Only 12% responden ts consumed alcohol daily, 4% weekly
R. Acharya et al. / Health 3 (2011) 490-497
Copyright © 2011 SciRes. Openly accessible at http://www.scirp.org/journal/HEALTH/
494
Table 5. Type of ghee and oil consumed by respondents, (n = 100).
Frequency of consumption
Type of Ghee/Oil Daily Weekly Occasionally Non-user Chi-square p-value
Ghee (animals)
Before diagnosis 57 (57%) - 22 (22%) 21 (21%)
After diagnosis 15 (15%) - 18 ( 18%) 67 (67%) 0.008**
Ghee (vegetables)
Before diagnosis 1 (1%) - 14 (14%) 85 (85%)
After diagnosis - - 3 (3%) 97 (97%)
0.028*
Mustard Oil
Before diagnosis 76 (76%) 2 (2%) 22 (22%) 100%
After diagnosis 41 (41%) - - 59 (59%)
0.013**
Soyabean Oil
Before diagnosis 18 (18%) - 3 (3%) 79 (79%)
After diagnosis 26 (26%) - 2 (2%) 72 (72%)
0.281
Sunflower Oil
Before diagnosis 5 (5%) - 1 (1%) 94 (94%)
After diagnosis 29 (29%) 2 (2%) 3 (3%) 66 (66%)
0.038*
Butter
Before diagnosis 1 (1%) 1 (1%) 10 (10%) 88 (88%) 0.000**
After diagnosis - - 3 (3%) 97 (97%)
** Significant at 0.01 level *Significant at 0.05 level.
Table 6. Amount of salt taken by hypertensive respondents (n = 100).
Amount of sal t intake Lo w Normal Additional
Before diagnosis 5 (5%) 54 (54%) 41 (41%)
After diagnosis 65 (65%) 33 (33%) 2 (2%)
P-Value
0.431
Table 7. Smoking and alcohol consumption habit of respondents.
Smoking and drinking Yes No P-Value
Smoking
Before diagnosis 44 (44%) 56 (56%)
After diagnosis 35 (35%) 65 (65%) 0.000
Drinking
Before diagnosis 60 (60%) 40 (40%)
After diagnosis 30 (30%) 70 (70%) 0.000
and 14% were taking it occasionally. The overall trend
of the alcohol intake seems notably declining over the
incidence in terms of both amount and frequency of in-
take although it is not shown here in detail. There was
statistically significant (p = 0.000) reduction in consum-
ption of alcohol before and after diagnosis of hyperten-
sion.
Physical exercise and stress reduction activities are
important to control the hypertension. Out of total re-
spondents, 23 h ad done physical exercise b efore diagno-
sis of hypertension. But after diagnosis; the number in-
creased from 23% to 47%. Similarly, very few 11 re-
spondents had stress reduction activities before the di-
agnosis of hypertension and their number increased re-
markably from 11% to 39% after diagnosis of hyperten-
sion. There was statistically significant (p = 0.000) in-
crease in performance of physical exercises and stress
reduction activities after the diagnosis of hypertension
(Table 8).
5. DISCUSSION
Hypertension is one of the most common disease af-
fecting humans worldwide. Hypertension is the risk fac-
tor for coronary heart disease, stroke, congestive heart
failure, end-stage renal disease, and peripheral vascular
disease. Thus it has become a challenge for the health
R. Acharya et al. / Health 3 (2011) 490-497
Copyright © 2011 SciRes. http://www.scirp.org/journal/HEALTH/Openly accessible at
495
Table 8. Physical exercises and stress reduction activity per-
formed by respondents.
Control measures Yes No P-Value
Physical exercise
Before diagnosis 23 (23%) 77 (77%)
After diagnosis 47 (47%) 53 (53%) 0.000
Stress reduction activity
Before diagnosis 11 (11%) 8 9 (89%)
After diagnosis 39 (39%) 61 (61%) 0.015
care professionals to identify and treat this disease.
This study used adult hypertensive patients above
30 yrs of age from two hospital of Kathmandu. Mean
age of the respondents was 51.26 (±0.78) years. Male
patients (57%) exceeded female patients. Similarly, ma-
jority patients belonged to nuclear family and had suffi-
cient resources to eat for a year, but majority of them
had no savings.
Men tend to display higher blood pressure than women,
more evident in young and middle-age. This corresponds
to the incidence and prevalence of hypertension in Nepal,
as majority of hypertension is found to affect middle
adult population. The prevalence of hypertension and the
blood pressure levels increased with age in both men and
women [6].
According to the location of the case, urban residents
(64%) were more vulnerable to hypertension than rural
residents (36%). An epidemiological study by Gupta and
Sharma (2007), showed similar result with 25% urban
and 10% rural subjects in India had hypertension. In
developed countries prevalence of hypertension has been
noted high in lower socio-economic groups whereas in
societies with transitional state of economy high preva-
lence of hypertension has been noted [7].
The findings of the present study also suggest that
hypertensive patients are not sufficiently aware about
hypertension regarding its causes, signs and symptoms,
control measures and complications. Familoni (2005)
studied on knowledge and awareness of hypertension
among patients with systemic hypertension in Nigeria
which showed inadequate knowledge of hypertension in
patients with hypertension in Nigeria. Among 254 pa-
tients, only one third knew that hypertension should be
treated for life while 58.3% believed that antihyperten-
sive drugs should b e used only when there is a symptom
[8].
Sharma et al. (2006) studi ed of prevalence, awareness,
and control of hypertension in a suburban area of Kath-
mandu, Nepal. This study showed prevalence of hyper-
tension is significant in Nepal and awareness, treatment
and control rates are poor [9]. Another study carried out
by Dong et al. (2007) in China also showed high preva-
lence of hypertension in rural adults in north east China
with low rate of awareness and control [10].
The result of this study shows majority (90%) of re-
spondents were non-vegetarian before diagnosis, whereas
after the diagnosis of hypertension vegetarian were fou-
nd to have increased from 10% to 20%. The change in
food pattern after the diagnosis was statistically sig- ni-
ficant (p = 0.000). Many literatures have been pub-
lished supporting the usefulness of vegetarian diet for
the hypertensive patients. A research study done by Lin-
dhal (2006) found that vegetarian diet was extremely
beneficial for h yp er t en sive patients [11].
The consumption habit of non vegetarian items such
as mutton, buff, pork, chicken, fish and eggs were taken
into account while co llecting the data. Th ere was a sharp
reduction in the consumption of meat items after diag-
nosis of hypertension. There was statistically significant
decline in consumption of meat and eggs after the diag-
nosis of hypertension.
The study by Guba& Lincoln, 2008, The Dietary Ap-
proaches to Stop Hypertension (DASH) diet is a diet rich
in fish, chicken, lean meat, low-fat dairy, fruits, vegeta-
bles, whole grains, legumes, nuts, and seeds. In a high-
quality randomize control trials the DASH diet lowered
SBP for hypertensive patients by an average of 11 mm
Hg and DBP by an average of 5.5 mm Hg compared
with the control group [12].
According to study by MacGregor (2003) it was esti-
mated that a reduction of 3 g/d in salt intake would
lower blood pressure by 2.5/1.4 mmHg, which would
reduce strokes by 12 to 14% and ischaemic heart disease
by 9% to 10% and could prevent about 7,300 to 8,300
stroke deaths and 10,600 to 12,400 ischemic heart di-
sease deaths in the UK per year [13].
The number of respondents drinking alcohol declined
to 30% from 60%. The trend of the alcohol intake nota-
bly declined over the period both in terms of amount and
frequency of intake. A study (WHO, 2006) observed a
consistent association between alcohol intake and high
blood pressure. There was statistically significant dif-
ference in consumption of alcohol before and after di-
agnosis of hypertension. Out of total respondents, 44%
had a habit of smoking before diagnosis. But after diag-
nosis of hypertension 9% of them changed their habit.
As a result the number of smokers declined to 35%.
There was no statistically significant difference in num-
ber of sticks used by the smoker after the diagnosis of
hypertension.
Physical factors have been taken as one of the associ-
ated factors for the hypertension. After the diagnosis of
hypertension, the number of respondents doing physical
R. Acharya et al. / Health 3 (2011) 490-497
Copyright © 2011 SciRes. Openly accessible at http://www.scirp.org/journal/HEALTH/
496
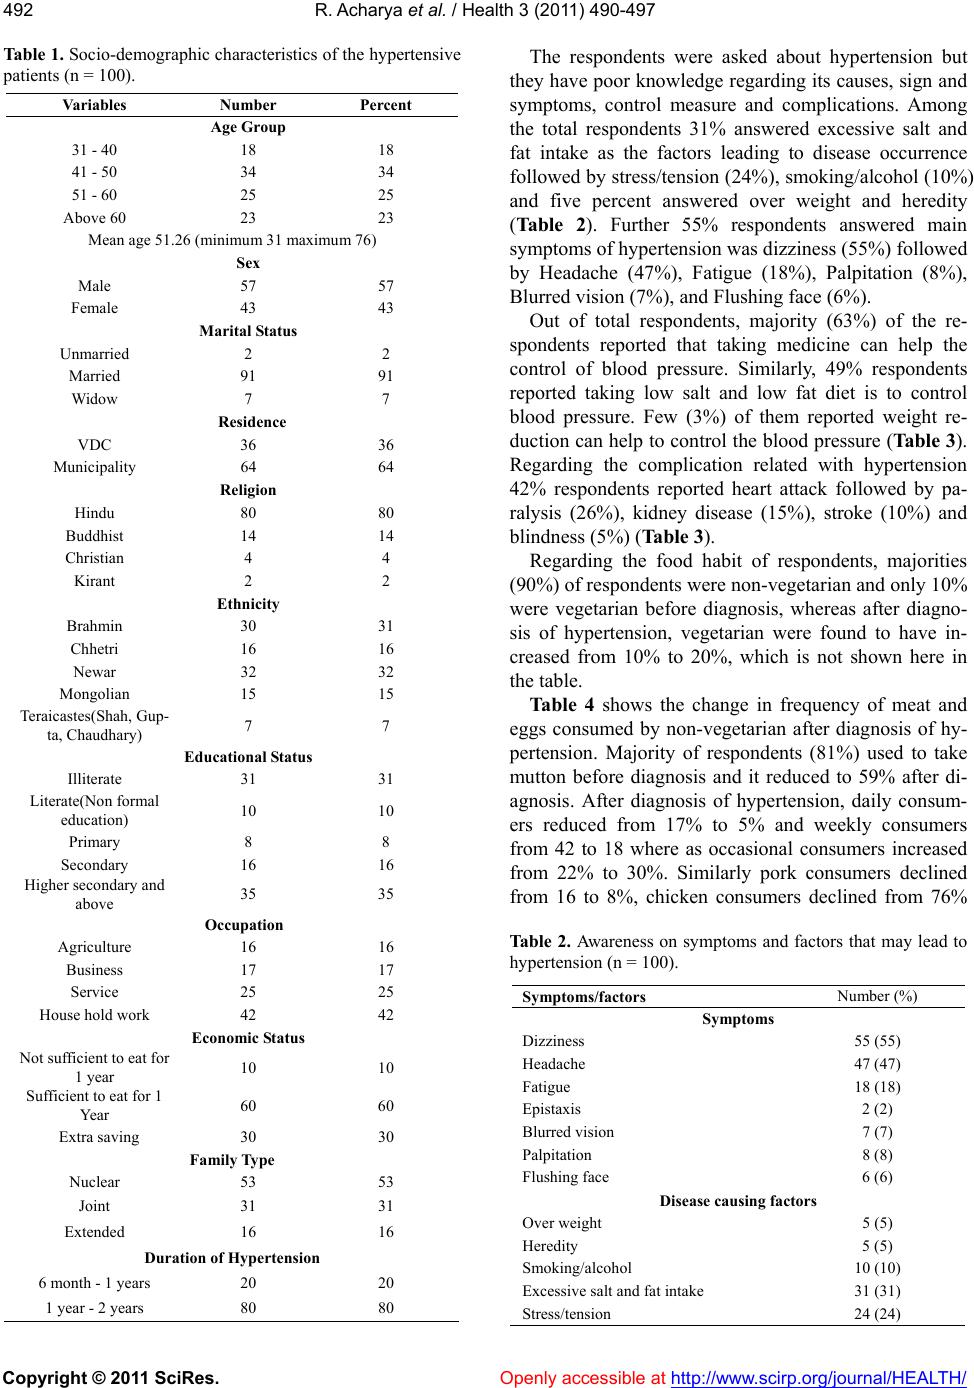
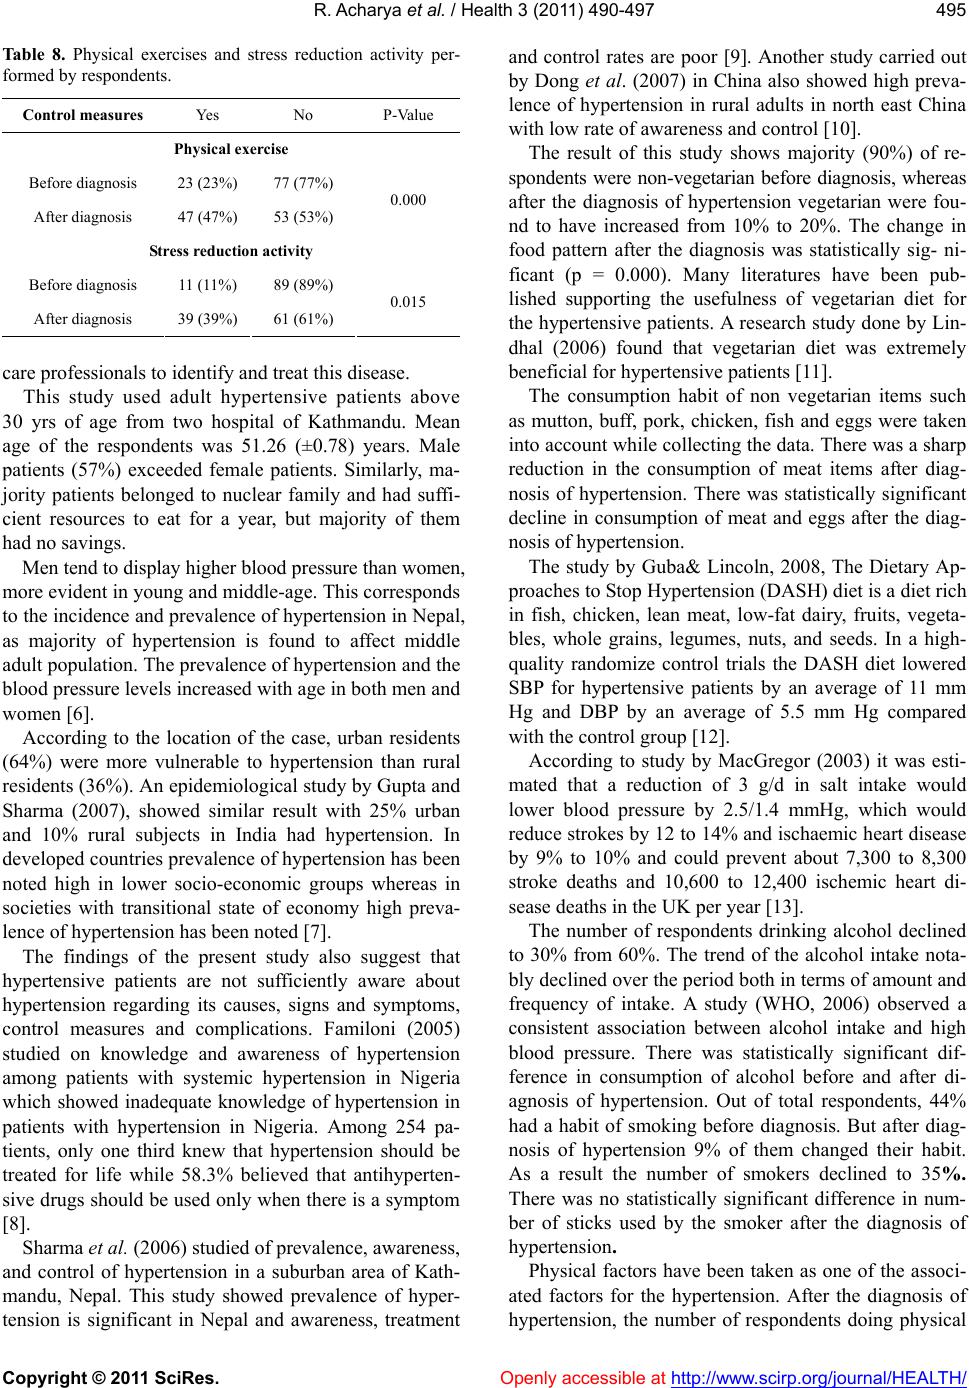
exercise increased to 47% from 23%. Similar findings
were also reported by Regmi (2008). He found that
walking an hour per day at the rate of 4km/hour to be an
effective exercise for reducing hypertension [14].
Another study (WHO, 200 6) also showed that there is
an inverse relationship between an aerobic physical ac-
tivities and blood pressure. Regular aerobic physical
activity has been demonstrated to be beneficial both for
prevention and treatment of hypertension [15]. In this
study very few respondents had gone through stress re-
duction activities before diagnosis but after that number
increased to 39%.There was statistically significant dif-
ference between change in performance of physical ex-
ercises and stress reduction activities after the diagnosis
of hypertension.
6. THE LIMITATIONS OF THE STUDY
The result of the study does not represent the whole
population because it is a small scale hospital based
study limited to the patients coming to TUTH and Sha-
hid Gangalal National Heart Centre during the short pe-
riod of data collection. The sample size also not esti-
mates by calculating formula. Hence the results may not
be generalized. This study was not designed randomly;
hence this might possibly affect the results. There might
be recall bias for questions asking about past life style
(especially if diagnosed quite earlier). Regarding meat,
oil/ghee and salt consumption, amount was not included
in the questionnaire. Similarly time was not specified for
physical exercise.
7. CONCLUSIONS
From this study, the awareness of hypertensive pa-
tients about their disease wa s found to be very poor. Re-
garding the change in life style, there was statistically
significant difference on the type of food consumption
including meat, eggs, ghee and oil. However there was
no significant difference in soyabean oil consumption,
additional salty food and amount of salt intake after the
diagnosis of hypertension. There was statistically sig-
nificant difference in certain types of physical exercises
as swimming/cycling and yoga but not in walking, jog-
ging/jumping and meditation. Similarly, there was statis-
tically significant difference in consumption of alcohol
and smoking habit.
Hence, it can be concluded that the awareness level of
hypertensive patients is still low. The modification of life
style is satisfactory for most risk factors, except for few
like salt intake, additional salty food and number of
sticks of cigarettes smoking. So Focus should also be
given on modification of lifestyle for reducing the ad-
verse consequences of hypertension. This can be done
by: Mobilizing the key informants’ e.g. political leader,
social workers for public awareness, Broadcasting pro-
gram and information regarding hypertension, Develop-
ing IEC (Information, Education and Communication)
material (e.g. pamphlet, poster) which helps in prevent
and control of hypertension and Setting up a hyperten-
sion-counseling clinic in each hosp ital to be launched by
the trained nurses.
REFERENCES
[1] Eliot, H.L. and Esbensen, B.A (2003) Blood pressure,
life style and treatment. Journal of Hypertension, 13,
1093-1099.
[2] Gupta, R. and Singh, N. (2006) Meta-analysis of preva-
lence of hypertension in India. Indian Heart Journal, 10,
465-472.
[3] Biel, K. (2008) Hypertension and stroke in Asia: Preva-
lence, control and strategies in developing countries.
Journal of Human Hypertension, 22, 441-443.
[4] Chalise, H.N., Saito, T. and Kai, I. (2010) Social support
and its correlation with loneliness: A cross-cultural study
of Nepalese older adults. International Journal of Aging
and Human Development, 71, 115-137.
doi:10.2190/AG.71.2.b
[5] Chalise, H.N., Saito, T., Takahashi, M. and Kai, I. (2007)
Relationship specialization amongst sources and recei-
vers of social support and its correlations with loneliness
and subjective well-being: A cross-sectional study of
Nepalese older adults. Archives of Gerontology and
Geriatrics, 44, 299-314.
doi:10.1016/j.archger.2006.07.001
[6] Sarraf-Zadegan, N., Boshtam, M., Mostafavi, S. and
Rafiei, M. (1999) Prevalence of hypertension and associ-
ated risk factors in Isfahan, Islamic Republic of Iran.
Eastern Mediterranean Health Journal, 5, 993-1001.
[7] Gupta, R. and Sharma, A.R. (2007) Prevention of hyper-
tension and subtypes in an Indian Rural population:
Clinical and electrocardiographic correlates. Indian He-
art Journal, 8, 823-829.
[8] Familoni, B. (2005) Knowledge and awareness of hyper-
tensionamong patients with systemic hypertension in
Nigeria. Journal of Clinical Hypertension, 21, 450-462.
[9] Sharma Dewakar, K.C., et al. (2006). Study of preva-
lence, awareness, and control of hypertension in a sub-
urban area of Kathmandu, Nepal. Indian Heart Journal,
58, 34-37.
[10] Dong, G.H. and Sun, Z.Q. (2007) Awareness, treatment
and control of hypertension in rural adults of China. Jou-
rnal of Hypertension Residence, 30, 951-958.
doi:10.1291/hypres.30.951
[11] Lindhal, R.S. (2006) Vegetarian diet for hypertensive
patient. New England Journal of Medicine, 330, 1530-
1533
[12] Guba, E.G. and Lincoln, Y.S. (2008) Hypertension the
role of diet and lifestyles. Journal of Human Hyperten-
sion, 15, 235-251.
[13] MacGregor, D.E. (2003) How far should salt intake be
R. Acharya et al. / Health 3 (2011) 490-497
Copyright © 2011 SciRes. Openly accessible at http://www.scirp.org/journal/HEALTH/
497
reduced? Recommendation on dietary salt. American
Journal of Medical Association, 28, 59-64.
[14] Regmi, S. (2008) Detection of individuals prone to de-
velop hypertension in the future life. Journal of Nepal
Medical College, 10, 33-37.
[15] World Health Organization (2006) Focus in priorities,
WHO report, 2005. www.who.org