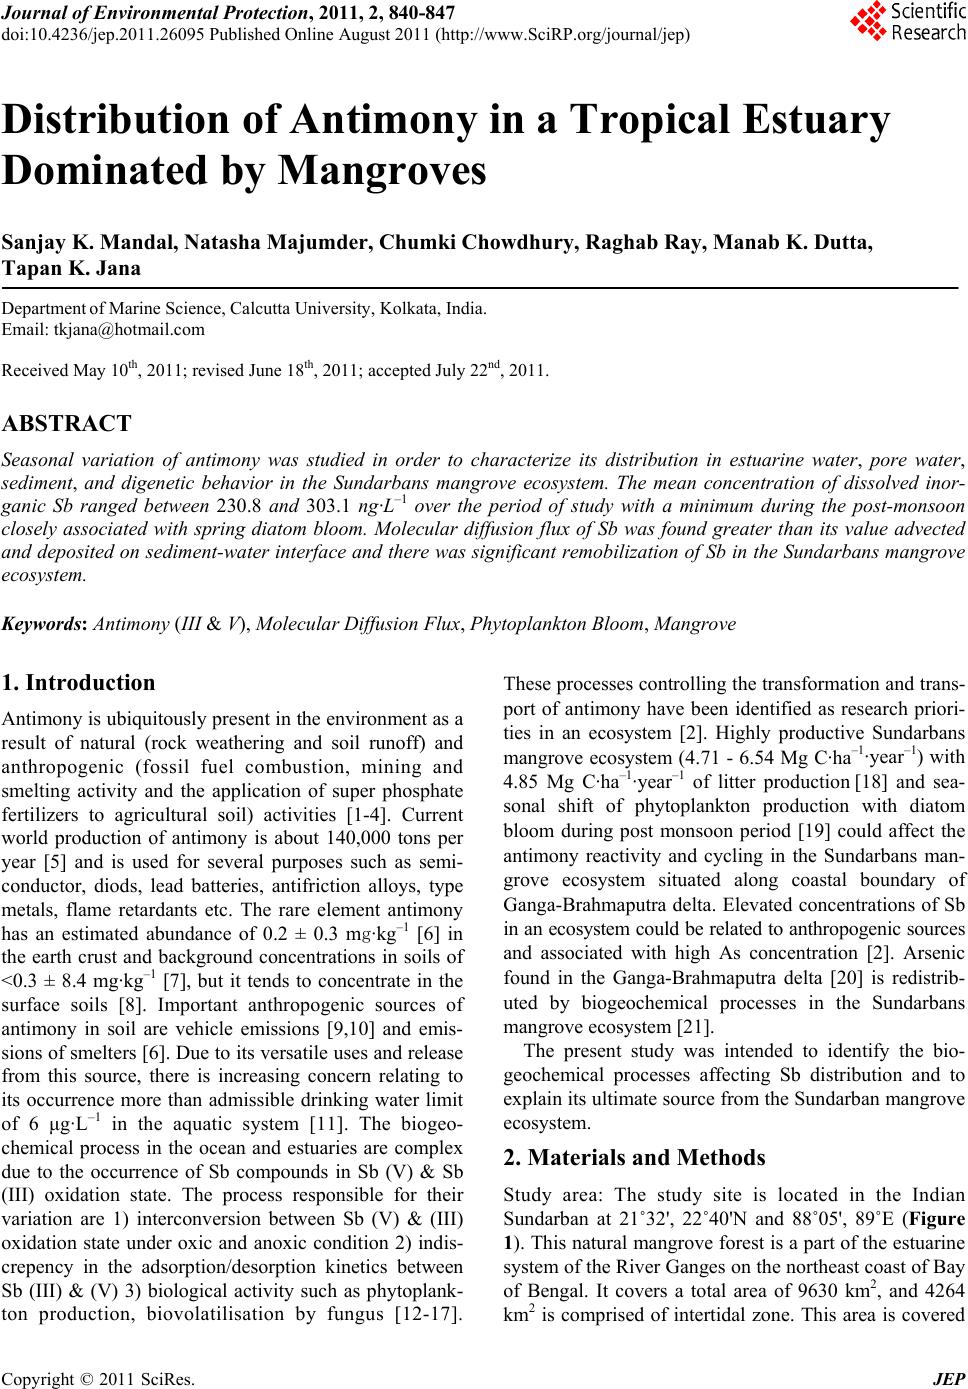
 Journal of Environmental Protection, 2011, 2, 840-847 doi:10.4236/jep.2011.26095 Published Online August 2011 (http://www.SciRP.org/journal/jep) Copyright © 2011 SciRes. JEP Distribution of Antimony in a Tropical Estuary Dominated by Mangroves Sanjay K. Mandal, Natasha Majumder, Chumki Chowdhury, Raghab Ray, Manab K. Dutta, Tapan K. Jana Department of Marine Science, Calcutta University, Kolkata, India. Email: tkjana@hotmail.com Received May 10th, 2011; revised June 18th, 2011; accepted July 22nd, 2011. ABSTRACT Seasonal variation of antimony was studied in order to characterize its distribution in estuarine water, pore water, sediment, and digenetic behavior in the Sundarbans mangrove ecosystem. The mean concentration of dissolved inor- ganic Sb ranged between 230.8 and 303.1 ng·L–1 over the period of study with a minimum during the post-monsoon closely associated with spring diatom bloom. Molecular diffusion flux of Sb was found greater than its value advected and deposited on sediment-water interface and th ere was significant remob ilization of Sb in the Sundarbans man grove ecosystem. Keywords: Antimony (III & V), Molecular Diffusion Flux, Phytoplankton Bloom, Mangrove 1. Introduction Antimony is ubiquitously present in the environment as a result of natural (rock weathering and soil runoff) and anthropogenic (fossil fuel combustion, mining and smelting activity and the application of super phosphate fertilizers to agricultural soil) activities [1-4]. Current world production of antimony is about 140,000 tons per year [5] and is used for several purposes such as semi- conductor, diods, lead batteries, antifriction alloys, type metals, flame retardants etc. The rare element antimony has an estimated abundance of 0.2 ± 0.3 mg·kg–1 [6] in the earth crust and background concentrations in soils of <0.3 ± 8.4 mg·kg–1 [7], but it tends to concentrate in the surface soils [8]. Important anthropogenic sources of antimony in soil are vehicle emissions [9,10] and emis- sions of smelters [6]. Due to its versatile uses and release from this source, there is increasing concern relating to its occurrence more than admissible drinking water limit of 6 μg·L–1 in the aquatic system [11]. The biogeo- chemical process in the ocean and estuaries are complex due to the occurrence of Sb compounds in Sb (V) & Sb (III) oxidation state. The process responsible for their variation are 1) interconversion between Sb (V) & (III) oxidation state under oxic and anoxic condition 2) indis- crepency in the adsorption/desorption kinetics between Sb (III) & (V) 3) biological activity such as phytoplank- ton production, biovolatilisation by fungus [12-17]. These processes controlling the transformation and trans- port of antimony have been identified as research priori- ties in an ecosystem [2]. Highly productive Sundarbans mangrove ecosystem (4.71 - 6.54 Mg C·ha–1·year–1) with 4.85 Mg C·ha–1·year–1 of litter production [18] and sea- sonal shift of phytoplankton production with diatom bloom during post monsoon period [19] could affect the antimony reactivity and cycling in the Sundarbans man- grove ecosystem situated along coastal boundary of Ganga-Brahmaputra delta. Elevated concentrations of Sb in an ecosystem could be related to anthropogenic sources and associated with high As concentration [2]. Arsenic found in the Ganga-Brahmaputra delta [20] is redistrib- uted by biogeochemical processes in the Sundarbans mangrove ecosystem [21]. The present study was intended to identify the bio- geochemical processes affecting Sb distribution and to explain its ultimate source from the Sundarban mangrove ecosystem. 2. Materials and Methods Study area: The study site is located in the Indian Sundarban at 21˚32', 22˚40'N and 88˚05', 89˚E (Figure 1). This natural mangrove forest is a part of the estuarine system of the River Ganges on the northeast coast of Bay of Bengal. It covers a total area of 9630 km2, and 4264 km2 is comprised of intertidal zone. This area is covered  Distribution of Antimony in a Tropical Estuary Dominated by Mangroves841 Figure 1. Map showing the station location. with thick mangroves, which are subdivided into a forest sub-ecosystem and 1781 km2 is an aquatic sub-ecosystem. The distance from the study area to the region, which spans from the first point in south 24 Pgs and the last point in north Malda is approximately 150 - 580 km. The Hooghly estuary, a tributary of the river Ganges, is the main artery of the Sundarban mangrove ecosystem. Farakka dam located at ~286 km upstream from the mouth of the river regulates fresh water flow through the estuary. The Ganges drains much of the southern slopes of the Himalaya and delivers an enormous supply of sediment to the Bengal fan. Suspended particulate matter (SPM) exhibited seasonality with highest level during monsoon (282.2 mg·L–1) periods and lowest levels during the pre-monsoon period (12.0 mg·L–1). It decreases ex- ponentially with respect to salinity (S): SPM = 109 e–0.0718 × S (r2 = 0.5). The annual load of sediment from the es- tuary to the northeast coast of Bay of Bengal was esti- mated to be 65.19 × 10⁶ t and monsoonal runoff could account for 88% of the total transport [22]. Fresh water discharge of the Hooghly River varies between 2952 and 11,897 m3·s–1 during the southwest monsoon and be- tween 900 and 1500 m3·s–1 in the non-monsoonal months. The salt front rarely penetrates beyond Diamond Harbor, which is 80 km from the mouth of the Hooghly estuary. Several discrete islands and low-lying intertidal zones are covered with thick mangrove and are inundated during spring tide. Heights of natural mangrove plants genera, Copyright © 2011 SciRes. JEP  Distribution of Antimony in a Tropical Estuary Dominated by Mangroves 842 such as Avicennia, Acanthus, Aegiceras, Bruguiera, and Ceriops >10 m are rare. The climate of the area is domi- nated by the southwest monsoon (June-September), northeast monsoon or post-monsoon (October-January), and pre-monsoon (February-May). 2.1. Experiments Design Measurements were performed every month from Janu- ary to December in 2007 at two sites: one located at Lo- thian Island in the confluence of Saptamukhi River and Bay of Bengal, and the other located at Sajnekhali, which is 117 km from Lothian Island. Samples were also col- lected at three stations, Beguakhali, Kachuberia, and Diamond Harbor, which covered the breadth of the salin- ity gradient zone. Different sites of the littoral zone cov- ered with mangrove were selected for monthly sampling of pore water [23], sediment during low tidal expose, and tidal water during the low and high tidal phase. A corer made of stainless steel (5.5 cm i.d.) was used to extrude sediment, and sectioned at three depth intervals (0 - 2, 2 - 4, and 4 - 6 cm). Surface water samples were collected using Niskin bottles at 3 h intervals from a boat. Tidal and pore water samples were filtered (0.45 m millipore filters, previously dried and weighed) under nitrogen atmosphere. These filter samples were stabilized by the addition of H2SO4 to yield a 0.1% v:v in acid-washed PP bottles, and stored in an ice box for antimony speciation analysis. Filtered tidal and pore water samples collected in PP bottles were also stored in the cold and dark with- out the addition of acid or HgCl2 for analyses of salinity, sulfate and sulphide. Ground water collected from the tube well of ~150 m deep was preserved in an ice box after acidification for Sb analysis. Tidal and pore water samples were also collected and preserved with HgCl2 for pH determination [24]. Phytoplankton was collected from surface water in the day time during high tide by using bolting silk 20 µm plankton net. For quantitative estimation, 1L samples were preserved with Lugol’s so- lution and buffered formaldehyde. After 24hrs of sedi- mentation, the supernatant was reduced to a minimum volume by filtration (0.45 µm). Settled and filtered mate- rials were combined and used for phytoplankton enu- meration, identification and biovolume with the help of a Sedgwick rafter counting chamber [25]. 2.2. Analytical Methods Sulfate, sulfide, iron were analyzed by spectrophotomet- ric method [26,27]. Relative error of accuracy was <±10%. Air-dried sediment samples were used for grain size analysis following the pipette method [28]. Freeze dried sediment sample was used for the measurement of organic carbon by the Walky-Black wet combination method [29]. Known quantity (0.5 g) of dried sediments was extracted by 0.1 N KOH solution with constant shaking for 24hrs and centrifuged and fluorescence spec- tra were recorded by using Perkin Elmer LS-50 lumines- cence spectrophotometer for the measurement of humic (HA) and fulvic (FA) acid [30]. An acid mixture (HF, HNO3, HCl) for freeze dried sediment, suspended par- ticulate matter samples were used for digestion in Teflon reactors to perform total antimony analysis using the Varian Hydride System-Vapor Generator (Serial No. EL0405-314) coupled to the Spectr AA 55B true Double Beam Atomic Absorption Spectrometer, following meth- ods described elsewhere [31,32]. Measurement of dis- solved Sb (III) was performed by hydride generation at pH 6 using the buffer of tris-HCl (1.9M) and 1 MHCl/1% w/v potassium iodide followed by NaBH4 treatment for total antimony [33]. The analytical methods for antimony were verified before analyses of each sample batch against standard samples procured from MERCK K GaA, Germany. Relative accuracy and the coefficient of varia- tion were 96.2% and 9.2%, respectively, for antimony. 2.3. Flux Estimate To evaluate whether the diagenic processes could lead to significant post depositional redistribution of Sb, we es- timated vertical diffusive flux. The net flux of dissolved species across the sediment-water interface (F, ng·m–2·d–1) is due to molecular diffusion in pore water (–ΦD dC/dZ), and advective transport of the species in pore water (ΦUC) and on sediment particles (ΦUsCs). Considering the constant ratio (K) of the distribution of chemical spe- cies in pore (C) and solid matter(Cs), and equal advec- tion velocities of sediment particles (Us) and pore water (U), the net flux is calculated from the equation: F = –ΦD dC/dZ + Φ U(K + 1)C [34]. For elevated concentra- tion in pore water (dC/dZ > 0), the –ve value of F indi- cates that the net flux of antimony is directed up- ward (from sediment to water). Bulk sediment diffusion coef- ficient (D) was calculated from the molecular diffusion (D0) for Sb in sea water using the equation D = Φ2D0 and porosity (Φ) 0.65. The concentration gradient was calcu- lated from the Sb concentration in the overly- ing water and pore water collected from the sediment sampling interval (0 - 30 cm). 3. Results The seasonal maximum and minimum temperatures of the atmosphere were 30.7 ± 1.5 and 21.5 ± 4.6˚C in June and December, respectively. Total rainfall was recorded as 1737 and 590 mm during the SW and NE monsoon, respectively. Secchi disc transparency varied between 7 and 99 cm, and mean photic zone light energy was found to be 23.48 ± 4.5 k lux. The mean antimony concentra- tions varied in the tidal water from 230.8 to 303.1 ng·L–1, Copyright © 2011 SciRes. JEP  Distribution of Antimony in a Tropical Estuary Dominated by Mangroves Copyright © 2011 SciRes. JEP 843 in pore water from 375.5 to 590.9 ng·L–1, in ground water from 250.0 to 327.5 ng·L–1, in sediment from 0.2188 to 0.5834 µg·g–1, in suspended particulate mater from 0.08 to 0.19 μg·g–1. Investigation of diurnal variations in man- grove water of antimony (Total) concentrations demon- strated an increase between low and high tide from 175.0 ng·L–1 to 425.0 ng·L–1 in October, from 128.0 ng·L–1 to 327.9 ng·L–1 in January and from 232.0 ng·L–1 to 464.0 ng·L–1 in March. Antimony concentrations in tidal water demonstrated strong seasonal variations (Figure 2, Table 1), with a maximum of 303.1 ± 91.1 ng·L–1 during the pre-monsoon and a minimum of 230.8 ± 102.0 ng·L–1 during the post-monsoon and intermediate of 279.8 ± 192.1 ng·L–1 during the monsoon. Antimony concentra- tion was found to decrease in the study area after onset of the monsoon. Sb was found to be associated with particle (0.85 - 0.19 μg·g–1), and was about 1.8 folds greater in the pore water than in the tidal water. Variation of Sb in the salinity gradient zone of the estuary is given in Fig- ure 3, which showed increased antimony concentrations with increasing salinity. Phytoplankton population showed seasonality (Table 1), with the highest levels during post-monsoon periods (1.8 × 10⁴ cells·L–1) and lowest levels during the monsoon period (0.8 × 10⁴ cells·L–1). Biswas et al. 2010 [35] observed that the number of definable Bacillariophyceae species exceeded Dinophyceae taxa, and highest number of bloom-form- ing species was found during post-monsoon period. Figure 2. Seasonal variations in Sb (total) and Sb(III) for tidal, pore and gr ound water. Figure 3. Salinity versus dissolved antimony (total) in the salinity gradient zone of Saptamukhi and Hooghly estuary. 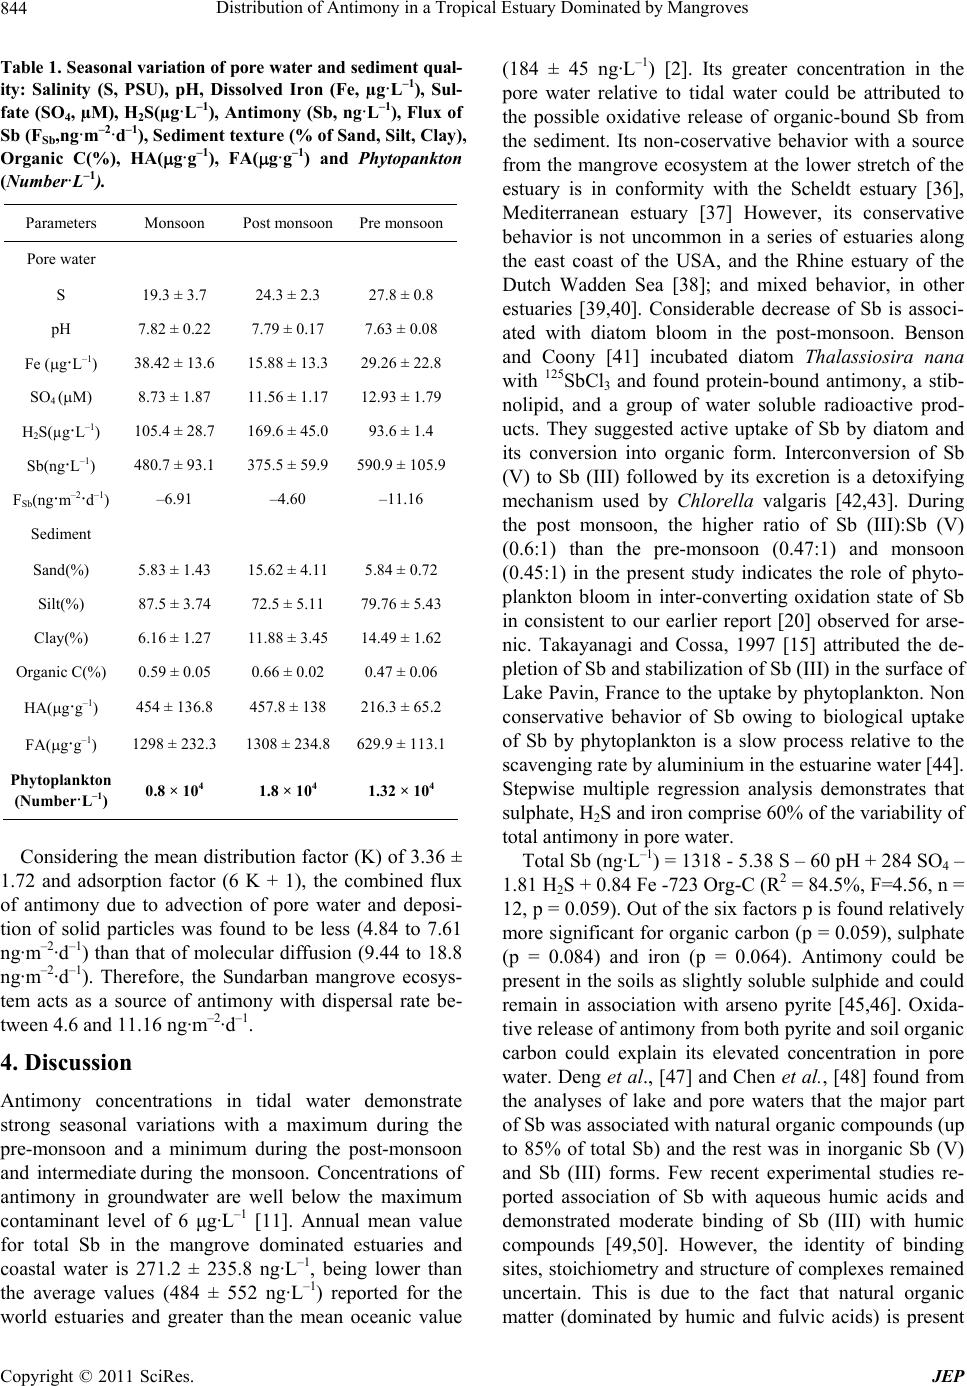 Distribution of Antimony in a Tropical Estuary Dominated by Mangroves 844 Table 1. Seasonal varia tion of pore water and sedime nt qual- ity: Salinity (S, PSU), pH, Dissolved Iron (Fe, µg·L–1), Sul- fate (SO4, µM), H2S(µg·L–1), Antimony (Sb, ng·L–1), Flux of Sb (FSb,ng·m–2·d–1), Sediment textur e (% of Sand, Silt, Clay ), Organic C(%), HA(g·g–1), FA(g·g–1) and Phytopankton (Number·L–1). Parameters Monsoon Post monsoon Pre monsoon Pore water S 19.3 ± 3.7 24.3 ± 2.3 27.8 ± 0.8 pH 7.82 ± 0.22 7.79 ± 0.17 7.63 ± 0.08 Fe (g·L–1) 38.42 ± 13.6 15.88 ± 13.3 29.26 ± 22.8 SO4 (M) 8.73 ± 1.87 11.56 ± 1.17 12.93 ± 1.79 H2S(µg·L–1) 105.4 ± 28.7 169.6 ± 45.0 93.6 ± 1.4 Sb(ng·L–1) 480.7 ± 93.1 375.5 ± 59.9 590.9 ± 105.9 FSb(ng·m–2·d–1) –6.91 –4.60 –11.16 Sediment Sand(%) 5.83 ± 1.43 15.62 ± 4.11 5.84 ± 0.72 Silt(%) 87.5 ± 3.74 72.5 ± 5.11 79.76 ± 5.43 Clay(%) 6.16 ± 1.27 11.88 ± 3.45 14.49 ± 1.62 Organic C(%) 0.59 ± 0.05 0.66 ± 0.02 0.47 ± 0.06 HA(g·g–1) 454 ± 136.8 457.8 ± 138 216.3 ± 65.2 FA(g·g–1) 1298 ± 232.3 1308 ± 234.8 629.9 ± 113.1 Phytoplankton (Number·L–1) 0.8 × 10⁴ 1.8 × 10⁴ 1.32 × 10⁴ Considering the mean distribution factor (K) of 3.36 ± 1.72 and adsorption factor (6 K + 1), the combined flux of antimony due to advection of pore water and deposi- tion of solid particles was found to be less (4.84 to 7.61 ng·m–2·d–1) than that of molecular diffusion (9.44 to 18.8 ng·m–2·d–1). Therefore, the Sundarban mangrove ecosys- tem acts as a source of antimony with dispersal rate be- tween 4.6 and 11.16 ng·m–2·d–1. 4. Discussion Antimony concentrations in tidal water demonstrate strong seasonal variations with a maximum during the pre-monsoon and a minimum during the post-monsoon and intermediate during the monsoon. Concentrations of antimony in groundwater are well below the maximum contaminant level of 6 μg·L–1 [11]. Annual mean value for total Sb in the mangrove dominated estuaries and coastal water is 271.2 ± 235.8 ng·L–1, being lower than the average values (484 ± 552 ng·L–1) reported for the world estuaries and greater than the mean oceanic value (184 ± 45 ng·L–1) [2]. Its greater concentration in the pore water relative to tidal water could be attributed to the possible oxidative release of organic-bound Sb from the sediment. Its non-coservative behavior with a source from the mangrove ecosystem at the lower stretch of the estuary is in conformity with the Scheldt estuary [36], Mediterranean estuary [37] However, its conservative behavior is not uncommon in a series of estuaries along the east coast of the USA, and the Rhine estuary of the Dutch Wadden Sea [38]; and mixed behavior, in other estuaries [39,40]. Considerable decrease of Sb is associ- ated with diatom bloom in the post-monsoon. Benson and Coony [41] incubated diatom Thalassiosira nana with 125SbCl3 and found protein-bound antimony, a stib- nolipid, and a group of water soluble radioactive prod- ucts. They suggested active uptake of Sb by diatom and its conversion into organic form. Interconversion of Sb (V) to Sb (III) followed by its excretion is a detoxifying mechanism used by Chlorella valgaris [42,43]. During the post monsoon, the higher ratio of Sb (III):Sb (V) (0.6:1) than the pre-monsoon (0.47:1) and monsoon (0.45:1) in the present study indicates the role of phyto- plankton bloom in inter-converting oxidation state of Sb in consistent to our earlier report [20] observed for arse- nic. Takayanagi and Cossa, 1997 [15] attributed the de- pletion of Sb and stabilization of Sb (III) in the surface of Lake Pavin, France to the uptake by phytoplankton. Non conservative behavior of Sb owing to biological uptake of Sb by phytoplankton is a slow process relative to the scavenging rate by aluminium in the estuarine water [44]. Stepwise multiple regression analysis demonstrates that sulphate, H2S and iron comprise 60% of the variability of total antimony in pore water. Total Sb (ng·L–1) = 1318 - 5.38 S – 60 pH + 284 SO4 – 1.81 H2S + 0.84 Fe -723 Org-C (R2 = 84.5%, F=4.56, n = 12, p = 0.059). Out of the six factors p is found relatively more significant for organic carbon (p = 0.059), sulphate (p = 0.084) and iron (p = 0.064). Antimony could be present in the soils as slightly soluble sulphide and could remain in association with arseno pyrite [45,46]. Oxida- tive release of antimony from both pyrite and soil organic carbon could explain its elevated concentration in pore water. Deng et al., [47] and Chen et al., [48] found from the analyses of lake and pore waters that the major part of Sb was associated with natural organic compounds (up to 85% of total Sb) and the rest was in inorganic Sb (V) and Sb (III) forms. Few recent experimental studies re- ported association of Sb with aqueous humic acids and demonstrated moderate binding of Sb (III) with humic compounds [49,50]. However, the identity of binding sites, stoichiometry and structure of complexes remained uncertain. This is due to the fact that natural organic matter (dominated by humic and fulvic acids) is present Copyright © 2011 SciRes. JEP  Distribution of Antimony in a Tropical Estuary Dominated by Mangroves845 in extremely complex poly-functional structure, which precludes assessing unambiguously sorption mechanisms or nature of aqueous complexes and identifying chemical sites (potentially numerous) responsible for Sb binding. Sediment-water molecular diffusive flux of antimony is greater than the combined flux due to advection of pore water and deposition of solid particles over the sediment and the Sundarban mangrove ecosystem acts as a source for antimony with significant diagenetic remobilization. 5. Acknowledgements We gratefully acknowledge financial assistance from the UGC, New Delhi. REFERENCES [1] M. J. Nash, J. E. Maskall and Hill, “Methodologies for Determination of Antimony in Terrestrial Environmental Samples,” Journal of Environmental Monitoring, Vol. 2, 2000, pp. 97-109. doi:10.1039/a907875d [2] M. Filella, N. Belzile and Y. W. Chen, “Antimony in the Environment: A Review Focused on Natural Waters I. Occurrence,” Earth Science Review, Vol. 57, No. 1-2, 2002, pp. 125-176. doi:10.1016/S0012-8252(01)00070-8 [3] M. Filella, N. Belzile and Y.-W. Chen, “Antimony in the Environment: A View Focused on Natural Waters: II. Relevant Solution Chemistry,” Earth-Science Review, Vol. 59, No. 1, 2002, pp. 265-285. doi:10.1016/S0012-8252(02)00089-2 [4] M .Filella, P.A. Williams and N. Belzila, “Antimony in the Environment: Knowns and Unknowns,” Environ- mental Chemistry, Vol. 6, No. 2, 2009, pp. 95-105. doi:10.1071/EN09007 [5] Jr. J. F. Carlin, “Geological Survey Minearal Commodity Summaries, U.S.,” 2000. [6] B. A. Fowler and P. L. Goering, “Antimony,” In: E. Merian, Ed., Metals and Their Compounds in the Envi- ronment, VCH, Weinheim, 1991. [7] T. Crommentuijn, M. D. Polder and E. J. van de Plasche, “Maximum Permissible Concentrations and Negligible Concentrations of Metals, Taking Background Concen- trations into Account,” RIVM Report No. 601501001, National Institute of Public Health and the Environment, Bilthoven, The Netherlands, 1997. [8] A. Kabata-Pendias and H. Pendias, “Trace Elements in Soils and Plants,” CRC Press, Boca Raton, 1985. [9] X. Huang, I. Olmez, N. K. Aras and G. E. Gordon, “Emission of Trace Elements from Motor Vehicles: Po- tential Marker Elements and Source Composition Pro- file,” Atmospheric Environment, Vol. 28, No. 8, 1994, pp. 1385-1391. doi:10.1016/1352-2310(94)90201-1 [10] C. Dietl, M. Waber, L. Peichl and O. Vierle, “Monitoring of Airborne Metals in Grass and Depositions,” Chemos- phere, Vol. 33, No. 11, 1996, pp. 2101-2111. doi:10.1016/0045-6535(96)00301-3 [11] United States Environmental Protection Agency, “Na- tional Primary Drinking Water Standards,” USEPA Of- fice of Water, Washington DC, 1999, Doc. 810-F-94-001. [12] M. O. Andreae and P. N. Froelich, “Arsenic, Antimony, and Germanium Biogeochemistry in the Baltic Sea,” Tel- lus, Vol. 36B, 1984, pp. 101-117. doi:10.1111/j.1600-0889.1984.tb00232.x [13] G. A. Cutter, “Dissolved Asenic and Antimony in Black sea,” Deep-Sea Research. Vol. 38, Suppl. 2, 1991, pp. S825-S843. doi:10.1016/S0198-0149(10)80011-1 [14] G. A. Cutter and L. S. Cutter, A. M. Featherstone and S. E. Lohrenz, “Antimony and Arsenic Biogeochemistry in the Western Atlantic Ocean,” Deep-Sea Research: Part II, Vol. 48, No. 13, 2001, pp. 2895-2915. [15] Takayanagi and D. Cossa, “Vertical Distributions of Sb(III) and Sb(V) in Pavin Lake, France,” Water Re- search, Vol. 31, No. 3, 1997, pp. 671-674. doi:10.1016/S0043-1354(96)00285-0 [16] H. Gürleyük, V. Van Fleet-Stalder and T. G. Chasteen, “Confirmation of the Biomethylation of Antimony Com- pounds,” Applied Organometalic Chemistry, Vol. 11, 1997, pp. 471-483. [17] P. Andrewes, W. R. Cullen and E. Polishchuk. “Anti- mony Biomethylation by Scopulariopsis Brevicaulis: Characterization of Intermediates and the Methyl Donor,” Chemosphere, Vol. 41, No. 11, 2000, pp. 1717-1725. doi:10.1016/S0045-6535(00)00063-1 [18] R. Ray, D. Ganguly, C. Chowdhury, M. Dey, S. Das, M. K. Dutta, S. K. Mandal, N. Majumdar, T. K. De, S. K. Mukhopadhyay and T. K. Jana, “Carbon Sequestration and Annual Increase of Carbon Stock in a Mangrove Forest,” Atmospheric Environment, Vol. 45, No. 28, 2011, pp. 5016-5024. [19] H. Biswas, S. K. Mukhopadhyay, T. K. De, S. Sen and T. K. Jana, “Biogenic Controls on the Air-Water Carbon Dioxide Exchange in the Sundarban Mangrove Environ- ment, Northeast Coast of Bay of Bengal, India,” Limnol- ogy & Oceanography, Vol. 49, No.1, 2004, pp. 95-101. [20] D. Das, G. Samanta, B. K. Mondal, R. T. Chowdhury, C. R. Chanda, P. P. Chowdhury, G. K. Basu and D. chak- raborti, “Arsenic in Ground Water in Six Districts of West Bengal, India,” Environmental Geochemistry and Health, Vol. 18, No. 1, 1996, pp. 5-15. doi:10.1007/BF01757214 [21] S. K. Mandal, M. Dey, D. Ganguly, S. Sen and T. K. Jana, “Biogeochemical Controls of Arsenic Occurrence and Mobility in the Indian Sundarban Mangrove Ecosystem,” Marine Pollution Bulletin, Vol. 58, No. 5, 2009, pp. 652- 657. doi:10.1016/j.marpolbul.2009.01.010 [22] S. K. Mukhopadhyay, H. Biswas, T. K. De and T. K. Jana, “Fluxes of Nutrients From the Tropical River Hooghly at the Land–Ocean Boundary of Sundarbans, NE Coast of Bay of Bengal, India,” Journal of Marine System, Vol. 62, No. 1-2, 2006, pp. 9-21. doi:10.1016/j.jmarsys.2006.03.004 [23] H. D. Schulz, “Quantification of Early Diagenesis: Dis- Solved Constituents in Pore Water and Signals in the Solid Phase,” In: H. D. Schulz and M. Zabel, Eds, Marine Copyright © 2011 SciRes. JEP  Distribution of Antimony in a Tropical Estuary Dominated by Mangroves 846 Geochemistry, Second Edition, Springer, Germany, 2006, pp. 73-124. doi:10.1007/3-540-32144-6_3 [24] DOE, “Handbook of Methods for the Analysis of the Various Parameters of the Carbon Dioxide System in Sea Water,” Version 2, ORNL/CDIAC-74, 1994. [25] P. E. Keller, S. A. Paulson and L. J. Paulson, “Methods for Biological, Chemical and Physical Analysis in Reser- voirs Techical Report. 5,” Lake Mead Limnological Re- search Centre, University of Nevada, Reno, 1980. [26] K. Grasshoff, “Determination of Nutrients,” In: K. Grasshoff, M. Ehrhard and K. Kremling, Eds, Determina- tion of salinity and Oxygen, Methods of Seawater Analy- sis, Verlag Chemie, Weinheim, 1983, pp. 31-72. [27] APHA, “Standard Methods for the Examination of Water and Waste Water,” American Public Health Association, Washington DC, 1995, pp. 5-15. [28] C. S. Piper, “Soil and Plant Analysis,” Inter Science Pub- lication, New York, 1950, p. 67. [29] A. Walky and I. A. Black, “An Examination of the Deg- tiareff Method for Deteming Soil Organic Matter and Pro- posed Modification of the Chromic Acid Titration Me- thod,” Soil Science, Vol. 37, No. 1, 1934, pp. 29-38. doi:10.1097/00010694-193401000-00003 [30] H. Ghatak, S. K. Mukhopadhyay, H. Biswas, S. Sen and T. K. Jana, “Quantitative Study of Co (III) Complexation by Syncvhronous Fluorescence Spectroscopy with Sun- derban Mangrove Habitat Humic Substances,” Indian Journal of Marine Science, Vol. 37, 2002, pp. 136-140. [31] M. Yamamoto, M. Yasuda and Y. Yamamoto, “Hydride- generation Atomic Absorbtion Spectrometry Coupled with Flow Injection Analysis,” Analytical Chemistry, Vol. 57, No. 3, 1985, pp. 1375-1382. doi:10.1021/ac00284a045 [32] D. H. Loring and R. T. T. Rantala, “Manual for the Geo- chemical Analysis of Marine Sediment and Suspended Particulate Matter,” Earth Science R eview, Vol. 32, No. 4, 1992, pp. 235-283. doi:10.1016/0012-8252(92)90001-A [33] R. S. Barman, D. L. Johnson, C. C. Foreback, J. M. Am- mous and J. L. Bricker, Analytical Chemistry, Vol. 49, No. 4, 1977, pp. 621-625. doi:10.1021/ac50012a029 [34] A. Lerman, “Geochemical Processes. Water and Sedi- ment Environments,” John Wiley and Sons, Hoboken, 1979, p. 343. [35] H. Biswas, M. Dey, D. Ganguly, T. K. De, S. Ghosh and T. K. Jana, “Comparative Analysis of Phytoplankton Composition and Abundance over a Two-Decade Period at the Land-Ocean Boundary of a Tropical Mangrove Ecosystem,” Esuaries and Coasts, Vol. 33, No. 2, 2010, pp. 384-394. doi:10.1007/s12237-009-9193-5 [36] H. A. Sloot.Van der, D. Hoede and J. Wijkstra,“Trace Oxyanioins and Their Behaviour in the River Porong and Solo, Java Sea & the Adjacent Indian Ocean,” Netherland Journal of Sea Research, Vol. 23, No. 4, 1989, pp. 379- 386. [37] C. Migon and C. Mori, “Arsenic and Antimony Release from Sediments in a Mediterranean Estuary,” Hydrobi- ologia, Vol. 392, No. 1, 1999, pp. 81-88. doi:10.1023/A:1003561609548 [38] J. T. Byrd, “Comparative Geochemistries of Arsenic and Antimony in Rivers and Estuaries,” Science of Total Environment, Vol. 97, No. 8, 1990, pp. 301-314. doi:10.1016/0048-9697(90)90247-R [39] C. M. Berg, G. van den, S. H. Khan, P. J. Daly, J. P. Riley and D. R. Turner, “An Electrochemical Study of Ni, Sb, Se, Sn, U and V in the Estuary of the Tamar,” Estuararies and Coastal Shelf Science, Vol. 33, No. 3, 1991, pp. 309- 322. [40] G. van den and C. M. Berg, “Complex Formation and the Chemistry of Selected Trace Elements: Coastal and Es- tuarine Research Federation Stable URL,” Estuaries, Vol. 16, No. 3A, 1993, pp. 512-520. [41] A. A. Benson and R. A. Cooney, “Antimony Metabolites in Marine Algae,” In: P. J. Craig and G. F. Longmans, Eds., Organometallic Compounds in the Environment. Principles and Reactions, Harlow, 1988, pp. 135-137. [42] S. Maeda, H. Fukuyama, E. Yokoyama, T. Kuroiwa, A. Ohki and K. Naka, “Bioaccumulation of Antimony by Chlorella Vulgaris and the Association Mode of Anti- mony in the Cell,” Applied Organometalic Chemistry, Vol. 11, 1997, pp. 393-396. doi:10.1002/(SICI)1099-0739(199705)11:5<393::AID-A OC593>3.0.CO;2-7 [43] S. Maeda and A.Ohki, “Bioaccumulation and Biotrans- formation of Arsenic, Antimony and Bismuth Com- pounds by Freshwater Algae.” In: Y.-S. Wong and N. F. Y. Tam, Eds., Wastewater Treatment with Algae, Springer- Verlag and Landes Biosciences, Berlin, 1998, pp. 73-92. [44] G. A. Cutter and L. S. Cutter, “Biogeochemistry of Arse- nic and Antimony in the North Pacific Ocean,” Geo- chemistry Geophysics Geosystem, Vol. 7, Q05M08, 2006, 12 Pages. [45] S. Hinzmann, “ Mineralogie, Geochemie und Okologie des Quecksilbers in historischen Bergbaugebieten von Rheinland-Pfalz, ” Thesis, Geowissenschaften Johannes Gutenberg University, Mainz, 1991. [46] A. Neuhaus, “Erfassung und Quanti®zierung von Queck- silber-, Arsen- und Antimonverbindungen im Bereich Boden- P-anze eines historischen Bergbaugebietes im Nordpfalzer Bergland,” Thesis, Johannes Gutenberg University, Geowissenschaften, Mainz, 1994. [47] T.-L. Deng, Y.-W. Chen and N Belzile, “Antimony Speciation at Ultra Trace Levels Using Hydride Genera- tion Atomic Fluorescence Spectrometry and 8-Hydroxy- quinoline as an Efficient Masking Agent,” Analytica Chimica Acta, Vol. 432, No. 2, 2001, pp. 293-302. doi:10.1016/S0003-2670(00)01387-8 [48] Y. W. Chen, T. L Deng, M. Filella and N. Belzile, “Dis- tribution and Early Diagenesis of Antimony Species in Sediments and Porewaters of Freshwater Lakes,” Envi- ronmental Science & Technology, Vol. 37, 2003, pp. 1163-1168. doi:10.1021/es025931k [49] J. Buschmann and L Sigg, “Antimony(III) Binding to Humic Substances: Influence of pH and Type of Humic Copyright © 2011 SciRes. JEP  Distribution of Antimony in a Tropical Estuary Dominated by Mangroves Copyright © 2011 SciRes. JEP 847 Acid,” Environmental Science & Technology, Vol. 38, 2004, pp. 4535-4541. doi:10.1021/es049901o [50] S. Steely, D. Amarasiriwardena and B. S. Xing, “An In- vestigation of Inorganic Antimony Species and Antimony Associated with Soil Humic Acid Molar Mass Fractions in Contaminated Soils,” Environmental Pollution, Vol. 148, 2007, pp. 590-598. doi:10.1016/j.envpol.2006.11.031
|