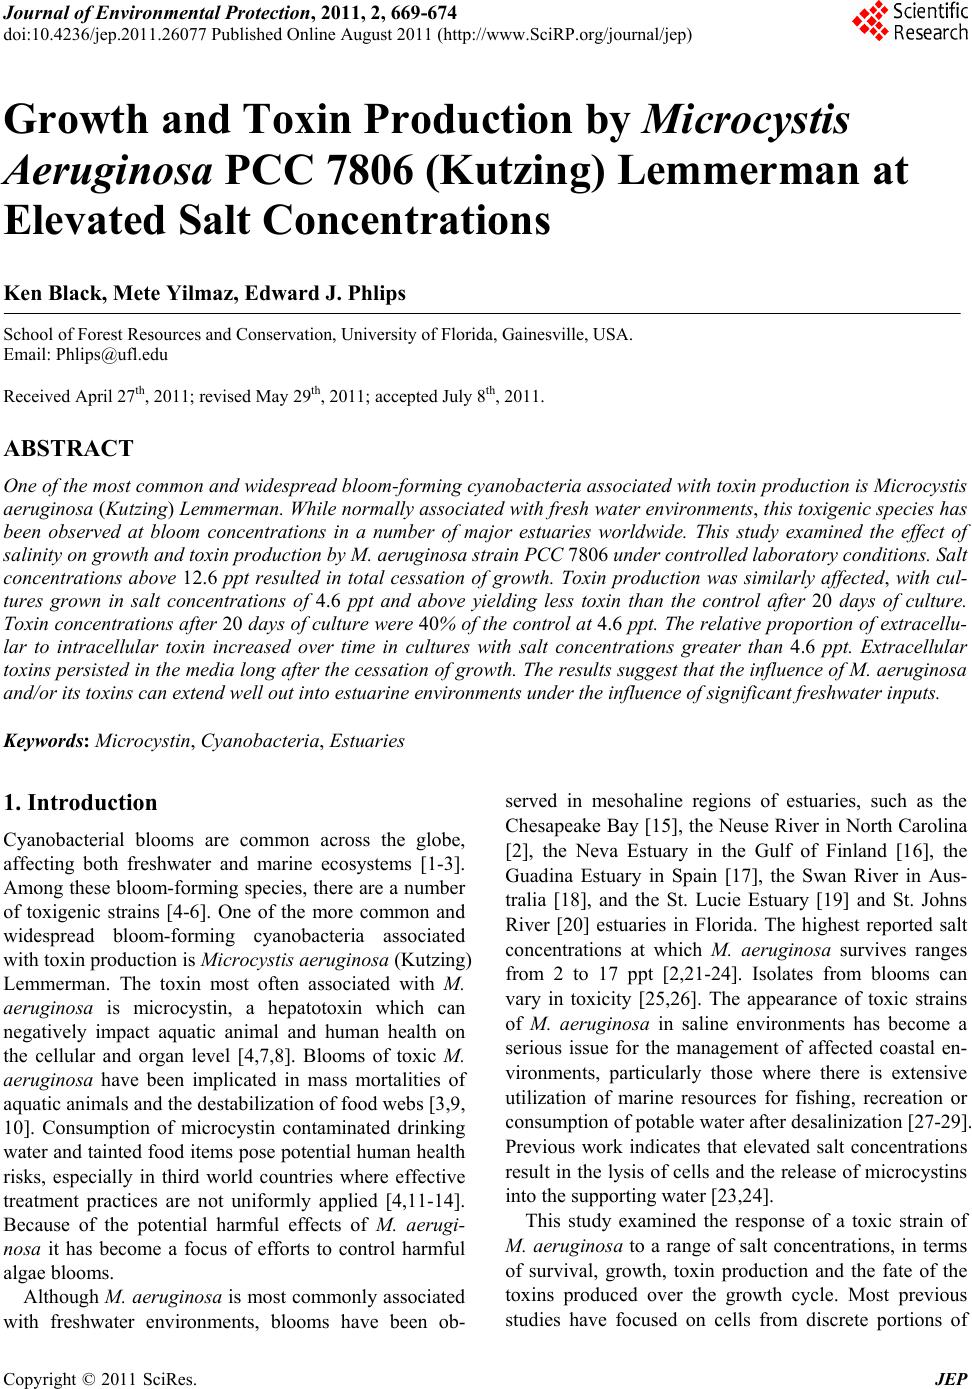
 Journal of Environmental Protection, 2011, 2, 669-674 doi:10.4236/jep.2011.26077 Published Online August 2011 (http://www.SciRP.org/journal/jep) Copyright © 2011 SciRes. JEP 669 Growth and Toxin Production by Microcystis Aeruginosa PCC 7806 (Kutzing) Lemmerman at Elevated Salt Concentrations Ken Black, Mete Yilmaz, Edward J. Phlips School of Forest Resources and Conservation, University of Florida, Gainesville, USA. Email: Phlips@ufl.edu Received April 27th, 2011; revised May 29th, 2011; accepted July 8th, 2011. ABSTRACT One of the most common and widespread bloom-forming cyanobacteria associated with toxin production is Microcystis aeruginosa (Kutzing) Lemmerman. While norma lly associa ted with fresh water environmen ts, this toxigenic species has been observed at bloom concentrations in a number of major estuaries worldwide. This study examined the effect of salinity on growth and toxin production by M. aeruginosa strain PCC 7806 under controlled lab oratory conditions. Salt concentrations above 12.6 ppt resulted in total cessation of growth. Toxin production was similarly affected, with cul- tures grown in salt concentrations of 4.6 ppt and above yielding less toxin than the control after 20 days of culture. Toxin concentratio ns after 20 days of culture were 40% of the control at 4.6 ppt. The relative proportion of extracellu- lar to intracellular toxin increased over time in cultures with salt concentrations greater than 4.6 ppt. Extracellular toxins persisted in the med ia long after the cessation of growth. The results sugg est that the influence of M. aeruginosa and/or its toxins can extend well out into estuarine environments under the influence of significant freshwater inputs. Keywords: Microcystin, Cyanobacteria, Estuaries 1. Introduction Cyanobacterial blooms are common across the globe, affecting both freshwater and marine ecosystems [1-3]. Among these bloom-forming species, there are a number of toxigenic strains [4-6]. One of the more common and widespread bloom-forming cyanobacteria associated with toxin production is Microcystis aeruginosa (Kutzing) Lemmerman. The toxin most often associated with M. aeruginosa is microcystin, a hepatotoxin which can negatively impact aquatic animal and human health on the cellular and organ level [4,7,8]. Blooms of toxic M. aeruginosa have been implicated in mass mortalities of aquatic animals and the destabilization of food webs [3,9, 10]. Consumption of microcystin contaminated drinking water and tainted food items pose potential human health risks, especially in third world countries where effective treatment practices are not uniformly applied [4,11-14]. Because of the potential harmful effects of M. aerugi- nosa it has become a focus of efforts to control harmful algae blooms. Although M. aeruginosa is most commonly associated with freshwater environments, blooms have been ob- served in mesohaline regions of estuaries, such as the Chesapeake Bay [15], the Neuse River in North Carolina [2], the Neva Estuary in the Gulf of Finland [16], the Guadina Estuary in Spain [17], the Swan River in Aus- tralia [18], and the St. Lucie Estuary [19] and St. Johns River [20] estuaries in Florida. The highest reported salt concentrations at which M. aeruginosa survives ranges from 2 to 17 ppt [2,21-24]. Isolates from blooms can vary in toxicity [25,26]. The appearance of toxic strains of M. aeruginosa in saline environments has become a serious issue for the management of affected coastal en- vironments, particularly those where there is extensive utilization of marine resources for fishing, recreation or consumption of potable water after desalinization [27-29]. Previous work indicates that elevated salt concentrations result in the lysis of cells and the release of microcystins into the supporting water [23,24]. This study examined the response of a toxic strain of M. aeruginosa to a range of salt concentrations, in terms of survival, growth, toxin production and the fate of the toxins produced over the growth cycle. Most previous studies have focused on cells from discrete portions of 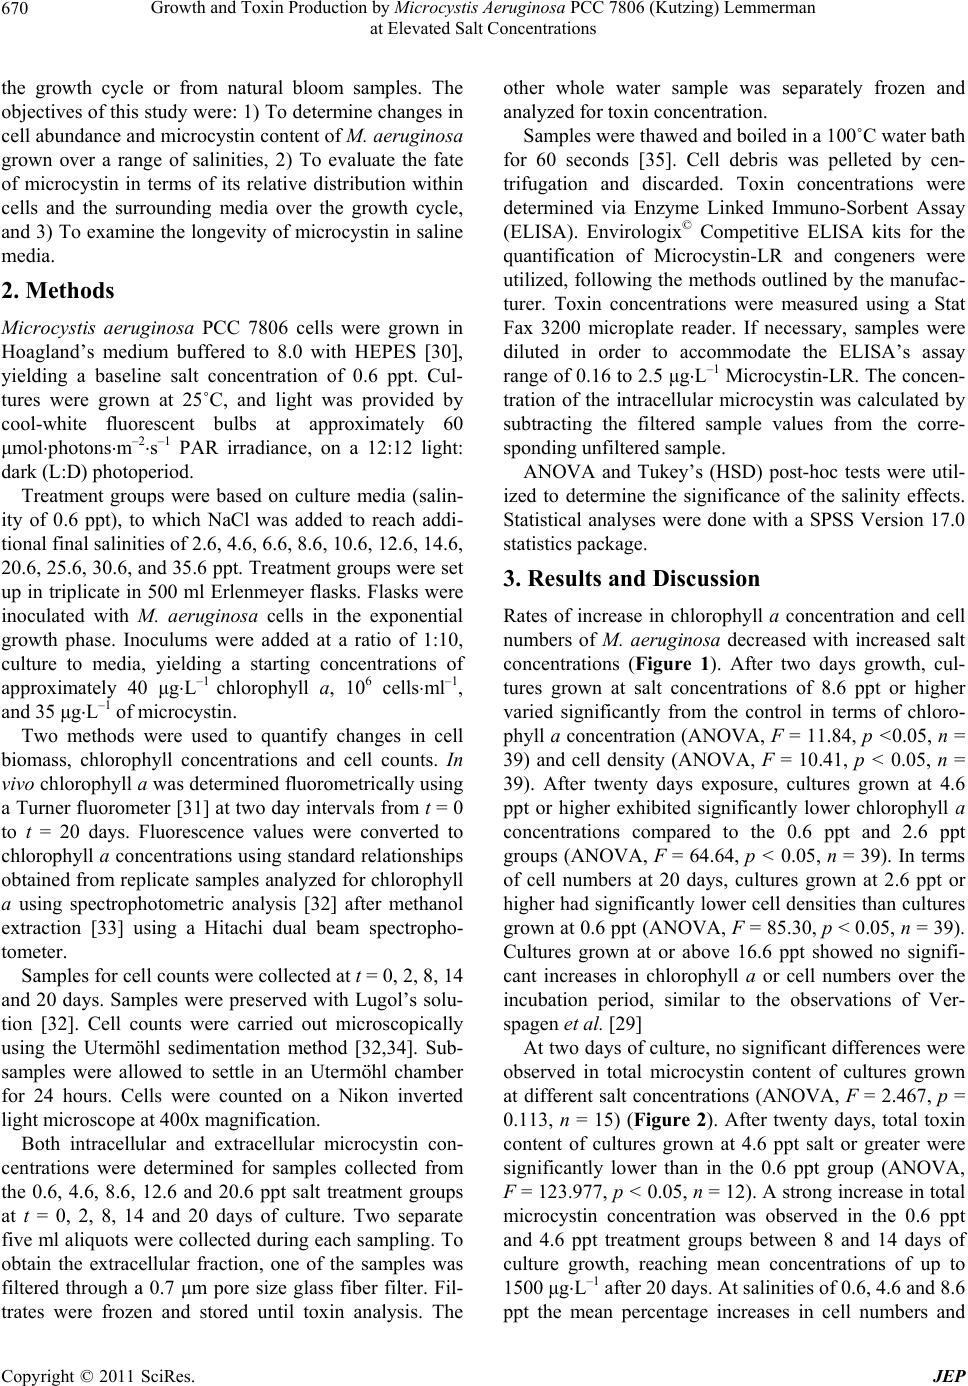 Growth and Toxin Production by Microcystis Aeruginosa PCC 7806 (Kutzing) Lemmerman 670 at Elevated Salt Concentrations the growth cycle or from natural bloom samples. The objectives of this study were: 1) To determine changes in cell abundance and microcystin content of M. aeruginosa grown over a range of salinities, 2) To evaluate the fate of microcystin in terms of its relative distribution within cells and the surrounding media over the growth cycle, and 3) To examine the longevity of microcystin in saline media. 2. Methods Microcystis aeruginosa PCC 7806 cells were grown in Hoagland’s medium buffered to 8.0 with HEPES [30], yielding a baseline salt concentration of 0.6 ppt. Cul- tures were grown at 25˚C, and light was provided by cool-white fluorescent bulbs at approximately 60 μmolphotonsm–2s–1 PAR irradiance, on a 12:12 light: dark (L:D) photoperiod. Treatment groups were based on culture media (salin- ity of 0.6 ppt), to which NaCl was added to reach addi- tional final salinities of 2.6, 4.6, 6.6, 8.6, 10.6, 12.6, 14.6, 20.6, 25.6, 30.6, and 35.6 ppt. Treatment groups were set up in triplicate in 500 ml Erlenmeyer flasks. Flasks were inoculated with M. aeruginosa cells in the exponential growth phase. Inoculums were added at a ratio of 1:10, culture to media, yielding a starting concentrations of approximately 40 μgL–1 chlorophyll a, 106 cellsml–1, and 35 μgL–1 of microcystin. Two methods were used to quantify changes in cell biomass, chlorophyll concentrations and cell counts. In vivo chlorophyll a was determined fluorometrically using a Turner fluorometer [31] at two day intervals from t = 0 to t = 20 days. Fluorescence values were converted to chlorophyll a concentrations using standard relationships obtained from replicate samples analyzed for chlorophyll a using spectrophotometric analysis [32] after methanol extraction [33] using a Hitachi dual beam spectropho- tometer. Samples for cell counts were collected at t = 0, 2, 8, 14 and 20 days. Samples were preserved with Lugol’s solu- tion [32]. Cell counts were carried out microscopically using the Utermöhl sedimentation method [32,34]. Sub- samples were allowed to settle in an Utermöhl chamber for 24 hours. Cells were counted on a Nikon inverted light microscope at 400x magnification. Both intracellular and extracellular microcystin con- centrations were determined for samples collected from the 0.6, 4.6, 8.6, 12.6 and 20.6 ppt salt treatment groups at t = 0, 2, 8, 14 and 20 days of culture. Two separate five ml aliquots were collected during each sampling. To obtain the extracellular fraction, one of the samples was filtered through a 0.7 μm pore size glass fiber filter. Fil- trates were frozen and stored until toxin analysis. The other whole water sample was separately frozen and analyzed for toxin concentration. Samples were thawed and boiled in a 100˚C water bath for 60 seconds [35]. Cell debris was pelleted by cen- trifugation and discarded. Toxin concentrations were determined via Enzyme Linked Immuno-Sorbent Assay (ELISA). Envirologix© Competitive ELISA kits for the quantification of Microcystin-LR and congeners were utilized, following the methods outlined by the manufac- turer. Toxin concentrations were measured using a Stat Fax 3200 microplate reader. If necessary, samples were diluted in order to accommodate the ELISA’s assay range of 0.16 to 2.5 μgL–1 Microcystin-LR. The concen- tration of the intracellular microcystin was calculated by subtracting the filtered sample values from the corre- sponding unfiltered sample. ANOVA and Tukey’s (HSD) post-hoc tests were util- ized to determine the significance of the salinity effects. Statistical analyses were done with a SPSS Version 17.0 statistics package. 3. Results and Discussion Rates of increase in chlorophyll a concentration and cell numbers of M. aeruginosa decreased with increased salt concentrations (Figure 1). After two days growth, cul- tures grown at salt concentrations of 8.6 ppt or higher varied significantly from the control in terms of chloro- phyll a concentration (ANOVA, F = 11.84, p <0.05, n = 39) and cell density (ANOVA, F = 10.41, p < 0.05, n = 39). After twenty days exposure, cultures grown at 4.6 ppt or higher exhibited significantly lower chlorophyll a concentrations compared to the 0.6 ppt and 2.6 ppt groups (ANOVA, F = 64.64, p < 0.05, n = 39). In terms of cell numbers at 20 days, cultures grown at 2.6 ppt or higher had significantly lower cell densities than cultures grown at 0.6 ppt (ANOVA, F = 85.30, p < 0.05, n = 39). Cultures grown at or above 16.6 ppt showed no signifi- cant increases in chlorophyll a or cell numbers over the incubation period, similar to the observations of Ver- spagen et al. [29] At two days of culture, no significant differences were observed in total microcystin content of cultures grown at different salt concentrations (ANOVA, F = 2.467, p = 0.113, n = 15) (Figure 2). After twenty days, total toxin content of cultures grown at 4.6 ppt salt or greater were significantly lower than in the 0.6 ppt group (ANOVA, F = 123.977, p < 0.05, n = 12). A strong increase in total microcystin concentration was observed in the 0.6 ppt and 4.6 ppt treatment groups between 8 and 14 days of culture growth, reaching mean concentrations of up to 1500 μgL–1 after 20 days. At salinities of 0.6, 4.6 and 8.6 ppt the mean percentage increases in cell numbers and Copyright © 2011 SciRes. JEP 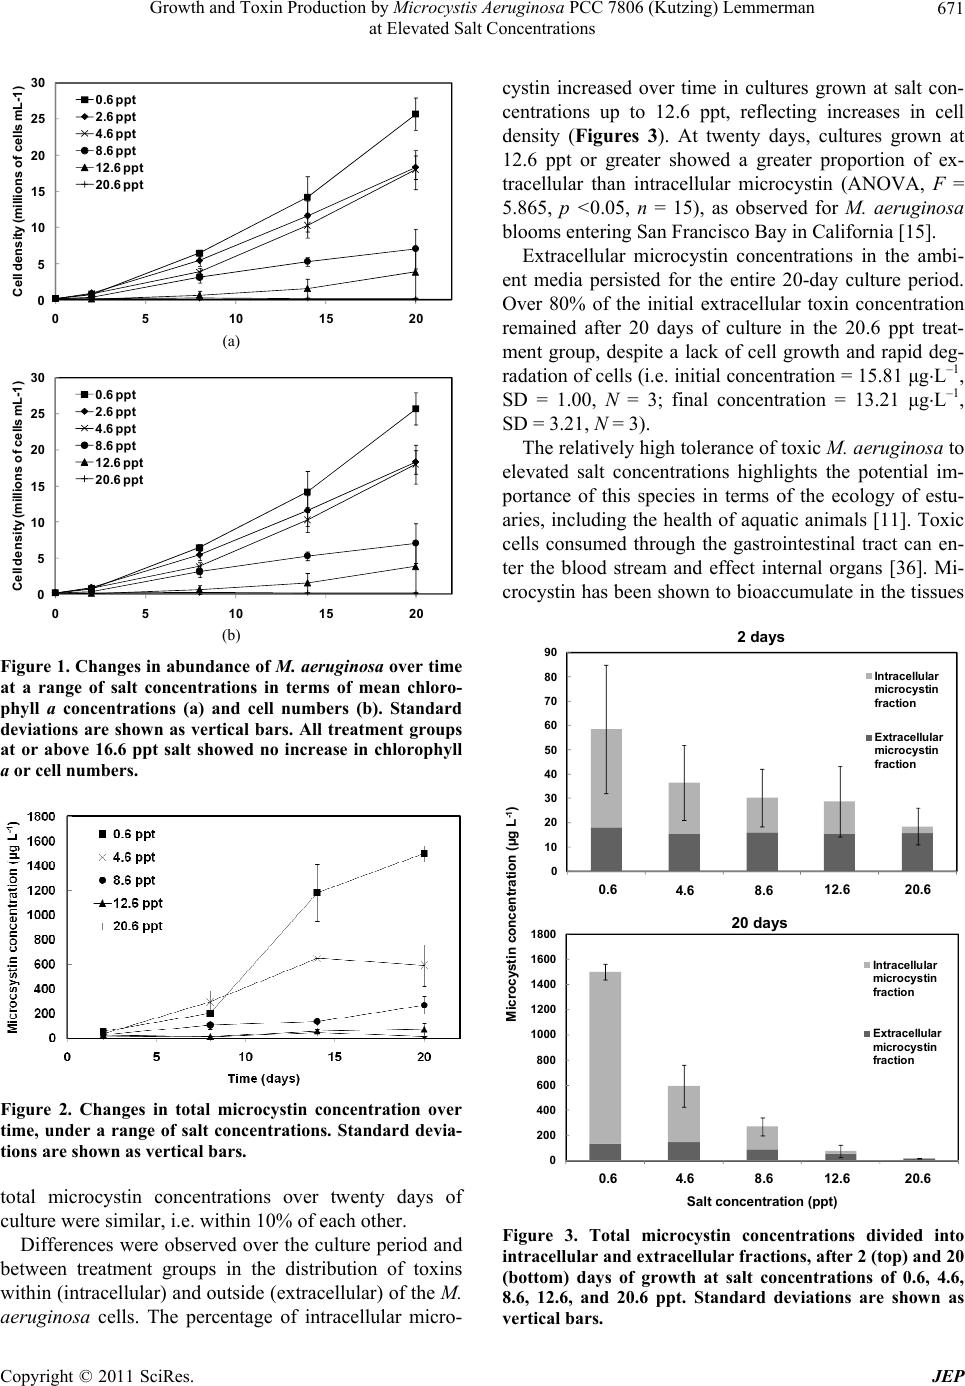 Growth and Toxin Production by Microcystis Aeruginosa PCC 7806 (Kutzing) Lemmerman 671 at Elevated Salt Concentrations 0 5 10 15 20 25 30 0510 15 20 Cell density (millions of cells mL-1) 0.6 ppt 2.6 ppt 4.6 ppt 8.6 ppt 12.6 ppt 20.6 ppt (a) 0 5 10 15 20 25 30 051015 20 Cell density (millions of cells mL-1) 0.6 ppt 2.6 ppt 4.6 ppt 8.6 ppt 12.6 ppt 20.6 ppt (b) Figure 1. Changes in abundance of M. aeruginosa over time at a range of salt concentrations in terms of mean chloro- phyll a concentrations (a) and cell numbers (b). Standard deviations are shown as vertical bars. All treatment groups at or above 16.6 ppt salt showed no increase in chlorophyll a or cell numbers. Figure 2. Changes in total microcystin concentration over time, under a range of salt concentrations. Standard devia- tions are shown as vertical bars. total microcystin concentrations over twenty days of culture were similar, i.e. within 10% of each other. Differences were observed over the culture period and between treatment groups in the distribution of toxins within (intracellular) and outside (extracellular) of the M. aeruginosa cells. The percentage of intracellular micro- cystin increased over time in cultures grown at salt con- centrations up to 12.6 ppt, reflecting increases in cell density (Figures 3). At twenty days, cultures grown at 12.6 ppt or greater showed a greater proportion of ex- tracellular than intracellular microcystin (ANOVA, F = 5.865, p <0.05, n = 15), as observed for M. aeruginosa blooms entering San Francisco Bay in California [15]. Extracellular microcystin concentrations in the ambi- ent media persisted for the entire 20-day culture period. Over 80% of the initial extracellular toxin concentration remained after 20 days of culture in the 20.6 ppt treat- ment group, despite a lack of cell growth and rapid deg- radation of cells (i.e. initial concentration = 15.81 μgL–1, SD = 1.00, N = 3; final concentration = 13.21 μgL–1, SD = 3.21, N = 3). The relatively high tolerance of toxic M. aeruginosa to elevated salt concentrations highlights the potential im- portance of this species in terms of the ecology of estu- aries, including the health of aquatic animals [11]. Toxic cells consumed through the gastrointestinal tract can en- ter the blood stream and effect internal organs [36]. Mi- crocystin has been shown to bioaccumulate in the tissues 0 10 20 30 40 50 60 70 80 90 00000 Mi crocyst i n concentrat i on (µg L -1 ) Me di a sa l t content ( ppt ) Intracellular microcystin fractio n Extracellular microcystin fractio n 0 200 400 600 800 1000 1200 1400 1600 1800 00000 Mi crocyst i n concentrat i on (µg L -1 ) Me di a sa l t content ( ppt ) Intracellular microcystin fraction Extracellular microcystin fraction 0.6 4.6 8.6 12.6 20.60.6 4.6 8.6 12.6 20.60.6 4.6 8.6 12.6 Salt concentration (ppt) Microc ystin concentration (µg L -1 ) 2 days 20 days Figure 3. Total microcystin concentrations divided into intracellular and extracellular fractions, after 2 (top) and 20 (bottom) days of growth at salt concentrations of 0.6, 4.6, 8.6, 12.6, and 20.6 ppt. Standard deviations are shown as vertical bars. Copyright © 2011 SciRes. JEP  Growth and Toxin Production by Microcystis Aeruginosa PCC 7806 (Kutzing) Lemmerman 672 at Elevated Salt Concentrations of a wide range of organisms [4,8], including zooplank- ton [37] ,shellfish [37-40], and fish [36,41], thereby po- tentially exposing all trophic levels of the food web to microcystin [42]. Soluble microcystins in the water have been shown to affect the gills of fish, reducing the capac- ity for gas and ion exchange [43]. The presence of intracellular and extracellular micro- cystins may also impact human health. One of the major concerns is microcystin contamination of potable water [4,13]. In estuaries, concerns center on the increasing use of desalinated water for human consumption [44]. Man- agement options depend on whether the toxins are prin- cipally intracellular or extracellular [24,27,29]. If the toxin is primarily intracellular, removal of cells can sub- stantially reduce the toxin threat, but if the toxin is pri- marily extracellular chemical treatments may be neces- sary. Another human health concern is the consumption of shellfish and fish containing microcystin, however, con- siderable uncertainty remains over the potential risks. Several researchers have observed significant levels of microcystin in the tissues of commercially important fish, such as tilapia [36], and shellfish, such as the blue mussel [45]. The highest concentrations tend to be localized in gastrointestinal organs [36]. In addition to consumptive issues, recreational use of estuarine waters might also be affected by the presence of toxic M. aeruginosa blooms [7]. Irritation due to con- tact of microcystin with epithelial tissues has been ob- served in humans, including blistering of affected tissues and hepatoenteritis [4,46]. Toxin exposure can occur through direct exposure to water via inhalation of aero- solized cells and contaminated water particles. Anecdotal evidence has linked several cases of pneumonia to rec- reational usage of waters during a M. aeruginosa bloom [47]. A microcystin LR concentration of 20 μgL–1 has been suggested as a threshold level of concern for recrea- tional exposure [4], but more definitive guidelines re- main an issue of debate and continued research [48]. The longevity of the effects of toxic M. aeruginosa blooms in different ecosystems depend on factors that accelerate the degradation or dilution of the toxin, such as ultraviolet radiation, strong oxidizers, naturally occur- ring bacteria which deactivate or otherwise eliminate microcystins [37], and hydrologic considerations, such as tidal flushing and water residence time, which define the rates of dilution of both toxic cells and extracellular toxin. Greater rates of exchange with coastal marine water also decrease the spatial and temporal window of salinities favorable for survival. The results suggest that the influ- ence of M. aeruginosa and/or its toxins can extend well out into estuaries, particularly those with restricted water exchange with coastal waters where mesohaline condi- tions can persist for extended periods of time. REFERENCES [1] W. W. Carmichael. “Toxic Microcystis and the Environ- ment,” In: M. F. Watanabe, K. Harada, W. W. Carmi- chael and H. Fujiki, Eds., Toxic Microcystis, CRC Press, Boca Raton, 1996. [2] H. W. Paerl, R. S. Fulton, P. H. Moisander and J. Dyble, “Harmful Freshwater Algal Blooms, with an Emphasis on Cyanobacteria,” The Scientific World Journal, Vol. 1, 2001, pp. 76-113. [3] R. W. Zurawell, H. Chen, J. M. Burke and E. E. Prepas, “Hepatotoxic Cyanobacteria: A Review of the Biological Importance of Microcystins in Freshwater Environ- ments,” Journal of Toxicology and Environmental Health, Part B, Vol. 8, No. 1, 2005, pp. 1-37. [4] I. Chorus and J. Bartram, “Toxic Cyanobacteria in Water: A Guide to Their Public Health Consequences, Monitor- ing, and Management,” E & FN Spoon, London, 1999. doi:10.4324/9780203478073 [5] K. Kaya. “Toxicology of Microcystins,” In: M.F. Wata- nabe, K. Harada, W. W. Carmichael and H. Fujiki, Eds., Toxic Microcystis, CRC Press, Boca Raton, 1996. [6] C. Wiegand and S. Pflugmacher, “Ecotoxicological Ef- fects of Selected Cyanobacterial Secondary Metabolites: A Short Review,” Toxicology and Applied Pharmacology, Vol. 203, No. 3, 2005, pp. 201-218. doi:10.1016/j.taap.2004.11.002 [7] W. W. Carmichael, S. M. Azevedo, J. S. An, R. J. Molica, E. M. Jochimsen, S. Lau, K. L. Rinehart, G. R. Shaw and G. K. Eaglesham, “Human Fatalities from Cyanobacteria: Chemical and Biological Evidence for Cyanotoxins,” En- vironmental Health Perspectives, Vol. 109, No. 7, 2001, pp. 663-668. doi:10.1289/ehp.01109663 [8] J. H. Landsberg, “The Effects of Harmful Algal Blooms on Aquatic Organisms,” Reviews in Fisheries Science, Vol. 10, No. 2, 2002, pp. 113-390. doi:10.1080/20026491051695 [9] I. Chorus, “Cyanobacterial Toxin Research and Its Ap- plication in Germany: A Review of the Current Status,” Environmental Toxicology, Vol. 17, No. 4, 2002, pp. 358- 360. doi:10.1002/tox.10072 [10] S. H. White, L. J. Duivenvoorden and L. D. Fabbro, “A Decision-Making Framework for Ecological Impacts As- sociated with the Accumulation of Cyanotoxins (Cylin- drospermopsin and Microcystin),” Lake and Reservoir Management, Vol. 10, No. 1, 2005, pp. 25-37. doi:10.1111/j.1440-1770.2005.00258.x [11] B. W. Ibelings and K. E. Havens, “Cyanobacterial Toxins: A Qualitative Meta-Analysis of Concentrations, Dosage, and Effects in Freshwater and Marine Biota,” Advances in Experimental Medicine and Biology, Vol. 619, 2008, pp. 675-732. doi:10.1007/978-0-387-75865-7_32 [12] E. M. Jochimsen, W. W. Carmichael, J. S. An, D. M. Copyright © 2011 SciRes. JEP  Growth and Toxin Production by Microcystis Aeruginosa PCC 7806 (Kutzing) Lemmerman 673 at Elevated Salt Concentrations Cardo, S. T. Cookson, C. E. Holmes, M. B. Antunes, D. A. de Melo Filho, T. M. Lyra, V. S. Barreto, S. M. Azevedo and W. R. Jarvis, “Liver Failure and Death after Exposure to Microcystins at a Hemodialysis Center in Brazil,” The New England Journal of Medicine, Vol. 338, No. 13, 1998, pp. 873-878. doi:10.1056/NEJM199803263381304 [13] P. J. Oberholster, A. Botha and J. U. Grobbelaar, “Mi- crocystis Aeruginosa: Source of Toxic Microcystins in Drinking Water,” African Journal of Biotechnology, Vol. 3, No. 3, 2004, pp. 159-168. [14] C. Svrcek and D. W. Smith, “Cyanobacteria Toxins and the Current State of Knowledge on Water Treatment Op- tions: A Review,” Journal of Environmental Engineering and Science Vol. 3, No. 3, 2004, pp. 155-185. doi:10.1139/s04-010 [15] P. W. Lehman, G. Boyer, C. Hall, S. Waller and K. Gerhts, “Distribution and Toxicity of a New Colonial Microcystis Aeruginosa Bloom in the San Francisco Bay Estuary, California,” Hydrobiologia, Vol. 541, No. 1, 2005, pp. 87-99. doi:10.1007/s10750-004-4670-0 [16] V. N. Nikulina, “Seasonal Dynamics of Phytoplankton in the Inner Neva Estuary in the 1980’s and 1990’s,” Oceanologia, Vol. 45, 1, 2003, pp. 25-39. [17] C. Rocha, H. Galvao and A. Barbosa, “Role of Transient Silicon Limitation in the Development of Cyanobacteria Blooms in the Guadiana Estuary, South-Western Iberia,” Marine Ecology Progress Series, Vol. 228, 2002, pp. 35- 45. doi:10.3354/meps228035 [18] R. Atkins, T. Rose, R. S. Brown and M. Robb, “The Mi- crocystis Cyanobacteria Bloom in the Swan River— February 2000,” Water Science and Technology, Vol. 43, No. 3, 2001, pp. 107-114. [19] E. J. Phlips, S. Badylak, J. Hart, D. Haunert, J. Lockwood, K. O’Donnell, D. Sun, P. Viveros and M. Yilmaz, “Cli- matic Influences on Autochthonous and Allochthonous Phytoplankton Blooms in a Subtropical Estuary, St. Lucie Estuary, Florida, USA,” Estuaries and Coasts, 2011, in Press. [20] E. J. Phlips, J. Hendrickson, E. L. Quinlan and M. Cichra, “Meteorological Influences on Algal Bloom Potential in a Nutrient-Rich Blackwater River,” Freshwater Biology, Vol. 52, No. 11, 2007, pp. 2141-2155. doi:10.1111/j.1365-2427.2007.01844.x [21] S. Otsuka, S. Suda, R. Li, M. Watanabe, H. Oyaizu, S. Matsumoto and M. Watanabe, “Characterization of Mor- phospecies and Strains of the Genus Microcystis (Cyano- bacteria) for a Reconsideration of Species Classification,” Phycologica l Research, Vol. 47, 1999, pp. 189-197. doi:10.1111/j.1440-1835.1999.tb00298.x [22] K. G. Sellner, R. V. Lacouture and C. R. Parrish, “Effects of Increasing Salinity on a Cyanobacterial Bloom in the Potomac River Estuary,” Journal of Plankton Research, Vol. 10, No. 1, 1988, pp. 49-61. doi:10.1093/plankt/10.1.49 [23] L. Tonk, K. Bosch, P. M. Visser and J. Huisman, “Salt Tolerance of the Harmful Cyanobacterium Microcystis Aeruginosa,” Aquatic Microbial Ecology, Vol. 46, No. 2, 2007, pp. 117-123. doi:10.3354/ame046117 [24] P. T. Orr, G. J. Jones and G. B. Douglas, “Response of Cultured Microcystis Aeruginosa from the Swan River, Australia, to Elevated Salt Concentration and Conse- quences for Bloom and Toxin Management in Estuaries,” Marine and Freshwater Research, Vol. 55, No. 3, 2004, pp. 277-283. doi:10.1071/MF03164 [25] J. A. Baker, B. A. Neilan, B. Entsch and D. B. McKay, “Identification of Cyanobacteria and Their Toxigenicity in Environmental Samples by Rapid Molecular Analysis,” Environmental Toxicology, Vol. 16, No. 6, 2001, pp. 472-482. doi:10.1002/tox.10010 [26] D. Schatz, Y. Keren, O. Hadas, S. Carmeli, A. Sukenik and A. Kaplan, “Ecological Implications of the Emer- gence of Non-Toxic Subcultures from Toxic Microcystis Strains,” Environmental Microbiology, Vol. 7, No. 6, 2005, pp. 798-805. doi:10.1111/j.1462-2920.2005.00752.x [27] K. R. James, B. Cant and T. Ryan, “Responses of Fresh- water Biota to Rising Salinity Levels and Implications for Saline Water Management: A Review,” Australian Jour- nal of Botany, Vol. 51, 2003, pp. 703-713. doi:10.1071/BT02110 [28] P. T. Orr and G. J. Jones, “Relationship between Micro- cystin Production and Cell Division Rates in Nitrogen- Limited Microcystis Aeruginosa Cultures,” Limnology and Oceanography, Vol. 43, No. 7, 1998, pp. 1604-1614. doi:10.4319/lo.1998.43.7.1604 [29] J. M. Verspagen, J. Passarge, K. D. Johnk, P. M. Visser, L. Peperzak, P. Boers, H. J. Laanbroek and J. Huisman, “Water Management Strategies against Toxic Microcystis Blooms in the Dutch Delta,” Ecological Applications, Vol. 16, 2006, pp. 313-327. doi:10.1890/04-1953 [30] D. R. Hoagland and D. L. Arnon, “The Water Culture Method for Growing Plants without Soil,” California Ag- ricultural Experiment Station Circular, Vol. 347, 1950, pp. 1-32. [31] R. E. Slovacek and P. J. Hannan, “In Vivo Fluorescence Determinations of Phytoplankton Chlorophyll A,” Lim- nology and Oceanography, Vol. 22, 5, 1977, pp. 919-925. doi:10.4319/lo.1977.22.5.0919 [32] American Public Health Association (APHA), “Standard Methods for the Examination of Water and Wastewater,” American Public Health Association, American Water Works Association, and Water Pollution Control Federa- tion, 19th Ed., Washington D.C., 1995. [33] R. J. Porra, W. A. Thompson and P. E. Kriedemann, “De- termination of Accurate Extinction Coefficients and Si- multaneous-Equations for Assaying Chlorophyll-a and Chlorophyll-b Extracted with 4 Different Solvents— verification of the Concentration of Chlorophyll Stan- dards by Atomic-Absorption Spectroscopy,” Biochimica et Biophysica Acta, Vol. 975, No. 3, 1989, pp. 384-394. doi:10.1016/S0005-2728(89)80347-0 Copyright © 2011 SciRes. JEP  Growth and Toxin Production by Microcystis Aeruginosa PCC 7806 (Kutzing) Lemmerman at Elevated Salt Concentrations Copyright © 2011 SciRes. JEP 674 [34] H. Utermohl, “Zur vervollkommnung der quatitativen phytoplankton-methodik,” Mitteilungen-Internationale Ve- reinigung fur Theoretische und Angewandte Limnologie, Vol. 9, 1958, pp. 1-38. [35] J. S. Metcalf and G. A. Codd, “Microwave Oven and Boiling Waterbath Extraction of Hepatotoxins from Cyanobacterial Cells,” FEMS Microbiology Letters, Vol. 184, No. 2, 2000, pp. 241-246. doi:10.1111/j.1574-6968.2000.tb09021.x [36] V. F. de Magalhães, R. M. Soares and S. M. F. O. Azevedo, “Microcystin Contamination in Fish from the Jacarepaguá Lagoon (Rio de Janeiro, Brazil): Ecological Implication and Human Health Risk,” Toxicon, Vol. 39, No. 7, 2001, pp. 1077-1085. doi:10.1016/S0041-0101(00)00251-8 [37] M. F. Watanabe, K. Tsuji, Y. Watanabe, K. Harada and M. Suzuki, “Release of Heptapeptide Toxin (Microcystin) during the Decomposition Process of Microcystis Aerugi- nosa,” Natural Toxins, Vol. 1, 1992, pp. 48-53. doi:10.1002/nt.2620010110 [38] I. R. Falconer, A. Choice and W. Hosja, “Toxicity of the Edible Mussel (Mytilus edulis) Growing Naturally in an Estuary during a Water-Bloom of Blue-Green Alga Nodu- laria Spumigena,” Journal of Environmental Toxicology and Water Quality, Vol. 7, No. 2, 1992, pp. 119-123. doi:10.1002/tox.2530070203 [39] E. E. Prepas, B. G. Kotak, L. M. Campbell, J. C. Evans, S. E. Hrudey and C. F. B. Holmes, “Accumulation and Eli- mation of Cyanobacterial Hepatotoxins by the Freshwater Clam Anodonta Grandis Simpsoniana,” Canadian Jour- nal of Fisheries and Aquatic Sciences, Vol. 54, 1997, pp. 41-46. [40] M. F. Watanabe, H. D. Park, F. Kondo, K. Harada, H. Hayashi and T. Okino, “Identification and Estimation of Microcystins in Freshwater Mussels,” Natural Toxins, Vol. 5, 1997, pp. 31-35. doi:10.1002/(SICI)(1997)5:1<31::AID-NT5>3.0.CO;2-X [41] C. Carbis, G. Rawlin, P. Grant, G. Mitchell, J. Anderson and I. McCauley, “A Study of Feral Carp, Cyprinus Car- pio L., Exposed to Microcystis aeruginosa at Lake Mokoan, Australia, and Possible Implications for Fish Health,” Journal of Fish Diseases, Vol. 20, 1997, pp. 81-91. doi:10.1046/j.1365-2761.1997.d01-111.x [42] R. J. Andersen, H. A. Luu, D. Z. Chen, C. F. Holmes, M. L. Kent, M. Le Blanc, F. J. Taylor and D. E. Williams, “Chemical and Biological Evidence Links Microcystins to Salmon ‘Netpen Liver Disease’,” Toxicon, Vol. 31, No. 10, 1993, pp. 1315-1323. doi:10.1016/0041-0101(93)90404-7 [43] N. R. Bury, F. B. Eddy and G. A. Codd, “The Effects of the Cyanobacterium Microcystis Aeruginosa, the Cyano- bacterial Hepatotoxin Microcystin-LR, and Ammonia on Growth Rate and Ionic Regulation of Brown Trout,” Journal of Fish Biology, Vol. 46, 2005, pp. 1042-1054. [44] K. Gaid and Y. Treal, “Le dessalement des eaux par os- mose inverse: l’expérience de Véolia Water,” Desalina- tion, Vol. 203, 2007, pp. 1-14. doi:10.1016/j.desal.2006.03.523 [45] D. E. Williams, M. Craig, T. L. McCready, S. C. Dawe, M. L. Kent, C. F. Holmes and R. J. Andersen, “Evidence for a Covalently Bound form of Microcystin-LR in Salmon Liver and Dungeness Crab Larvae,” Chemical Research in Toxicology, Vol. 10, 1997, pp. 463-469. . doi:10.1021/tx9601519 [46] I. R. Falconer and T. H. Buckley, “Tumour Promotion by Microcystis sp., a Blue-Green Alga Occurring in Water Supplies,” The Medical Journal of Australia, Vol. 150, 1989, pp. 351. [47] P. C. Turner, A. J. Gammie, K. Hollinrake and G. A. Codd, “Pneumonia Associated with Contact with Cyano- bacteria,” British Medical Journal, Vol. 300, 1990, pp. 1440-1441. doi:10.1136/bmj.300.6737.1440 [48] I. Chorus, I. R. Falconer, H. J. Salas and J. Bartram “Health Risks Caused by Freshwater Cyanobacteria in Recreational Waters,” Journal of Toxicology and Envi- ronmental Health, Part B, Vol. 3, No. 4, 2000, pp. 323- 347.
|