 Materials Sciences and Applicat ion, 2011, 2, 1076-1082 doi:10.4236/msa.2011.28145 Published Online August 2011 (http://www.SciRP.org/journal/msa) Copyright © 2011 SciRes. MSA Indentation Creep Behavior and Microstructure of Cu-Ge Ferrites Hesham Mohaned Z ak i1,2*, A li Mohamed Abdel-Daiem1,2, Yah ia Ibrahim Swi lem1,2, Fari d El-Tantawy3, Fahad Maso ud A l-Marzouki1, Ahmed Ab dall ah A l-Ghamdi1, S al e h A l-Heniti1, Far ag S aid Al-Hazmi1, T alal Sad aka Al-Harbi1 1Department of Physics, Facul ty of Science, King Abdulaziz University, Jeddah, Kingdom of Saudi Arabia ; 2De par t ment of Physics, Facult y of Science, Zagazi g Unive r sit y, Zaga zig, Egypt;3Depar tment of Physics, Faculty of Science, Suez Canal University, Ismailia, Egypt Department of Physics. Email: *dakdik2001@yahoo.com; hesham_zaki@zu.edu.eg Received Februar y 26th, 2011; re vise d May 5th, 2011; accepted May 20th, 2011. ABS TRACT Cu-Ge ferrite was prepared using the standard ceramic method. The creep rate of polycrystalline Cu1+xGexFe2-2xO4 ferrite has been measured as a function of time at room temperature. It is found that the indentation length increases with the i ncrease of both time and applied load. A regime of indiv idual cree p curves i s observed f or the f i rst and second stages. It is not possible to record the third stage of the curve as usually happened in an ordinary creep test, because fracture of the samples does not occur. The slope is found to increase wi th i ncreasing germanium and copper content in the steady state region. The high value of n (st re ss exponent f act or ) indicates that the disloc ati on c reep is the dominate mechanism. The porosity arrangements developed within the specimens were examined using optical microscope. The resul ts are di scus se d with regard to models de scribi ng the role of the steady state creep rate of metals. The morphology of the samples shows that t he porosity is increased by increasing bot h copper and germanium i ons. Keywords: Ferrit es, Indentati on Creep, Microstructure 1. Introduction Ferri tes—ceramic ferromagnetic materials have been considered as highly important electronic materials for more than half a cen tury. Ceramic like ferromagnetic materials, which are mainly composed of ferric oxide, α-Fe2O3, are called “ferrites”. Although the saturation magn etization for fer- rites is less than half that of ferromagnetic alloys, they have advantages, such as applicability at higher frequen- cy, greater heat resistance, higher corrosion resistance an d lower cost. The pr act ical a ppl icat i on s of fer ri tes ha ve been expa nded by compl et ely utiliz ing th ese adv antage s . Individual creep curves generally show primary, sec- ondary, and tertiary creep. The majority of the primary creep is not recoverable. The best representation of the data is one where the creep rate depends exponentially on the str es s , rath er tha n on the traditional po w e r law. The steady state rate equation for creep of crystalline materi als is often represent ed by (1) where is th e str ain rate, is the applied stress, A is a material parameter, d is the grain size, Q is the activa- tion energy for creep, R is the gas constant, T is the tem- per at ur e, n den ot es th e stres s expon ent fa ctor and p i s the grain size exponent. Nishikawal et al. [1], Nish ikawa and okamoto [2] dis- cuss ed the control of deformation mechanisms for creep unde r s ome con dit i on s by a na l yz in g str ess, gr ain s ize an d temperature dependency of steady state strain rate. Ac- cording to their study, at intermediate stresses, power low creep is th e dominant mechanism giving size of n = 3 to 5 , p = 0 and Q = QL, in which QL is the activation energy of the lattice diffusion. There are three distinct deformation mechanisms which exhibit the stress depen- dence. Two of them include the flow of vacancies from surface s and gr a in boundari es under r ela ti ve c ompress ion. In th e ca se that va can cies fl ow t hrough th e cr yst a l lat ti ce , p = 2, Q = QL (Nabarro-Her ring creep) [3,4]. In the ca se th at th e va can cies flow al ong gr a in bounda r ie s, p = 3 and Q = Qb, where Qb is the activation energy for grain boundary diffusion (Coble creep) [5]. The third process was reported firstly by Harper and Dorn [ 6 ] on alumi- num, in volves dislocation, multiplication and motion. 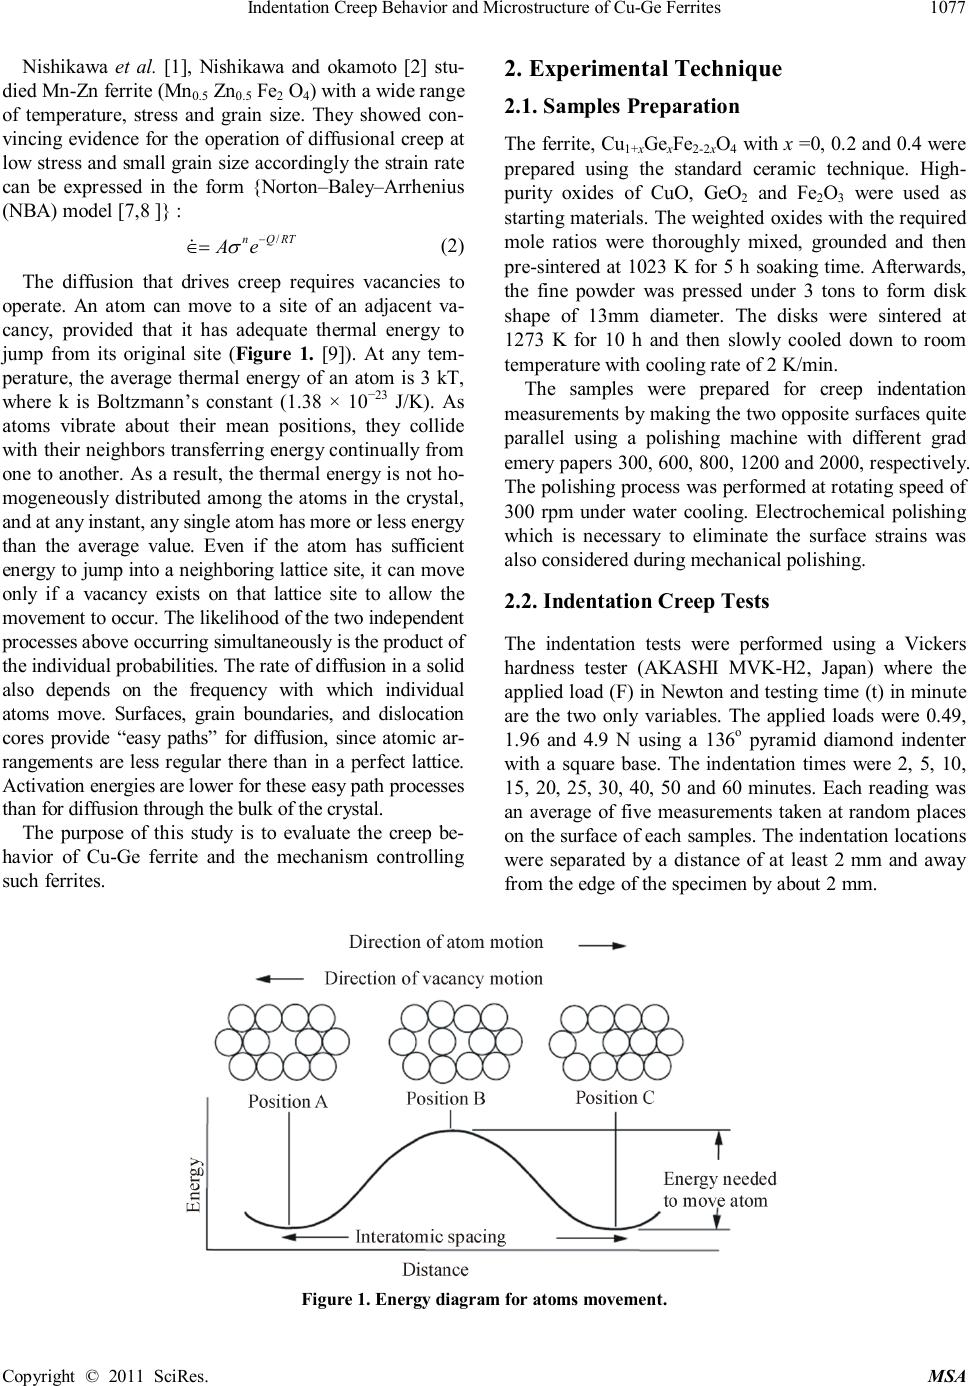 Indentation Cree p Behavior and Microstr ucture of C u -Ge F erri tes Copyright © 2011 SciRes. MSA Nishikawa et al. [1], Nishikawa and okamoto [2] stu- died Mn -Zn fer rite ( Mn0.5 Zn0.5 Fe2 O4) with a wide range of temperature, stress and grain size. They showed con- vin cing evidence for th e op eration of diffusional creep at low st r ess an d sm al l grain siz e accor di ngly th e strain rate can be expressed in the form {Norton–Baley–Arrhenius (NBA) model [7,8 ]} : (2) The diffusion that drives creep requires vacancies to operate. An atom can move to a site of an adjacent va- cancy, provided that it has adequate thermal energy to jump from its original site (Figure 1. [9]). At any tem- perature, the average thermal energy of an atom is 3 kT, where k is Boltzmann’s constant (1.38 × 10⁻²³ J/K). As atoms vibrate about their mean positions, they collide with their neighbors transferring energy continually from one to another. As a result, the thermal energy is not ho- mogeneousl y distributed among the atoms in the crystal, and at any ins tant, any single a to m has more or less energy than the average value. Even if the atom has sufficient energy t o jump int o a n eighbor ing la ttice site, it can move only if a vacancy exists on that lattice site to allow the m ove ment to oc cur . The l ikelihood of the two independent proces s e s above oc c urring si m ultaneous ly is t he product of the individua l probabilities. The rate of diffusion in a s olid also depends on the frequency with which individual atoms move. Surfaces, grain boundaries, and dislocation cores provide “easy paths” for diffusion, since atomic ar- rangement s are less r egular ther e tha n in a perfect lattice. Acti vati on energies are lower for these easy path processes tha n for diff usion through the bu lk of the crysta l. The purpose of this study is to evaluate the creep be- havior of Cu-Ge ferrite and the mechanism controlling such ferrites. 2. Experimental Technique 2.1. Samples Preparatio n Th e ferrite, Cu1+xGexFe2-2xO4 with x = 0, 0. 2 and 0. 4 wer e prepared using the standard ceramic technique. High- purity oxides of CuO, GeO2 and Fe2O3 were used as star tin g mat erial s. The wei ght ed oxides with th e requir ed mole ratios were thoroughly mixed, grounded and then pre-sintered at 1023 K for 5 h soaking time. Afterwards, the fine powder was pressed under 3 tons to form disk shape of 13mm diameter. The disks were sintered at 1273 K for 10 h and then slowly cooled down to room temperature with cooling rate of 2 K/min. The samples were prepared for creep indentation measurements by makin g the two opposite surfaces quite parallel using a polishing machine with different grad emery papers 300, 600, 800, 1200 an d 2000, respectively. Th e pol i shi n g pr oc ess wa s perform ed at rotating speed of 300 rpm under water cooling. Electrochemical polishing which is necessary to eliminate the surface strains was also considered during mechanical polishing. 2.2. Indentation Creep Tests The indentation tests were performed using a Vickers hardness tester (AKASHI MVK-H2, Japan) where the applied load (F) in Newton and testing time (t) in minute are the two only variables. The applied loads were 0. 49, 1.96 and 4.9 N using a 136o pyramid diamond indenter with a square base. The indentation times were 2, 5, 10, 15, 20, 25, 30, 40, 50 and 60 minutes. Each reading was an average of five measurements taken at ran dom places on the surface of each samples. The indentation locations were separated by a distance of at least 2 mm and away fr om the edge of the speci m en by about 2 mm. Figure 1. En ergy diagram for atom s movem ent.  Indentation Cree p Behavior and Microstr ucture of C u -Ge F erri tes Copyright © 2011 SciRes. MSA 2.3. Micros t ructure Th e mi cr ostr uctur e of the ferrite specimen s wa s obt ain ed using Nikon optical microscope model (M 001-378, Ja- pan) pr ovi ded with a computerized camera (FUJIX Digi- tal Camera HC-300 I). An electrochemical etching is performed in an etching cell with Pt hollow cylindrical cathode, where the sample is placed as an anode in the center of cylindrical cathode. Th e s amples were etched in a solution composed of 90% acetic acid and 10% pe- rochloric acid for 20 sec. After that the samples were washed using deionized water and finally cleaned in acetone using ul tras oun d cleaner. 3. Results and Disc ussion 3.1. Creep Behavior Figure 2 shows the variation of indentation diagonal length d versus time under constant loads of 0.49, 1.96 an d 4.9 N for the s tudi ed fer ri te with differ en t Cu and Ge concen tr ation. It can be seen from the figure that th e in- dentation length increases with the increase of both Figure 2. Indentation diagonal length curves obtained at different loads for Cu-Ge ferrites. time an d applied load. It also shows th e two stages which are similar to an ordinary creep curve. The first stage indicates a rapid increase in indentation length up to 20 min for all samples when the load is at its highest value (4.9 N) followed by the second stage with a steady or linear increase. Since compression is used as the hard- ness test, fracture of the samples does not occur. There- fore, it is not possible to record the third stage of the curve as usually happened in an ordinary creep test. In addition, the figure shows that the level in the steady state region and slope are increased by increasing the germanium and copper concentration instead of iron. This implies that as Ge4+ and Cu2+ ions increase, room temperature creep occurs more rapidly. Figure 3 shows the rate of variation in indentation length (do) against dwell time, which obtained by diffe- rentiation of the curves in figure 1 to show the effect of increasing copper and germanium more clearly. One can see from this figure that there is a sharp dr op in th e cr eep rates at short times corresponding to the primary creep stage, followed by a lower decreasing rate region which corresponding to the steady state stage of the studied compositions. It is further demonstrated that samples with high concentration of both copper and germanium ion s ha ve h igh er cr eep ra t es than tha t of lower concen tr a- tions. It is also observed tha t the almost for all composi- tion s, there is exists of an apparent steady state. To obtain the steady state creep exponents, the fol- lowing equation of creep analysis was applied to the in- dentation data of th e sa mples [10]. n = (3) where Hv is the Vickers hardness number which calcu- 020 40 60 0.010 0.015 0.020 0.025 Cu- Ge (x=0.0_ Cu- Ge( x=0.2) Cu- Ge( x=0.4) t (min ) F=0.49 N 020 40 60 0.024 0.030 0.036 0.042 Cu- Ge( x=0.0) Cu- Ge( x=0.2) Cu- Ge( x=0.4) d (mm) t (min ) F=1.96 N 020 40 60 0.03 0.04 0.05 0.06 0.07 Cu- Ge( x=0.0) Cu- Ge( x=0.2) Cu- Ge( x=0.4) F=4.9 N  Indentation Cree p Behavior and Microstr ucture of C u -Ge F erri tes Copyright © 2011 SciRes. MSA Figure 3. Indentation length rate (do) plotted against dwell t ime for 0.49 up t o 4.9 N loads for C ux Ge 1_x Fe2O4. lated fr om the relation, Hv = 0. 1854 [F/d2] [11], in which d is the indentation diagonal length and F is the applied load, ̇ is the rate variation in indentation length and F is the applied lo ad. The rate of diagonal variation is plotted against the Vickers hardness number as shown in Fi gure 4 for all samples and testin g loads. A straight line is resulted from the least square fitting of all data points usin g origin lab program for each sample and load. M. Sternitze and H. Hubner [12] studied the creep properties for Al2O3/ Sic nano-composite and they found that the stress exponent fa c tor (n ) r a nged fr om 2. 5 to 5. 5. Creep stress exponent can help to narrow the field Figure 4. Pl ots of ln (do) ve rs u s l n ( H V) at di ff eren t l oads to determine the stress exponent for the studi ed ferrites. 010 20 30 40 50 60 0.0000 0.0002 0.0004 0.0006 d o ( mm min -1 ) D e w e ll time, min. Cu-Ge 0 Cu-Ge 0.2 Cu-Ge 0.4 F=0.49 N 010 20 30 40 50 60 0.0000 0.0002 0.0004 0.0006 0.0008 0.0010 do( mm min-1) D e w ll time, min. Cu-Ge0 Cu-Ge0.2 Cu-Ge0.4 F=1.96 N 010 20 30 40 50 60 0.0000 0.0005 0.0010 0.0015 0.0020 do(mm min-1) D e w e ll time, min Cu-Ge0 Cu-Ge0.2 Cu-Ge0.4 F=4.9 N 5.5 6.0 6.5 -12 -10 -8 -6 ln d o , mm, min -1 ln H Cu-Ge0 n=7.95 Cu-Ge0.2 n=4.74 Cu-Ge0.4 n=3.02 F=0.49 N 5.6 6.0 6.4 6.8 -12 -10 -8 -6 -4 ln d o ln H v Cu-Ge 0 n=12.1 Cu-Ge 0.2 n=14.5 Cu-Ge 0.4 n=3.4 F=1.96 N 5.6 6.0 6.4 6.8 -12 -10 -8 -6 -4 F=4.9 N Cu-Ge 0 n=10.7 Cu-Ge 0.2 n=6.8 Cu-Ge 0.4 n=4.7 ln d o ln H v  1080 Indentation Creep Behavior and Microstructure of Cu-Ge Ferrites Copyright © 2011 SciRe s. M SA among many theoretical possibilities [13]. It was re- ported that diffusion creep is associated with n value around one [14], grain boundaries sliding leads to n val- ues close to 2 [15] an d dislocation climbs r esponsible for n values in th e range of 4 - 6 [16]. Goetze [17] and Dur- than [18] indicated that the dislocation creep is the do- minating mechanism when the values of the stress com- ponent n lie between 3 and 10. In our present work the relatively high values of n (3 - 14.5) imply that the oper- ative creep mechanism in the studied samples is disloca- tion cr eep. The variation of hardness with dwell time due to in- dentation creep is shown in Figure 5. It is obvious that hardness decreases with increasing the dwell time. The decrease is very sharp in the first stage followed by a linear de crea se wi th increasin g ti me. Kagiarova et al. [19] stated that the low value of the stress exponent is cons ist ent with samples with low ca vit y concentration. According to the morphology of the inves- tigated samples, the porosity increases by incr easing cop- per and germanium concentration; accordingly the expo- nent stress factor would be increased too. As a result of that, we can assume that a higher concentration of dopent associated with the enhancement of cavity formation. Moreover, the indentation caused by the applied stress ma y cr eate ne w cavi ties. Then, as the stress increases the contribution of cavitations is expected to increase and hence the contribution to the creep rate will increase and con sequently the expon ent stress factor will increa se. 3.2. Micros t ructure In order to give an accur t at e vi ew about the morphology, optical microstructure for Cu-Ge ferrites are depicted in Figure 6. Th e m icr ogra ph s of th e studied samples reveal circular pores n arr owly distributed, sprea d throughout the entire microstructure. The interaction of grain boundary and porosity along with sintering temperature is impor- tant in determining the limiting grain size [20]. When many pores are present and the sintering temperature is not too high, grain grow th is inhibited. Figure 6 shows that the porosity of the samples are increased by increasing Ge and Cu ions content which making the density to decreases. When substituting Ge in small amount, the effect on the microstructure of Cu-fer r ite can be expl ained in term s of t he in creased pore mobility. This is due to the creation of excess cation va- cancy formation by doping the ferrite with high valence cations which can be argued from the site and change neutrality as well as the oxidation-reduction equilibrium of iron. It has been reported that the presence of large por es is due t o the am ount of met al ion vacan cies ca used by oxidation [21]. This structure indicates that the sam- ples can easily exhibit absorption and condensation of Figure 5. The variation of hardness aga inst time for differ- ent loads of Cu-Ge ferrites. water vapor as Ge4+ ions increase. Accor din g t o Hemeda [22,23] and E cklet [24] th e in cr ease of Cu2+ ion s leads to the in crease of porosit y. Also Visser et al. [25] state th at 020 40 60 200 400 600 800 1000 Cu -Ge 0 Cu -Ge 0.2 Cu -Ge 0.4 H v t (min ) F=1.96 N 020 40 60 200 400 600 800 1000 C u-Ge 0 C u-Ge 0.2 C u-Ge 0.4 H v t (min ) F=4.9 N 020 40 60 200 400 600 800 1000 C u-Ge0 C u-Ge0.2 C u-Ge0.4 Hv t (min ) F=0.49 N  Indentation Cree p Behavior and Microstr ucture of C u -Ge F erri tes Copyright © 2011 SciRes. MSA Figure 6. Cu-Ge ferrite s morphology. the non magneti c particles an d trace am ount of im pu r ities forming a non magnetic grain boundary leads to the re- duction of grain size and in creasing of por osi ty. Accur at e measurements of the grain size were hard to obtain be- cause of the difficulty to observe grain boundary by us- ing opti cal microscop y. 4. Conclusions 1) The indentation length increases with the increase of both time and applied lo ad. 2) By increasing the germanium and copper concen- trati on on the expenses of iron, room temperature creep occurs mo re rapidly. 3) Th e sam ples wi th hi gh con cen trat ion of bot h coppe r an d germanium i on s ha ve h igh er cr eep r at es than that of lower con centration s . 4) Th e r elatively h igh values of, creep str ess exponent (3 - 14.5) imply that the operative creep mechanism in the studied samples is dislocation creep. The porosity of the samples is increased by increasing G e a nd Cu ions c ont ent. REFERENCES [1] T. Nishika w a, Y. Okamoto, T. Nakagawa, H. Kimura and H. Takeda, “Dislocation Climb-Controlled Creep of Po- lycrystalline Mn-Z n Fer rite,” Journal of Applied Physics, Vol. 88, 1980, p. 538. [2] T. Nishikawa and Y. Okamoto, “Creep Deformation of Polycrystalline Mn-Zn Ferrite Proceeding of the Third Inter national Conference i n Fer ri te ,” Ce nt er for Acade mi c Publications, Japan, 1981, p. 306. [3] F. R. N. Nabarro, “De f ormation of Cr ys tal s by the Mot ion of Single Lons in Report of a Conference on the Strength of Solids (Bristol, U.K.),” Physical Society, London, 1948, pp. 75-90. [4] C. Herring, “Diffusional Viscoyity of a Polycrystalline Solid,” Journal of Applied Physics, Vol. 21, No. 5, 195 0, pp. 437-445. [5] R. L. Coble, “A Model for Boundary Diffusion Con- trolled Creep in Polycrystalline Materials,” Journal of Applied Physi cs, V ol. 34 , No. 6, 1963, pp. 1679-1682. doi:10.1063/1.1702656. [6] J. C. Ha rper and J. E. D om , “ Viscous Cr eep of Aluminum near Its Melting Temperature,” Ac ta Metal lurgica, Vol. 5. No. 11, November 1957, pp. 654-665. doi:10.1016/0001-6160(57)90112-8. [7] F. H. Nort on, “T he Cr ee p of St eel at High Tempera tur e,” McGr a w Hill, New York, 1929. [8] S.-H. Song, J. Wu, X. J. Wei, D. Kumar, S. J. Liu and L. Q. Weng , “Creep Pre oper ty Eva lua ti on 2.25 Cr -1Mo Low Alloy Steel,” Material Science and Engineering A, Vol. 527, No. 9, 2010, pp. 2398. doi:10.1016/j.msea.2010.01.007 [9] B. Wilshire and R. W. Evans, “Creep and Fracture of Engineering Materials and Structures,” Proceedings of Fifth International Conference, the Institute of Materials, 1993, p. 812. [10] A. Juhasz, P. Tasnadi and I. Kovacs, “Superplastic In-  1082 Indentation Creep Behavior and Microstructure of Cu-Ge Ferrites Copyright © 2011 SciRe s. M SA dentation Creep of Lead-Tin Eutectic,” Journal of Ma- terial Science Letters, Vol. 5, No. 1, 1986, pp. 535-536. [11] R . Roumina, B. Ra e isinia and R. Mahmudi, “Room Tem- perature Indentation Creep of Cast Pb-Sb Alloys,” Sci- ence Material, Vol . 51, 2004, p. 497. doi:10.1016/j.scriptamat.2004.05.048. [12] M. Sternitzke and H. Hubner, “Creep Mechanisms Of Alumina/Sic Nanocomposites Ceramic Engineering and Science Proceedings,” Mrityunjay Singh & Todd Jessen, The American Ceramic Society, 2001, p. 145. [13] A. R. Geranmayeh, R. Mahmudi, “Room-Temperature Indentation Creep of Lead Free Alloy,” Journal of Elec- tricity Material, 2005, Vol. 34, pp. 1002-1009. [14] T. G. Langdon, “Identifying Creep Mechanisms at Low Stresses,” Material Science Engeneering, Vol. A283, 2000, pp. 266-273. [15] B. Walser and O. D. Sherby, “Structure Dependence of Power Law Creep,” Scripta Metall, Vol. 16 , No. 2, 1982, pp. 213-219. doi:10.1016/0036-9748(82)90389-1 [16] G. Sharma, R. V. Ramanujan, T. R. G. Kutty and G. P. Tiwari, “Hot Hardness and Indentation Creep Studies of a Fe-28Al-3Cr-0.2C Alloy,” M aterial Science Engeneering, Vol. A278, 2000, pp.106-112. [17] C. Goetze and W. F. Brace, “Laboratory Obs ervations of High-Temperature Rheology of Rocks,” Tectonophysics, Vol. 113, No. 1-4, 1972, pp. 583-600. doi:10.1016/0040-1951(72)90039-X [18] D. L. Kohlstedt and C. Goetze, “Low-Stress High Tem- perature Creep in Olivine Single Crystals,” Journal of Geophysial Research, Vol. 79, 1974, p. 2045. [19] M. Kagiarova, W. Z. Barbara, Y. Shollock, Y. A. Boc- ca ccini and J. Dusza, “M icrostructure and C reep B ehavior of a Si3N4-SiC Microna nocomp osite,” Journal of Ameri- can Ceramic Society, Vol. 92, No. 2, 2009, pp. 439-444. doi:10.1111/j.1551-2916.2008.02848.x [20] W. D. Kingery, H. K. Bowen and D. R. Uhimann, “In- troduction t o Cera mi c Science, ” Wile y, New York, 1975, p. 474. [21] J. Smith, “Magnetic Properties of Materials,” McGraw Hill, New York, 1971. [22] D. M. Heme da and O. M. Hemeda, “Electrical, Structural, Magnetic and Transport Properties of Zn2BaFe 16O27 Doped with Cu2+,” Journal Magnetism Magnetic Matte- rials, Vol. 320, No. 8, 2008, pp. 1557-1562. doi:10.1016/j.jmmm.2008.01.006 [23] D. M. Heme da and O. M. Hemeda, “Electrical, S t ructural, Magnetic and Transport Properties of Zn2 Ba Fe 16O27 Doped with C u2+,” American Journal of A pp li ed Sciences, Vol. 5, No. 4, 2008, pp. 289- 295. doi:10.3844/ajassp.2008.289.295 [24] J. Eckelt, C. Bottger and J. Hesse, “AC Susceptibility in the Reentrant Spin-Glass System (Fe0.65Ni0.35)1-xMn,” Journal Magnetism Magnetic Matterials, Vol. 104, No. 3, 1992, pp.1665-1667. doi:10.1016/0304-8853(92)91502-K [25] E. G. Visser, M. T. Johnson, P. J. V. D. Zaag, “Ferrites: Production,” International Flavour-6, Japan, 1992, p. 807.
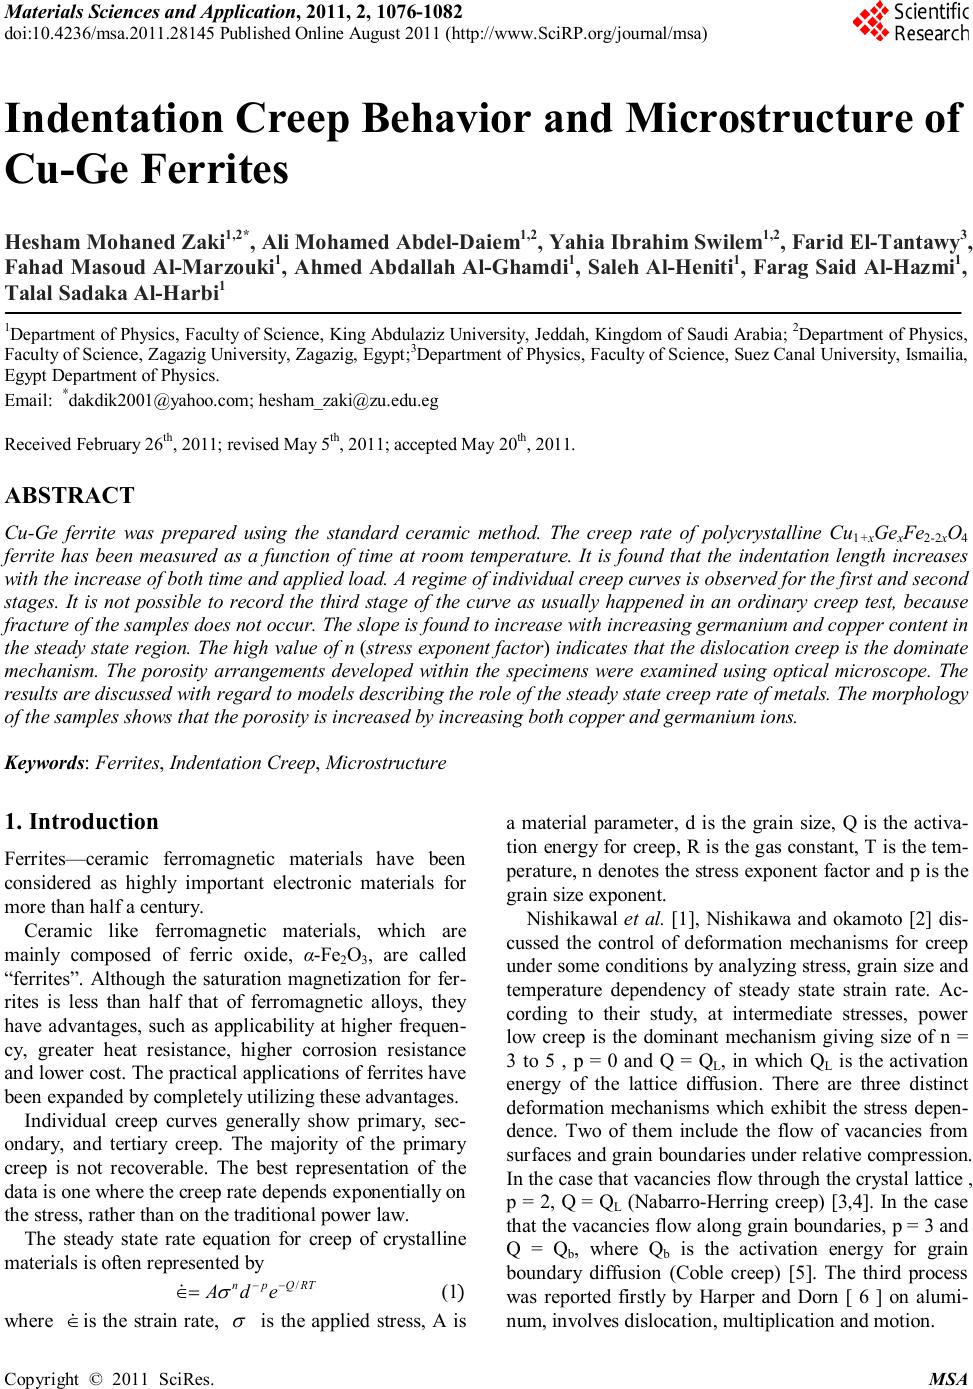
|