Paper Menu >>
Journal Menu >>
 J. Service Scie nce & Management, 2009, 3: 209-214 doi:10.4236/jssm.2009.23025 Published Online September 2009 (www.SciRP.org/journal/jssm) Copyright © 2009 SciRes JSSM The Relationship between Producer Service and Local Manufacturing Industry: Empirical Evidence from Shanghai Shouming CHEN, Jie LI, Meijuan JIA School of Economics and Management, Tongji University, Shanghai, China. Email: schen@tongji.edu.cn Received March 11th, 2009; revised May 13th, 2009; accepted July 17th, 2009. ABSTRACT Previous studies suggested that the development of producer service resulted from manufacturing outsourcing. On the other hand, competitive producer service can promote the progress of manufacturing industry. Theoretically, correla- tion may exist between them. According to co-integration theory, this paper empirically tests the time series data col- lected from both producer service and manufacturing industry in Shanghai, indicating that co-integration does exist between producer service and local manufacturing industry. Empirical results of this paper partially support the con- clusions of prior studies addressed above. Keywords: producer service, manufa cturing industry, co-integration testing, empirical analysis, shanghai 1. Introduction Producer service is one of the modern service industries that have been the forces promoting economic develop- ment in developed countries. Progress in producer ser- vice industry not only benefits itself but also signifi- cantly facilitates advanced manufacturing industry. A generally accepted view is that advanced manufacturing industry could not ex ist in China without the presence of advanced producer service. Subsequently, it is much more difficult for manufacturing industry to maintain comparable and competitive advantages. Therefore, it seems reasonable to suppose that core cities such as Shanghai should promote modern services mainly com- posed of producer service to serve manufacturing indus- try better in adjacent provinces and other parts of China. Is this assumption rational? Additionally, whether pro- ducer service in Shanghai really serves manufacturing industry in adjacent provinces and other parts of China need further and deeper investigation. This paper con- ducts empirical analysis and tries to briefly answer these questions. 2. Theories and Hypothesis Previous literatures define producer service from two perspectives. One definition focuses on objected ac- cepted services. Greenfield mentions that producer ser- vice mainly serves enterprises, non-profit organizations, and governments, rather than offering products and ser- vices to end users [1]. Harrington and Lombard state that producer server offer intermediate services to en terprises. [2] Stull and Madden suggest that producer service as- sists enterprises or organizations to offer other products or services, rather than providing services to private sec- tors or family sectors [3]. Th e other definition focuses on services that producer service can offer. This definition is an extension of original concept. According to Browning and Singleman, producer service is mainly composed of knowledge-intensive industries, for in- stance, finance, insurance, legal indu stry, and so forth [4]. Howells and Green state that producer service functions as intermediate agency promoting operational efficiency and bringing value to production and other services [5]. Daniels concludes several existing classifications of producer service and suggests that producer service could be classified to three categories. The first category is information processing service involved of banking, insurance, marketing, accounting, asset management, advertising, and information editing skill. The second is services related to business, such as sales, traffic man- agement, installation and maintenance of basic equip- 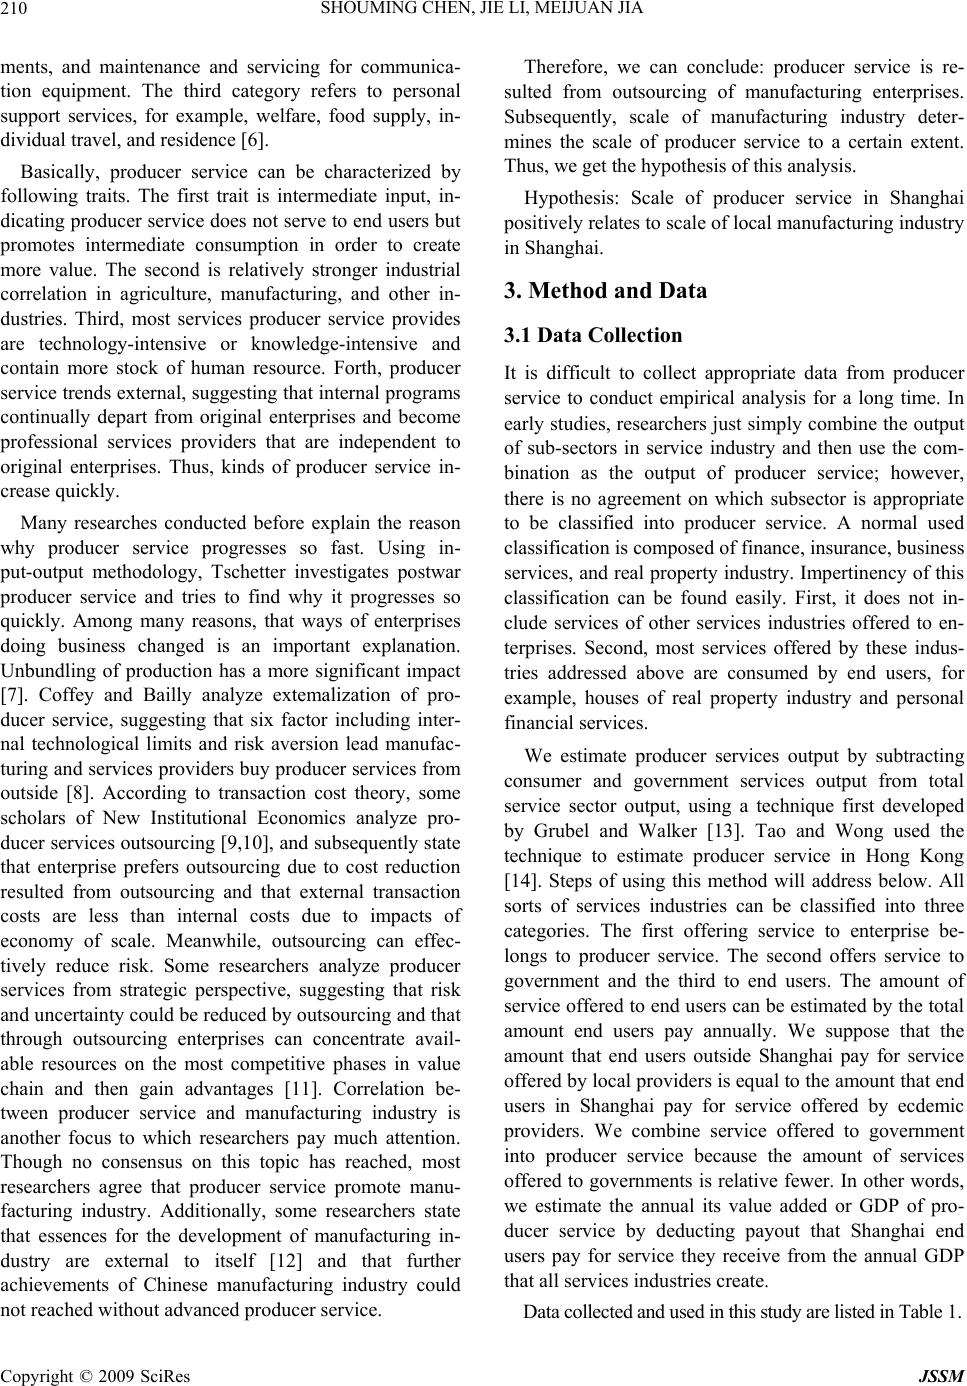 SHOUMING CHEN, JIE LI, MEIJUAN JIA 210 ments, and maintenance and servicing for communica- tion equipment. The third category refers to personal support services, for example, welfare, food supply, in- dividual travel, and residence [6]. Basically, producer service can be characterized by following traits. The first trait is intermediate input, in- dicating producer service does not serve to end users but promotes intermediate consumption in order to create more value. The second is relatively stronger industrial correlation in agriculture, manufacturing, and other in- dustries. Third, most services producer service provides are technology-intensive or knowledge-intensive and contain more stock of human resource. Forth, producer service trends external, suggestin g that internal p rograms continually depart from original enterprises and become professional services providers that are independent to original enterprises. Thus, kinds of producer service in- crease quickly. Many researches conducted before explain the reason why producer service progresses so fast. Using in- put-output methodology, Tschetter investigates postwar producer service and tries to find why it progresses so quickly. Among many reasons, that ways of enterprises doing business changed is an important explanation. Unbundling of production has a more significant impact [7]. Coffey and Bailly analyze extemalization of pro- ducer service, suggesting that six factor including inter- nal technological limits and risk aversion lead manufac- turing and services providers buy producer services from outside [8]. According to transaction cost theory, some scholars of New Institutional Economics analyze pro- ducer services outsourcing [9,10], and subsequently state that enterprise prefers outsourcing due to cost reduction resulted from outsourcing and that external transaction costs are less than internal costs due to impacts of economy of scale. Meanwhile, outsourcing can effec- tively reduce risk. Some researchers analyze producer services from strategic perspective, suggesting that risk and uncer tainty cou ld be r edu ced by o u tsour cing and that through outsourcing enterprises can concentrate avail- able resources on the most competitive phases in value chain and then gain advantages [11]. Correlation be- tween producer service and manufacturing industry is another focus to which researchers pay much attention. Though no consensus on this topic has reached, most researchers agree that producer service promote manu- facturing industry. Additionally, some researchers state that essences for the development of manufacturing in- dustry are external to itself [12] and that further achievements of Chinese manufacturing industry could not reached without advanced producer service. Therefore, we can conclude: producer service is re- sulted from outsourcing of manufacturing enterprises. Subsequently, scale of manufacturing industry deter- mines the scale of producer service to a certain extent. Thus, we get the hypothesis of this analysis. Hypothesis: Scale of producer service in Shanghai positively relates to scale of local manufacturing industry in Shanghai. 3. Method and Data 3.1 Data Collection It is difficult to collect appropriate data from producer service to conduct empirical analysis for a long time. In early studies, researchers just simply combine the output of sub-sectors in service industry and then use the com- bination as the output of producer service; however, there is no agreement on which subsector is appropriate to be classified into producer service. A normal used classification is composed of finance, insurance, business services, and real property industry. Impertinency of this classification can be found easily. First, it does not in- clude services of other services industries offered to en- terprises. Second, most services offered by these indus- tries addressed above are consumed by end users, for example, houses of real property industry and personal financial services. We estimate producer services output by subtracting consumer and government services output from total service sector output, using a technique first developed by Grubel and Walker [13]. Tao and Wong used the technique to estimate producer service in Hong Kong [14]. Steps of using this method will address below. All sorts of services industries can be classified into three categories. The first offering service to enterprise be- longs to producer service. The second offers service to government and the third to end users. The amount of service offered to end users can be estimated by the to tal amount end users pay annually. We suppose that the amount that end users outside Shanghai pay for service offered by local providers is equal to the amount that end users in Shanghai pay for service offered by ecdemic providers. We combine service offered to government into producer service because the amount of services offered to governments is relative fewer. In other words, we estimate the annual its value added or GDP of pro- ducer service by deducting payout that Shanghai end users pay for service they receive from the annual GDP that all services industries create. Data collected and used in this study are listed in Table 1. Copyright © 2009 SciRes JSSM 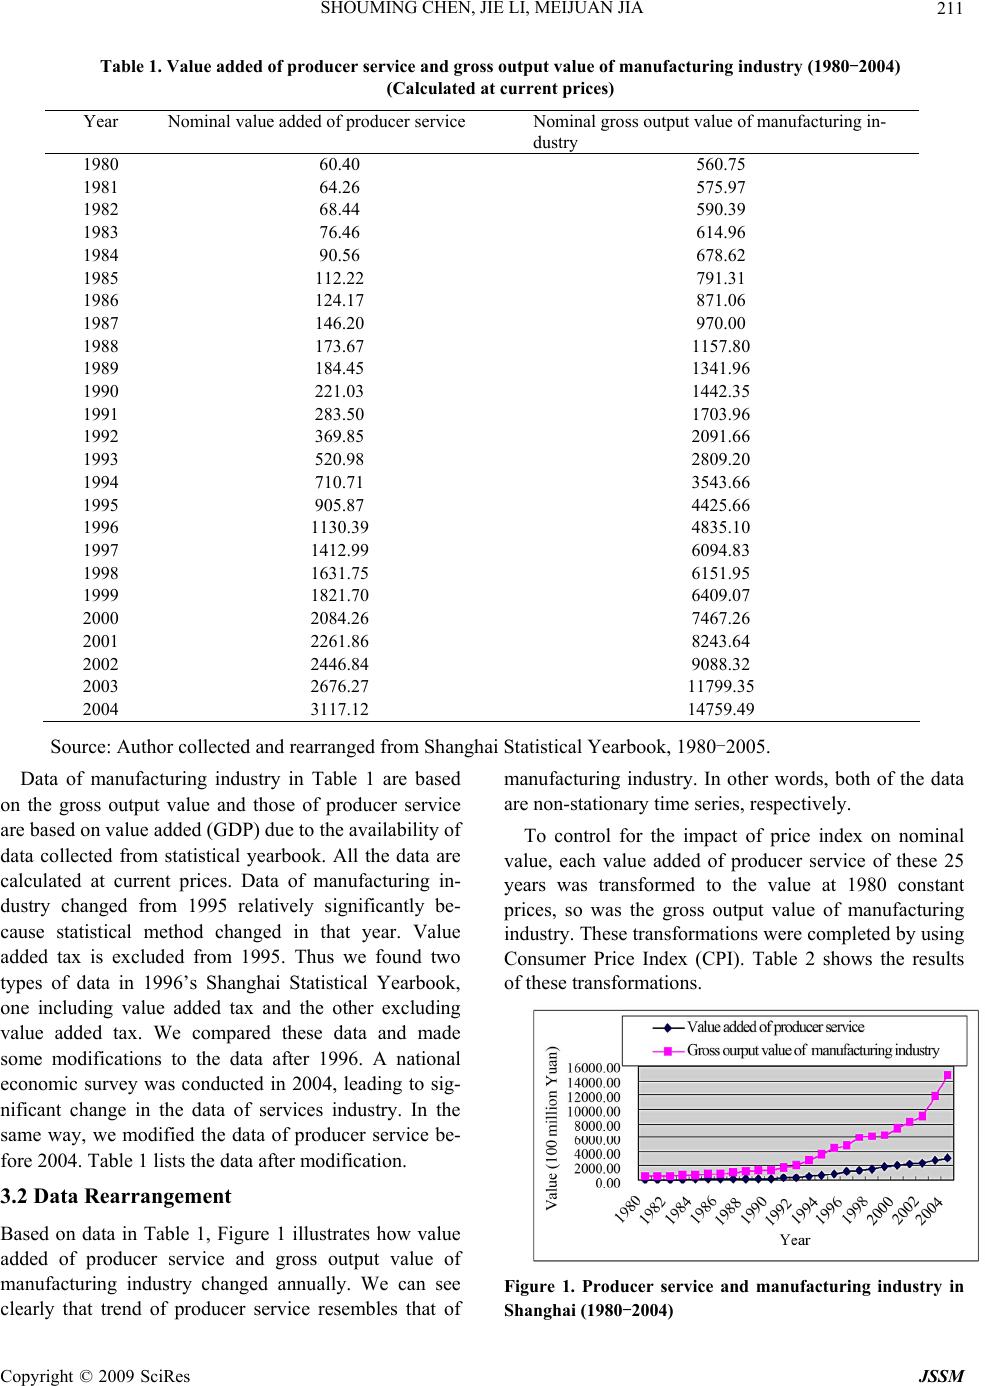 SHOUMING CHEN, JIE LI, MEIJUAN JIA 211 Table 1. Value added of producer service and gross output value of manufacturing industry (1980-2004) (Calculated at current prices) Year Nominal value added of producer service Nominal gross output value of manufacturing in- dustry 1980 60.40 560.75 1981 64.26 575.97 1982 68.44 590.39 1983 76.46 614.96 1984 90.56 678.62 1985 112.22 791.31 1986 124.17 871.06 1987 146.20 970.00 1988 173.67 1157.80 1989 184.45 1341.96 1990 221.03 1442.35 1991 283.50 1703.96 1992 369.85 2091.66 1993 520.98 2809.20 1994 710.71 3543.66 1995 905.87 4425.66 1996 1130.39 4835.10 1997 1412.99 6094.83 1998 1631.75 6151.95 1999 1821.70 6409.07 2000 2084.26 7467.26 2001 2261.86 8243.64 2002 2446.84 9088.32 2003 2676.27 11799.35 2004 3117.12 14759.49 Source: Author collected and rearranged from Shanghai Statistical Yearbook, 1980-2005. Data of manufacturing industry in Table 1 are based on the gross output value and those of producer service are based on value added (GDP) due to the availability of data collected from statistical yearbook. All the data are calculated at current prices. Data of manufacturing in- dustry changed from 1995 relatively significantly be- cause statistical method changed in that year. Value added tax is excluded from 1995. Thus we found two types of data in 1996’s Shanghai Statistical Yearbook, one including value added tax and the other excluding value added tax. We compared these data and made some modifications to the data after 1996. A national economic survey was conducted in 2004, leading to sig- nificant change in the data of services industry. In the same way, we modified the data of producer service be- fore 2004. Table 1 lists the data after modification. 3.2 Data Rearrangement Based on data in Table 1, Figure 1 illustrates how value added of producer service and gross output value of manufacturing industry changed annually. We can see clearly that trend of producer service resembles that of manufacturing industry. In other words, both of the data are non-stationary time series, respectively. To control for the impact of price index on nominal value, each value added of producer service of these 25 years was transformed to the value at 1980 constant prices, so was the gross output value of manufacturing industry. These transformation s were co mpleted by using Consumer Price Index (CPI). Table 2 shows the results of these transformations. Figure 1. Producer service and manufacturing industry in Shanghai (1980-2004) Copyright © 2009 SciRes JSSM 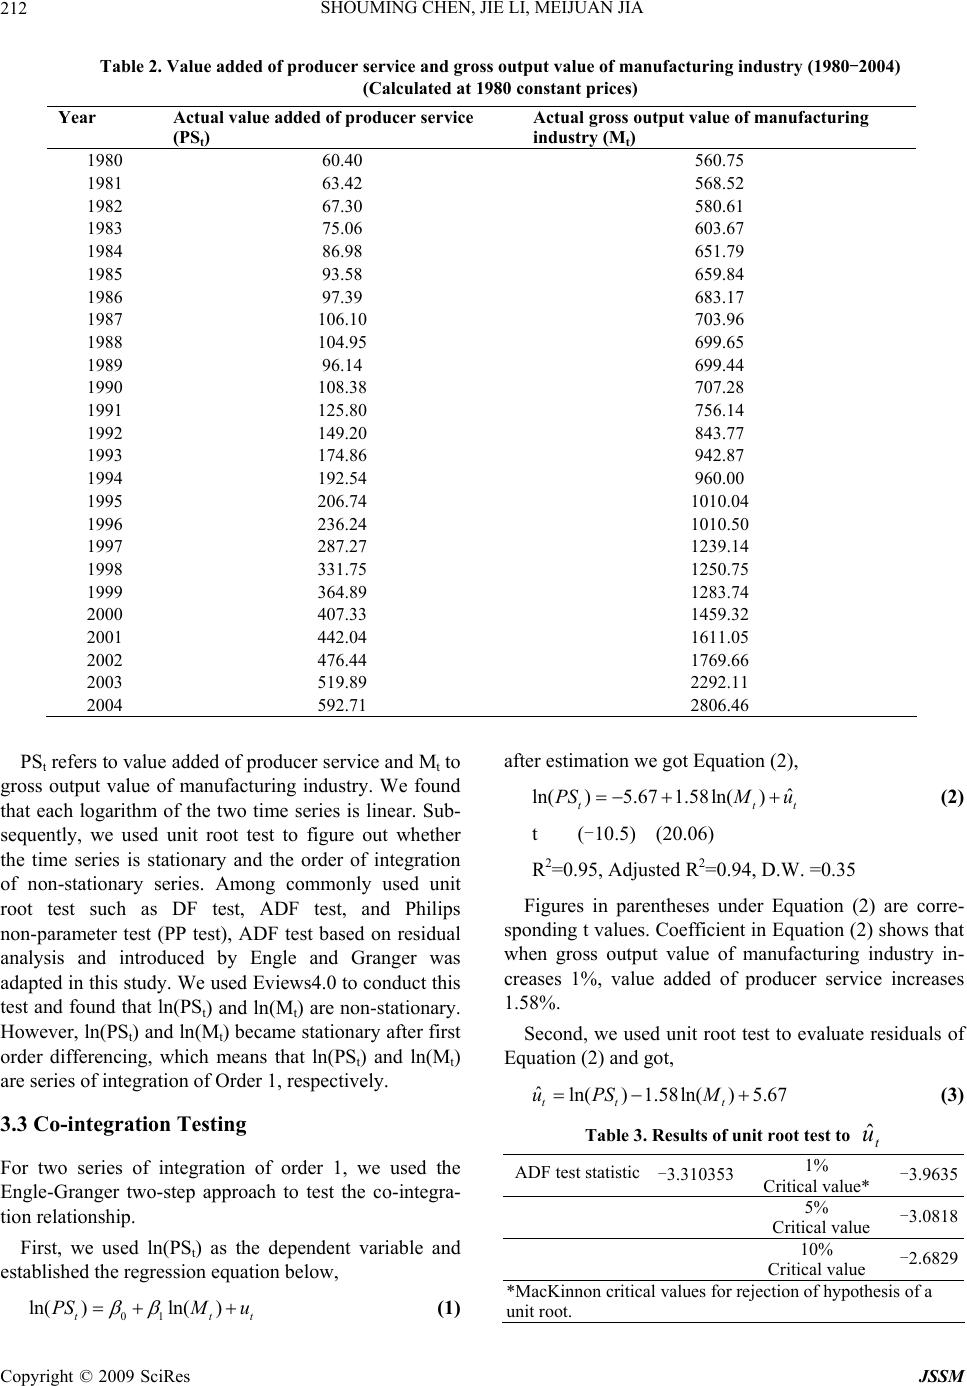 SHOUMING CHEN, JIE LI, MEIJUAN JIA 212 Table 2. Value added of producer service and gross output value of manufacturing industry (1980-2004) (Calculated at 1980 constant prices) Year Actual value added of producer service (PSt) Actual gross output value of manufacturing industry (Mt) 1980 60.40 560.75 1981 63.42 568.52 1982 67.30 580.61 1983 75.06 603.67 1984 86.98 651.79 1985 93.58 659.84 1986 97.39 683.17 1987 106.10 703.96 1988 104.95 699.65 1989 96.14 699.44 1990 108.38 707.28 1991 125.80 756.14 1992 149.20 843.77 1993 174.86 942.87 1994 192.54 960.00 1995 206.74 1010.04 1996 236.24 1010.50 1997 287.27 1239.14 1998 331.75 1250.75 1999 364.89 1283.74 2000 407.33 1459.32 2001 442.04 1611.05 2002 476.44 1769.66 2003 519.89 2292.11 2004 592.71 2806.46 PSt refers to value added of producer service and Mt to gross output value of manufacturing industry. We found that each logarithm of the two time series is linear. Sub- sequently, we used unit root test to figure out whether the time series is stationary and the order of integration of non-stationary series. Among commonly used unit root test such as DF test, ADF test, and Philips non-parameter test (PP test), ADF test based on residual analysis and introduced by Engle and Granger was adapted in this study. We used Eviews4.0 to conduct this test and found that ln(PSt) and ln(Mt) are non-stationary. However, ln(PSt) and ln(Mt) became stationary after first order differencing, which means that ln(PSt) and ln(Mt) are series of integration of Order 1, respectively. 3.3 Co-integration Testing For two series of integration of order 1, we used the Engle-Granger two-step approach to test the co-integra- tion relationship . First, we used ln(PSt) as the dependent variable and established the regression equation below, 01 ln()ln( ) t PSM u after estima ti on we got Equation (2), ˆ ln()5.67 1.58ln() t PSM u tt (2) t (-10.5) (20.06) R2=0.95, Adjusted R2=0.94, D.W. =0. 35 Figures in parentheses under Equation (2) are corre- sponding t values. Coefficient in Equation (2) shows that when gross output value of manufacturing industry in- creases 1%, value added of producer service increases 1.58%. Second, we used unit root test to evaluate residuals of Equation (2) an d got, ˆln()1.58ln()5.67 tt t uPS M (3) Table 3. Results of unit root test to t u ˆ ADF test statistic -3.310353 1% Critical value* -3.9635 5% Critical value -3.0818 10% Critical value -2.6829 *MacKinnon critical values for rejection of hypothesis of a unit root. tt (1) Copyright © 2009 SciRes JSSM  SHOUMING CHEN, JIE LI, MEIJUAN JIA 213 We also used unit root test to test. According to AIC and SC principle, the best lag order is 9. Test results are showed in Table 3. Test results in Table 3 suggest that rejects H0 at the 5% significance, showing that no unit root exists. Thus, t u ˆ t u ˆ is a stationary series, which means )0( ~ ˆ I u t . Co-integration exists between ln(PSt) and ln(Mt), and Co-integrated vector is (1, -1.58). 3.4 Result and Analysis The empirical result shows a long-term relationship be- tween producer service and local manufacturing industry in Shanghai. Namely, it is possible that Shanghai’s pro- ducer service interrelates with the development of local manufacturing industry. Such empirical result is incon- sistent with Shanghai’s future industry direction that Shanghai as an important metropolis in China should focus on the development of modern producer service, not on the development of manufacturing industry. The potential premise behind producer service oriented strat- egy of Shanghai relies on th e footloose trait of advanced producer service. In the other word, the advanced pro- ducer service is not limit to the condition of factor of production and to the adjacency o f market an d raw mate- rial. However, the empirical result from Wernerheim and Sharpe who study the footlooseness of producer service in metropolitan Canada does not support the premise [15]. They found that the advanced producer service, such as Information, Communication and Technology (ICT) sector, is no t as footloos e as expected [15]. Further, the result of this paper is consistent with the result from Wernerheim and Sharpe and shows that the producer service is insignificantly footloose and that the producer service has a long-term relationship with local manufac- turing industry. Local manufacturing industry in Shang- hai promotes the development of producer service in Shanghai. 4. Conclusions Based on data collected from Shanghai, this empirical study with time series analysis shows that co-integration do exist between producer service and local manufactur- ing industry, partially supporting the hypothesis that producer service interrelates with manufacturing industr y. The conclusion is also meaningful for other cities or provinces in china to formulate the strategy of producer service development. Meanwhile, we recognize the limi- tations in the application of our conclusion. First of all, the conclusion of this study based on data collected from Shanghai only represent the situation in a specific past period not the future situation. For example, the rela- tionship between producer service and manufacturing industry may vary after the elimination of regional col- laboration barrier. Second, we did not consider a rela- tionship between the producer service in shanghai and the manufacturing industry in Yangtze delta. If the rela- tionship is positiv e, the development of producer service in shanghai could also be explained by the growing scale of manufacturing industry in Yangtze delta. This is our future research issue. The domain that producer service in Shanghai ser- viced may cover a much larger area, from Yangtze delta to the whole country, even the whole world. However, we could not have a blind faith in the footloose trait of advanced producer service. In the regional development, the strategy that coordinates both developments of local producer service and local manufacturing industry should be persi st e d c onst antly. REFERENCES [1] H. L. Greenfield, “Manpower and the growth of producer services,” Columbia University Press, New York, 1966. [2] J. W. Harrington and J. R. Lombard, “Producer-service firms in a declining manufacturing region,” Environment and Planning A, No. 21, pp. 65-79, 1989. [3] W. Stull and J. Madden, “Post-industrial Philadelphia: Structural changes in the metropolitan economy Phila- delphia,” University of Pennsylvania, 1990. [4] H. C. Browning and J. Singelmann, “The emergence of a service society,” National Technical Information Services, Springfield, 1975. [5] J. Howells and A. Green, “Location, technology and in- dustrial organization in UK services,” Progress in Plan- ning, Vol. 26, No. 2, pp. 83-184, 1986. [6] P. W. Daniels, “Service industries in the world econ- omy,” Blackwell Publishers, 1993. [7] J. Tschetter, “Producer services industries: Why are they growing so rapidly?” Monthly Labor Review, Vol. 110, No. 12, pp. 31-40, 1987. [8] C W. J. offey and A. S. Bailly, “Producer services and flexible production: An exploratory analysis,” Growth and Change, Vol. 22, No. 4, pp. 95-117, 1991. [9] P. W. Daniels, “The geography of services,” Progress in Human Geography 9, pp. 443-451, 1985. [10] W. R. Goe, “Producer services, trade and the social divi- sion of labor [J],” Regional Studies, No. 24, pp. 327-342, 1990. [11] W. J. Coffey and J. J. McRae, “Services industries in Copyright © 2009 SciRes JSSM  SHOUMING CHEN, JIE LI, MEIJUAN JIA Copyright © 2009 SciRes JSSM 214 regional development,” Institute for Research on Public Policy, Montreal, 1990. [12] C. Q. Guo, “Evolution of manufacturing model and ten- dency of manufacturing development, doctorate forum of Anhui manufacturing development,” Hefei University of Technology Publishing House (in Chinese), 2004. [13] H. G. Grubel and M. A. Walker, “The Canadian service industries [M],” The Fraser Institute, Vancouver, 1989. [14] Z. G. Tao and Y. C. R. Wong, “Hong Kong: From an industrialized city to a centre of manufacturing-related service [J],” Urban Studies, Vol. 39, No. 12, pp. 2345– 2358, 2002. [15] C. M. Wernerheim and C. A. Sharpe, “‘High order’ pro- ducer services in metropolitan Canada: How footloose arethey?” Regional Studies, No. 37, pp. 469–490, 2003. |