 Circuits and Systems, 2016, 7, 680-691 Published Onlin e May 2016 in Sci Res. http://www.sc irp.org/journal/cs http://dx.doi.org/10.4236/cs.2016.76057 How to cite this paper: Saravanan, R. and Manoharan, S. (2016) Intelligent Controller for UPQC Using Combined Neural Network. Circuits and Systems, 7, 680-691. http://dx.doi.org/10.4236/cs.2016.76057 Intelligent Controller for UPQC Using Combined Neural Network Ragavan Saravanan1*, Subramanian Manoharan2 1Christian College of Engineering and Technology Oddachatram, Tamilnadu, India 2Thiagarajar Coll ege of Engineering Madurai, Tami l Nadu, India Received 1 March 2016; accepted 7 May 2016; published 11 May 2016 Copyright © 2016 by authors and Scientific Res earch Publishing Inc. This wor k is lic ensed under the Creati ve Commons Attribution International License (CC BY). http://creativecommons.org/licenses/by/4.0/ Abstract The Unified Power Quality Conditioner (UPQC) plays an impor ta nt role in the c onstra ined deliv ery of electrical powe r from the source to an isol ated p ool of load or from a sourc e to the grid. Th e proposed sys tem can com pensa te vo lt age sag/swell, re acti ve p owe r c ompens ation and h armo nics in the linear and nonline ar loads. In this work, the off line drai ned dat a fr om conventional fuzzy logic co ntr ol ler. A novel c ont rol sy stem with a Combined Neural Network (CNN) is used i nst ead of the traditionally four fuzzy logic contr oll ers . The perf orm an ce of combined neu ral ne two rk con- troller comp ared wi th Proportional Integral (PI) co n trol ler a nd Fuzzy Logic Controller (FLC). The system per formanc e is also ve rified ex perim entally. Keywords Unified Po wer Quality Condition er (UPQC ), C ombine d Neu r al Network (CNN) Controller, Fuzzy Logic Con trol ler (FLC ), Total H ar mon ic Dis tort ion (THD) 1. Introduction The UPQC is one of the most researched entities in the world of power electronic control of power systems. Though volumes of papers stream into the literature domain every day, it is very hard to fin d the real UPQC in service, eve n in t he global electricity distribution scenario. This scenario can be attributed to the fact that the UPQC is hard to underst and and it is still harder to handle the piece of equipment from the control system point of view. Many researchers have contributed to the development of the controllers associated wi t h the UPQC. Be fore proposing this idea, a su mmary of the existing ideas, as found in the literature, is hinted in this introduc- tion. Ahmet Teke et al. proposed a novel reference signal ge nerat ion method for the UPQC using the fuzzy logi c * 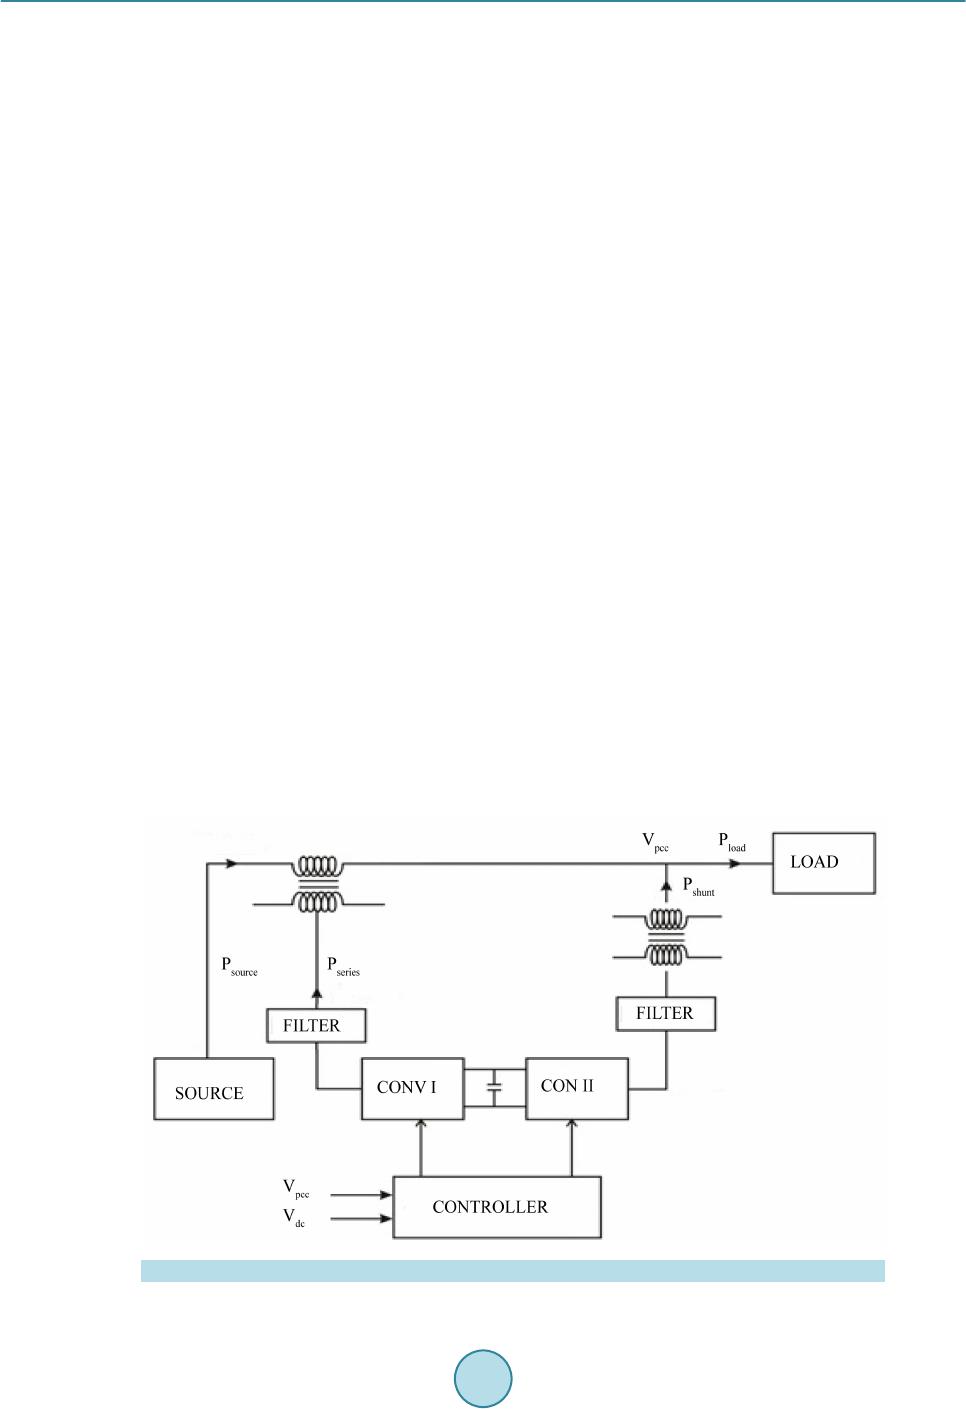 R. Saravanan, S. Manoharan scheme [1]. Ansari et al. proposed a novel algorithm for power angle contr ol (PAC) to improve power quality (PQ) in distribution sys t em [2]. Engin Ozdemir et al. presented a new Synchro nous-Reference Frame (SRF) based control method to compensate Powe r-Quality (PQ) problems thro ugh a three-phase four-wi r e unified PQ conditioner [3]. Raphael J. Millnitz dos Santos et al. discussed dua l three-p hase topology of UPQC [4]. Sr i nivas Bhaskar Karanki et al. discussed particle swarm o ptimization based feedback controller for unified p ower q ual- ity conditioner [5]. Srinivas Bhaskar Karanki et al. proposed reduced dc link voltage rating for modified three-pha s e four-wir e UPQC [6]. Yong Lu et al. demonstrate the space vector modulated transformer less uni- fied power qualit y conditioner [7]. Q. Xu discussed a single-pha s e unified power quality conditioner based on the modular multilevel matrix converter [8]. S. K. Khade m et al. demonstrated the integration, and control of unifie d p ower quality conditioner in d istributed generation based grid connected [9]. In this paper an attempt is made to present a step-by-step development of a simple comprehensi ve control scheme, at t he sa me time, an effective control scheme for the manageme nt of t he UPQC with a (CNN) controller, instead of the traditional four controller model. The objectives of this paper are as follows: 1) To maintain a steady voltage profile at the load end by inject i ng a series voltage in the appropriate phase and ma gnitude at volt age sag and swell conditions. 2) To eliminate the ha rmonic content in distribution system during unbalanced and nonlinear load c ondition. 3) To develop control techniques for ove rcoming the problems related to dc link voltage deviations during trans i ent conditions. 4) To compensate harmonics cur rents, unb a lanced nonli near load cur rents. 2. Modeling of UPQC The UPQC basically has t wo p owe r electronic converters linke d by a common DC link. These t wo converters enga ged in t he operation of the constrained p o we r tran saction process make use of four controllers tha t help in meeting out the constra i nts of power transaction. Shu nt converter is a three -leg three-phase Graetz bridge con- verter wit h a DC side and a three phase AC side. The three phase AC side is connected across the three phase AC bus bar at the point of commo n coupling through a voltage transformer and a series reactor as sh own in Figure 1. A pul s e width modulation (PWM) generator generating synchr onised switching pulses, switch the six switches of the t hree leg shunt converter. The objec t ives of the shunt convert or can be achieved by appropriately supplying the swit ching pulses. The generation of the switching pul s es is governe d by the three p hase reference signa l tha t is produced by the contribution of two controllers. The control objectives of the two controller s in- fluence the generation of the reference signal and this leads to the operation of the convertor meeting out its re- quir ement s . There are two controllers associated with the shunt converter. Figure 1. Structure of unified power quality conditioner. 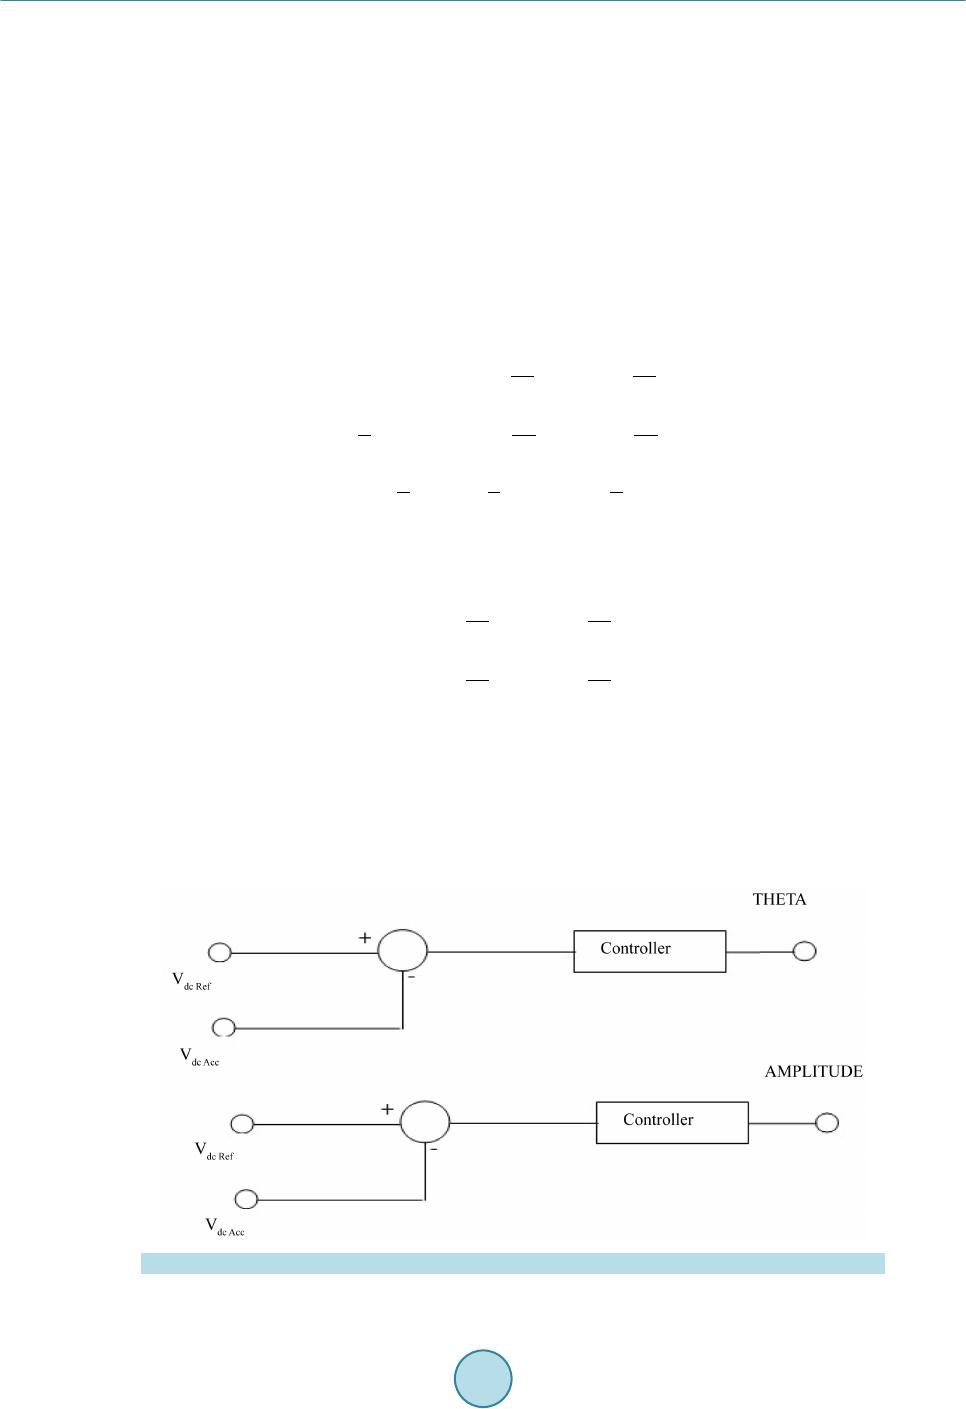 R. Saravanan, S. Manoharan A block diagram showing the position of the two controllers along with their input and output sig nals is shown in Figur e 2. The first controller is used to make the error between the actual DC link voltage (VDCRef) and the desired DC link voltage (VDCAct) as zero. The second controller is used to make the error between the actual point of common coupli ng voltage (VpqccRef) and the desired point of commo n coupl ing voltage (VpqccAct) as zero. These t wo are the co ntrolled parameters and the associated manipulated parameters are Theta and amplitude of Modulation I ndex (MI ). DQ Transfo rmati on The source side thr ee phas e volta ges Va, Vb, and Vc are sinusoidal in nature. These quantities are to be converted into equivalent DC quantities and then used in the controllers. The conver sio n of the three phase sinusoidal vol- tages denoted as Vabc into, Vd, Vq, Vo and in the rotating frame, is known as DQ transformation or Park transfor- mation. The vector (Va, Vb, Vc) can be transformed into another vector (Vd, Vq, Vo) wi th the help of a transforma- tion matrix. 0 2π2π sin sinsin 33 22π2π cos coscos 3 33 11 1 22 2 da qb c VV VV VV θθ θ θθ θ −+ = −+ (1) sincos 1 2π2π sincos 1 33 2π2π sincos 1 33 ad bq co VV VV VV θθ θθ θθ =−− ++ (2) The elements of the vector (Va, Vb, Vc) and the elements of the transformation matrix are time varying b ut the elements of the o utp ut vect or (Vd, Vq, Vo) are not time varyin g. However any change i n the amplitude of either Va or Vb or Vc is reflected in the elements o f the vector (Vd, Vq, Vo). Park transformation is the conversion of the three phase system of voltages, which are 120o displaced and va- rying in a sinusoidal fashion, into another system of three elements which are just constants. However, in the Figure 2. General control scheme. 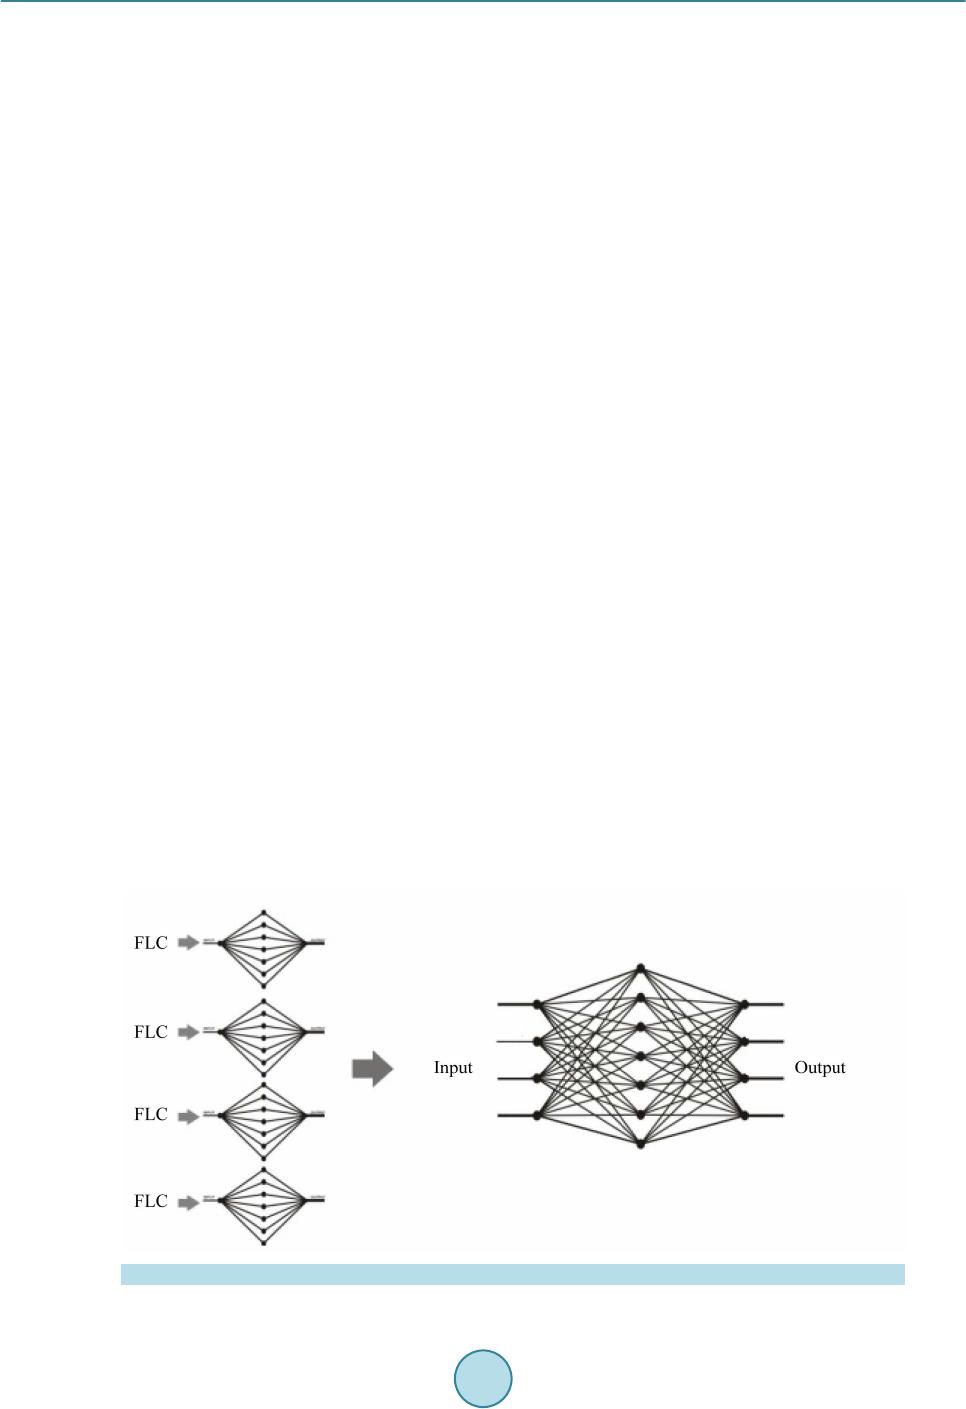 R. Saravanan, S. Manoharan transformed system the element Vo is zero if the three pha se system is balanced. The elements Vd and Vq are or- thogonal in nature tha t they do not have any influence on each other. In a typical control system both Vd and Vq can be changed individually witho ut affecting the o t her. 3. Combined Neural Networks In this work four FLC are designed, two FLCs, each respectively for the series converter and shunt converter. These four FLCs are tuned appropriately for the expected performance. Then these four controllers are replaced by four individual ANN based controllers. T hen, the four controllers with t wo inputs and one output are replaced by a single ANN unit with ei ght inputs and four o utputs. H oweve r, if a singl e ANN is replaced by four ANNs, whi ch results in increasing the speed of operation and better dynamic performance of the system under consid- eration. The input and output data required to tra in the ANNs are the error, error rate and the corresponding output of the FLC, when the FLC controlle d model is running environment. The same procedure is simultaneously adopted for collecting the i nput/output data per taining to other FLCs. Using the neural n etwork , F our ANNs are formed and each one was trained wi th the i nput/output data corresponding to each of the fo u r F LCs. The UPQC model is then rearranged with the ANNs in the place of the FLCs. The performance of the overall UPQC syst em, being controlled by the four ANNs, is observed under different loading conditions which could potentially cause disturba nces to the power quality. After it is observed tha t the four ANNs based control scheme wo rke d satisfactorily, the y are replaced by a single AN N . Afte r re movi ng the four AN Ns, the UPQC model is no w rearranged with the CNN. The inputs and output s associated with the fo u r ANNs are now routed throug h the CNN. T he performance of the overall UPQC system, being controlled by the CNN is observed under differen t loading conditions which coul d potentiall y cause dis- turbances to the p ower quality. The synapt i c weig hts are randomly initialised at the first time formation of an ANN but during the training phase, the synaptic we i ghts under go cha nges according to t he learning rule. Finally, as the training is over, each synaptic weight reaches its final value. During the test phase or duri ng the period, the ANN is put under service to mimic a function. Even as the inputs are applied, the synaptic we i gh t s do not change; they just wo r k together with the neurons to give the outp ut . A CNN is feed forwards back propagation type and its basic for m has an input layer, a hidden layer and an output laye r. There may be more number of hidden layers than one. Let us consider the case of CNNs having only one hidden layer. The style adopted in the CNN model as sho wn in Figure 3. Actually, as a resul t of combination of the ANNs, the resultant ANN has now more number of inputs and outputs. H oweve r , the number of neurons in the hidden layer remains the same. Thus, all the neural networks combined to form the ANN, have to share the common hidden layer neuro ns. As an example of demonstrate as how the ANNs are combined in this work, the following example may be considered. Going by an example, consider the following t wo no nl inea r equa t ions in “ti me”. Figure 3 . CNN model.  R. Saravanan, S. Manoharan (3) (4) Consider t wo i ndep endent AN N s which are trained respecti vely with the input/ output data set, for the r ange of time, between 0 and 1, in steps of 0.01, as dictated by each of the two E qua t i ons (3) a nd (4). U pon creating and trai ning two ANNs in the MATLAB/SIMULINK environment, two test models are constructed to test the per- formance of the two ANNs. A third AN N is then created with t wo inputs and two outputs. This is the co mbined model. The output vectors of model 1 and 2 are now used as the output for the thir d model. The third ANN was then trained. The performance of the combined model is as good as the performance of the individual ANN. For the cont ext of the paper, it is enough to observe that the combined ANN performs as good as the indivi dua l ANN. 4. Simulation Res ults In this article, to demonstrate the proposed control strategy of CNN model described in Figure 4. The p erfor- mance of the novel CNN based controller for the UPQC can be appreciated by comparing the results of the mul- tiple controllers. Under unbalanced condition Figure 5(a) shows the sour ce voltage distotded in sag and swel l condition. The compensation of voltage sag and swell condition using PI controller, Fuz zy logic controller, AN N controller and CNN controller depicted in Figure 5(b). From Figure 5(b) after compensation of voltage swe l l condition the perunit values PI, FLC and ANN controlle rs are 1.083, 1.038, 1.102 respectively. But in CNN controller after compensation of voltage swell condition the perunit value is 0.983 (nearest to unity), similarly after compensation of voltage sag condition the per unit value of CNN contro ller nearest to unity (0.994). The load voltage is maintained at the constant value, irrespective of the voltage sag and swell in the source voltage magnitud e. In this case, the voltage sag and swe l l can be analyzed by creating unbal anced load on the netwo rk system. The time duration of the voltage sag is 0.5 sec - 0.1 sec and voltage swel l from its duration between 0.15 - 0.2 sec. The supply voltages are unbalanced sinusoidals with t he magnit udes below the 1 per unit. The series compensator injecting the volt age,t he load side maintains balanced sinusoidal volta ge. The load voltage maintain the nominal value of 1 per unit. The UPQC can compensate voltage of sag and swe l l conditions under PI controller, Fuzzy logic contro ller, ANN controller and CNN contr oller depicted in Figure 5(b). Performance analysis of PI, FLC and CNN controller are shown in Table 1. Fr o m the re sult s, CNN co ntroller Figure 4. Simulink model of proposed CNN system. 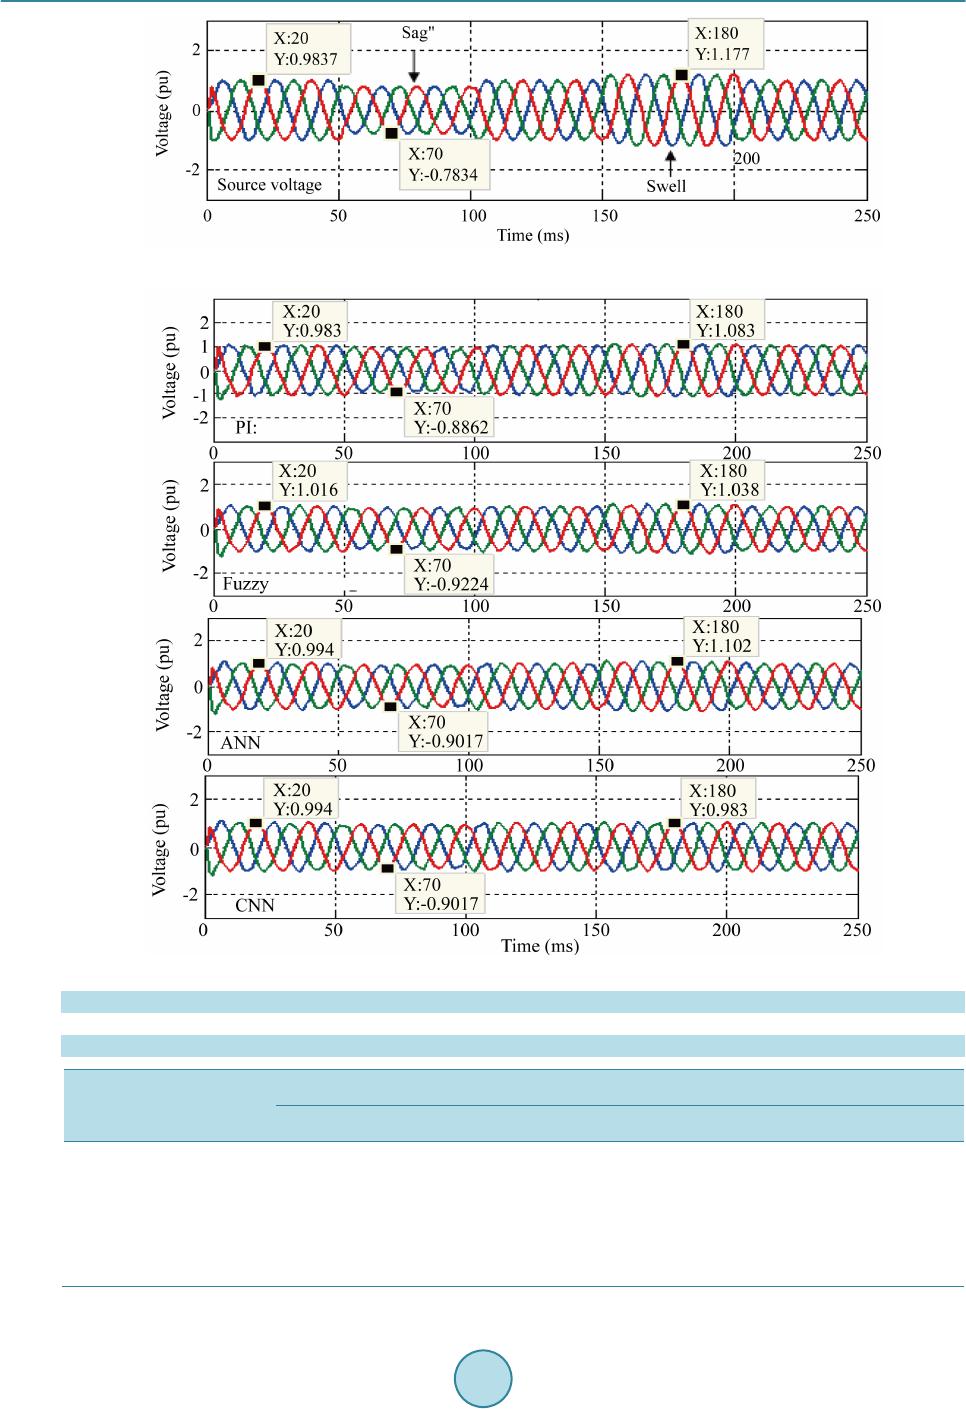 R. Saravanan, S. Manoharan (a) (b) Figure 5 . (a) Sour ce voltage; (b) Compensation of voltage sag and swell. Table 1. Performance analysis of PI, FLC and C NN controller. Quantity/R phase PI controller F LC CNN Contr oller THD% Magnitud e THD% Magni tude THD% Magnitud e Source volta ge 3.82 0.983 3.12 0.983 2.66 0.983 Load voltage 2.52 0.983 2.23 1.01 1.90 0.994 Source current 3.81 0.965 2.86 0.949 2.46 0.956 Load cu rrent 2.53 0.968 1.92 0.965 1.21 0.943  R. Saravanan, S. Manoharan THDs are maintained within permissible limits. T he sourc e volta ge under d istorted condition from 0.5 sec - 0.1 sec undergoes sag condition. T he source voltage with sag/swell before compensation has THDs of 2.66% in R phase. The load volta ge wit h sag/s well after compensation has THDs 1.90% in R phase respectively. An unba- lanced created in load condition, the shunt compensator forces the load current to be sinusoida l in nature. The source current before compensation have THDs of 2.46%. The source curr ent after compensation have THDs of 1.21%. Hence in different controllers operation, from Table 1, it is clear that CNN controller gives better per- formance in terms of reduced THDs in voltage and current after compensation. The THD within the limit speci- fied in the IEEE 519-1922. From Figure 6(a) and Figure 6(b), sh ows the load voltage is maintained constant irrespective of voltage sag and swell condition. The Figure 6(a) shows the so urce side act i ve power a nd reactive p o wer during sag and swe ll condition with a load. The Figure 6(b) shows the load side compensated output re- sults of active p ower a nd reactive p ower at the simulation time of 0.15 to 0.20 sec. It is observed from the Table 2, that the THD of the source curr ent is 2.68% for single ANN controller while it is 2.46% for CNN. Similarly, the THD for load current is 1.69% for single ANN controller while it is 1.21% for CNN controller. The THDs of source volta ge, load voltage, sourc e curr ent and load cur rent with CNN con- troller is s hown in Figure 7. The Total harmo ni c distortion (THD) of the source vo lta ge wit h CNN co ntroller is 2.66% and load voltage is 1.90%. The Total harmoni c distortion (THD) of the source voltage wit h ANN controller is 2.96% and load vo l t age is 2.16%. The Total harmonic distortion (THD) of the sour ce current wi th CNN con- troller is 2.46% and load current is 1.21%. The Total harmonic distortion (THD) of the sour ce current before compensation with AN N controller is 2.68% after compensation the load current is reduc ed 1.69%.it is observed from the simulation resul ts, the performance of CNN contr oller gives harmonics eliminatio n better tha n AN N controller and conventional controllers. The proposed CNN shows encouraging improvement in THD compared to the announced wo rk performed with Vadirajacharya G. Kinha l et al. [10]. (a) (b) Figure 6. Real and reactive power on source and load side. (a) Source side (Ps: Source side active power, Qs: Sou r ce s ide reacti ve power); (b) Load si de (PL: Load side active power, Q L: Load side reactive power).  R. Saravanan, S. Manoharan Figure 7 . THD level of “R” phase for CNN controller. Table 2. Performance analysis of ANN and CNN controller. Quant ity/R ph as e ANN Controller CNN Controller THD% Magnitud e THD% Magni tude Source volta ge/ sag 2.96 0.983 2.66 0.994 Load volta ge 2.16 0.994 1.90 0.994 Source voltage/swell 2.96 1.177 2.66 1.17 Load voltage 2.16 0.994 1.90 0.983 Source cu rrent 2.68 0.968 2.46 0.956 Load current 1.69 0.976 1.21 0.943  R. Saravanan, S. Manoharan 5. Experimental Results The performance of proposed concept is validated through exp erimental results. The hardware laboratory setup is shown in Figur e 8. The sour ce voltage, load volta ge, source current and load current for si ngle phase can be seen in hardware results. The str ucture of the CNN, realized in simulation, can be easily implemented in KEIL C and can be embedded in the microcontroller . The sigmoidal functions, used by the CNN can be implemented by the programming segment sho wn b e l ow. The segment of the program containing the sigmoidal function can be kept as a C function and can be called repeatedly by the CNN main program. The syna ptic weights of the MATL AB simulated CNN units are constants and in the keil implementation the synaptic weights are implemented as floating point constants. The trained CNN controller is simulated using microcontroller unit. To the sudden vari- ation in load creates the sag and s we l l conditions. Figure 9 s hows the e xperimental results during voltage sag condition. Figure 9(a) s hows the unba lanced source volta ge and corresponding THDs which are found to be 2.79%. Figure 9(b) sh ows the compensated load voltage and corresponding THDs whic h are found to be 1.98%. The load voltage maintains constant value. The experimental results during volt age swell co ndition ar e shown i n Figure 10 . The increased source voltage and corresponding THDs which are found to be 2.79% is sho wn in Figure 10(a). The compensated load voltage and corresponding THDs which are found to be 1.98% is shown in Figure 10(b). The series converter is used to injecting voltage, which are c ompensated load voltage. An unbalanced load condition, the source currents (sag) is distorted and unbalanced condition is shown in Figure 11(a) and corresponding THDs which are found to be 2.52%. The experimental results of current com- pensation are shown in Figure 11(b) and measured THD value of load current is 1.29%. Figure 8 . Hardware setu p. (a) (b ) Figure 9 . Voltage sag and har monics.  R. Saravanan, S. Manoharan An unbalanced load condition, the source currents (swell) is distorted and unbalanced condition is shown in Figure 12(a) and corresponding THD which are found to be 2.52%. The experimental results of current com- pensation are shown in Figure 12(b) and measured THD value of load current is 1.29%, where the scale of 1V is equal to 1A. It can be seen that source current is non-sinusoidal and the wave shape of the compensating load current is sinusoidal in nature, due to the action of shunt conv erter, the load currents balan ced and sinusoidal. Hence in CNN contr olle r gives t he har monic eli minatio n and vo ltage compensation. The Experimental results i n terms of T HD levels of voltage and current after compensation are shown in Table 3. The THD level of the load voltage and load current after compensation are 1.98% and 1.29% respectively. (a) (b ) Figure 10. Voltage swel l and harmonics. (a) Source voltage phase “R”; (b) Load volt age phase “R”. (a) (b ) Figure 11. Sag current and harmonics. (a) Source current phase “R”; (b) Load current phase “R”. Table 3. E xperimental resul ts. Quant ity/R ph as e THD% Source voltage 2.79 Load voltage 1.98 Source current 2.52 Load current 1.29  R. Saravanan, S. Manoharan (a) (b ) Figure 12. Swell current and har monic. (a) Swell source curr ent phase “R”; (b ) S well load current phase “R”. 6. Conclusion A new methodology is proposed to compensate voltage sag, voltage swe l l and reactive power compensation. The artificial intelligence based CNN controller has been developed. The proposed system can improve the p o wer quality at the distribution systems. The simulation model and hardware prototype model delineate in this paper. It can be implemented for highe r power rating circuits. The acceptable results for the proposed system summarized as follows. Moreover, proposed control scheme is in steady state and transient response. A detailed comparison is also verified bet ween conventiona l controllers. The proposed controller provides better perfor- mance wit h c onve nt i ona l controllers. The cur rent unbalance, curr ent harmoni cs, and load reactive p owe r of non- linear loads are compensated. The simulation result s are validated e xper i mentally. References [1] Teke, A., Saribulut, L. and Tumay, M. (2011) A Novel Reference Signal Generation Met hod for Power-Quality Im- provement of Unified Po wer-Quality Conditioner. IEEE Transactions on Power Delivery, 26, 2205-2214. http://dx.doi.org/10.1109/TPWRD.2011.2141154 [2] Ansa ri, A.Q., Singh, R. and Hasan, M. (2015) Algorithm for Power Ang le Control to Improve Po we r Quality Distribu- tion Syst em Using Un ified Power Quality Conditioner. IET Generation, Transmission an d Distribution, 9, 1439-1447. http://dx.doi.org/10.1049/iet-gtd.2014.0734 [3] Kesler, M. and O zdemir, E. (2011) Synchronous-Reference-Frame-Based Control Method for UPQC under Unbal- anced and Distorted Load Conditions. IEEE Transactions on Industrial Electronics, 58, 3967-3975. [4] dos Santos, R.J.M., da Cunha, J.C. and Mezaroba, M. (2014) A Simplified Control Technique for a Dual Unified Power Quality Conditioner. IEEE Transactions on Industrial Electronics, 61, 5851-5860. [5] Karanki, S.B. and Mishra, M.K. (2010) Particle Swarm Optimization-Based Feedback Controller for Unified Power- Quality Conditioner. IEEE Transactions on Power Delivery, 25, 2814-2824. http://dx.doi.org/10.1109/TPWRD.2010.2047873 [6] Karanki, S.B., Geddada, N., Mishr a, M.K. and Kumar , B.K. (2013) A Modified Three-Phas e Four-Wire UPQC To- pology with Reduced DC-Link Voltage Rating. I EE E Tr ansac ti o ns on Indus tr i a l Electro ni c s , 60, 3555-3566. [7] Lu, Y., Xiao, G.C., Wang, X.F., Blaabjerg, F. and Lu, D.P . (2016) Control Strategy for Single-Pha se Transformer Less Three-Leg Unified Po wer Quality Conditioner Based on Space Vector Modulation. IEEE Transactions on Power Elec- tronics, 31, 2840-2849. http://dx.doi.org/10.1109/TPEL.2015.2449781 [8] Xu, Q.M., Ma, F.J., Luo, A., He, Z.X. and Xiao, H.G. (2016) Analysis and Control of M3C based UPQC for P ower Quality Improvementin Medium/High Voltage Power Grid. IEEE Transac t ions on Powe r Ele c tr onic s, 26, 1. http://dx.doi.org/10.1109/TPEL.2016.2520586 [9] Khadem, S.K., Basu, M. and Conlon, M.F. (2015) Intelligent Islanding and Seamless Reconnection Technique for Mi- crogrid with UPQC . IEEE Journal of Emergi ng and Selected Topics in Power Electronics, 3, 483-492 . http://dx.doi.org/10.1109/JESTPE.2014.2326983  R. Saravanan, S. Manoharan [10] Kinhal, V.G., Agarwal, P. and Gupta, H.Q. (2011) Performance Investigation of Neural-Ne twor k-Based Unified Pow- er-Quality Conditioner. IEEE Transactions on Power Delivery, 26, 431-437. http://dx.doi.org/10.1109/TPWRD.2010.2050706
|