 Circuits and Systems, 2016, 7, 643-661 Published Online May 2016 in SciRes. http://www.scirp.org/journal/cs http://dx.doi.org/10.4236/cs.2016.76055 How to cite this paper: Sankar, A.B. and Seyezhai, R. (2016) Simulation and Implementation of Solar Powered Electric Ve- hicle. Circuits and Systems, 7, 643-661. http://dx.doi.org/10.4236/cs.2016.76055 Simulation and Implementation of Solar Powered Electric Vehicle A. Bharathi Sankar, R. Seyezhai Depart ment of EEE, SSN College of Engineering, Chennai, India Received 7 March 2016; accepted 6 May 2016; published 11 May 2016 Copyright © 2016 by authors and Scientific Research Publishing Inc. This work is licensed under the Creative Commons Attribution International License (CC BY). http://creativ ecommon s.org/l icenses/by /4.0/ Abstract The rise in the price of oil and pollution issues has increased the interest on the development of electric vehicles. This paper discusses about the application of solar energy to power up the ve- hicle. The basic principle of solar based electric vehicle is to use energy that is stored in a battery to drive the motor and it moves the vehicle in forward or reverse direction. The Photo Voltaic (PV) module may be connected either in parallel or series, and the charge controllers direct this solar power to the batteries. The DC voltage from the PV panel is then boosted up using a boost DC-DC converter, and then an inverter, where DC power is converted to AC power, ultimately runs the Brushless DC motor which is used as the drive motor for the vehicle application. This paper focus- es on the design, simulation and implementation of the various components, namely: solar panel, charge controller, battery, DC-DC boost converter, DC-AC power converter (inverter circuit) and BLDC motor for the vehicle application. All these components are modeled in MATLAB/SIMULINK and in re al -time, the hardware integration of the system is developed and tested to verify the si- mulation results. Keywords Photo Voltaic P anel , DC -DC Converter, Brushless DC Motor , Electric Vehicle 1. Introduction The renewable energy is vital for today’s world as the non-renewable sources that we are using are going to get exhausted. The solar vehicle is a step in saving these non-renewable sources of energy [ 1]-[3]. Solar powered electric vehicle is advantageous because of less noise, less pollution and reduces carbon dioxide emissions [4]-[6]. It consists of PV pa nel, charger c ontro ller, batter y, inverter a nd BLDC motor. T he basic p rinciple of t he proposed vehicle is the energy drawn from the solar panel that is used to c har ge a b att er y whic h i n tur n run s the motor of the vehicle. A boost converter is used as an interface between the solar panel and the battery to obtain  A. B. Sankar, R. Seyezhai the re quir ed vo lta ge and to extract maximum power from PV. The BLDC motor is preferred over DC motor be- cause of high efficiency, low maintenance, long life, low weight and compact construction. The conventional DC motor is relatively more expensive and needs maintenance due to the brushes and commutator, whereas, BLDC motor has a rotor and a stator, which is connected to a power electronic switching circuit [7]-[9]. This paper focuses on the modeling of solar cell, battery and implements a boost converter for the solar vehicle dri- ven by BLDC motor. The simulations are carried out in MATLAB software. T he hard ware prototype is built and the results are verified. 2. Modeling of Solar Cell A solar cell is the building block of a photovoltaic panel. A photovoltaic panel is developed by connecting many solar cells in series and parallel. A single photovoltaic cell can be modeled by utilizing current source, diode and two resistors as shown in Figure 1 [10] [11]. The equation for a photovo ltai c cell i s give n by exp 1 ss lg ossh V IRV IR II IqAkT R +∗ +∗ =− ∗∗−− ∗∗ (1) 311 exp * r os orgo r TT T I IqE T Ak − ∗ ∗∗∗ = (2) ( ) { } 25 lgscr i II KT λ =+∗− ∗ (3) exp 1 p ss sp s p lgp ossh N R VIV IR NN N INI NIqAkT R ++ = −−− ∗∗∗ ∗∗∗∗ ∗∗ (4) where I & V: Photovoltaic c e ll output current a nd vo ltage; Ios: PV cell reverses saturation current; T: Solar cell temperature in Celsiu s; k: Boltzmann’s constant, 1.38 × 10⁻¹⁹ J/K; q: Electron charge, 1.6 × 10⁻²³ C; Ki: Short circ uit curr ent tempera ture c oefficient at Iscr; λ : Solar cell irr a diation in W/m2; Iscr: Short circuit c urrent at 25 degree Celsius; Ilg: Light-generated current; Ego: Band gap for silicon; A: Ideality factor; Tr: Reference temperature; Figure 1 . A single solar cell circuit model.  A. B. Sankar, R. Seyezhai Ior: Cell saturation current at Tr; Rsh: Shunt resistance; Rs: Series resistance.; It can be seen that the photovoltaic cell operates as a constant current source at low values of operating vol- tages and a constant voltage source at low values of operating current. Electrical specifications of solar panel are: open circuit volta ge: 32.6 V, short circuit current: 8. 5A, total no of cells in series : 72 and sola r cell te mperature: 30 degree Celsius. SIMULINK model of the photovoltaic panel is shown in Figure 2. The P-V output characteristics with varying irradiation at constant temperature are shown in Figure 3. The I-V output characteristics of PV module with varying irradiation at constant temperature are shown in Figure 4. When the irradiation increases, the current output increases and the voltage output also i ncre ases. T his re sults in net increase in output power with increase in irradiation at constant temperature. The P-V output characteristics with varying temperature at constant irradiation are shown in Figure 5. The I-V output characteristics of P V module with varying te mperature a t constant irrad iation ar e shown in Figure 6. When the operating temperature increases, the current output increases marginally but the voltage output de- creases drastically results i n net reduction in power output with rise i n temperature. Figure 2 . SIMULINK model of the photovoltaic panel. Figure 3. P-V char acteristics of a typical PV mod ule for varying solar irradiance.  A. B. Sankar, R. Seyezhai Figure 4 . I-V characteri s tics of a typical PV module fo r varying solar irradiance. Figure 5 . P-V characteristics of a typical PV modu le for varying temperat ure. Figure 6. I-V characteristics of a typical PV mod ule for varying t emper ature.  A. B. Sankar, R. Seyezhai 3. DC-DC Boost Convert er A single photovoltaic cell produces voltage of about 0.6V. In order to boost up the voltage, a DC-DC boost converter is used. It is used to step up the input voltage to a required output voltage without the use of a trans- former. T he control strategy lies in the manipulation o f the duty cycle of the switch which re sults in obtai ning a variable DC output vol tage. The circ ui t diagram of the boost co nverter is shown in Figure 7 [12] . The active switch in the boost converter is a MOSFET. A fast recovery diode is used as the freewheeling di- ode. The input and output capacitor is selected as C1 = 470 μF and C2 = 330 μF, 450 V .The ind ucta nce va lue is 2 mH, 15 A. For a DC-DC boo s t converter, the conversi on gain fo r continuous conduction mode is give n by: (5) where Vo is the output voltage of the converter , Vin i s t he input voltage of the c onverter and D is t he dut y cycle of operation. Boost Inductor and Output Capacitor The boost inductor L is calculated based on parameters such as switching frequency fs, input and o utput voltages, Vin and Vout and the inductor current ripple ∆IL. ( ) ino in Lso V VV LI fV − =∆ ∗ ∗∗ (6) The output capacitor is calculated using the below formula (7) where ∆Vo is the output voltage ripple. The DC-DC boost converter output voltage is about 60 V and inp ut cur re nt i s ab o ut 8 A as shown in Figure 8 & Figure 9. 4. Battery Modeling The lead-acid battery are studied in an intensive way for automotive and the renewable energy sectors. In this paper, the principle of the lead-acid battery is presented. A simple, fast, and effective equivalent circuit model structure for lead-acid batteries is implemented [13]. The identificatio n of the parameters and the battery model is validated by performing the simulation in MATL AB/SIMULINK. The general equation for modeling the battery is Discharge: o QQ VEKitKiRiC Q itQ it =−−− ⋅+ −− (8) Char ge: Figure 7 . Circuit diagram of boost converter.  A. B. Sankar, R. Seyezhai Figure 8. Input current and output voltage of boost converter. Figure 9 . Output current of boost converter. 0.1 o QQ VEKitKiR iC Q ititQ =−−− ⋅+ −− (9) where V: Battery voltage (V ); Eo: Nominal voltage (V); K: Polarization resistance (Ω); Q: Battery capacity (A∙h); it: Actual battery charge (A∙h); A: Exponential zone a mpl itude (V); B: Exponential zone time constant inverse (A∙h−1); R: Battery internal resistance (Ω); C: Exponential voltage (V). From the manufacturer’s datasheet, the above parameters can be obtained. But, polarization resistance, expo- nential zone amplitude and exponential zone time constant inverse should be calculated from the discharge curve of the batter y which is calculated as follows is sho wn in Figure 10. (10) 00.0050.01 0.0150.02 0.0250.03 0.0350.04 0 5 10 Input current 00.0050.01 0.0150.02 0.0250.03 0.0350.04 0 50 100 Time in s ec Output voltage Input current Output vo ltage 0.030.0301 0.0301 0.0302 0.0302 0.0302 0.0303 0.0303 0.0304 0.0304 0.0305 7.98 7.99 8 8.01 8.02 Input current ri pple 0.030.0301 0.0301 0.0302 0.0302 0.0302 0.0303 0.0303 0.0304 0.0304 0.0305 59.8 59.9 60 60.1 60.2 Time in sec  A. B. Sankar, R. Seyezhai Figure 10. Discharging characteristi cs of battery. (11) The value of exponential voltage for chargi ng and disc hargi ng are Discharge: Char ge: 4.1. Current Block The chargi ng and discharging of the batter y is altered depending upon the state of char ge of the batter y. When the state of charge reaches a certain maximum level, it begins to discharge upto the minimum va lue is s hown i n Figure 11. The value of state of charge can be fixed depending upon the battery specifications and the manufacturer. 4.2. State of Charge Block The charge of the battery, Q is calculated as The above equation gives the result in Ampere-seconds. In order to get th e st andard value i n Ampere-hours, the result is divided by 3600 and compared with the nominal battery capacity to get the present state of charge is sho wn in Figure 12. 4.3. Polarization Voltage Block The polarization voltage block is calculated as is shown in Figure 13. 4.4. Polarization Resistor Block The polarization resistance is calculated according to charging and discharging modes is s hown in Figure 14. Char ge:  A. B. Sankar, R. Seyezhai Figure 11. SIMULINK model of current block. Figure 1 2. SIMULINK model of state of charge b lock. Figure 1 3. SIMULINK model of polarization voltage block. Figure 1 4. SIMULINK model of polarization res is t or block .  A. B. Sankar, R. Seyezhai Discharge: 4.5. Exponential Block The SIMULINK model exponential block is shown in Figure 15. By calculating the battery parameters using the mathematical blocks and using Equations (8) and ( 9), t he vol- tage of the battery is plotted. The modeling is done in such a way that the charging current and discharging current are alternated according to the state of charge of the battery. By this way, both the charging and discharging characteristics are obtained. This is sho wn in Figure 16. The discharging ch aracterist ic of th e lead acid battery is shown in Figure 17. The characteris tics were tak en by connecting a resistive load across the battery. It can be seen that as the resistance increases the time taken for discharging completely also in cr eases. T he SOC characteristics are shown in Figure 18. For different charging currents, the charging characteristics were observed as shown in Figure 19. It can be found that as t he charging current increas es, the time taken by the battery to attain full v oltage decreases. The SOC characteristics ar e shown in Figure 20. Figure 1 5. SIMULINK model of ex pone nt ia l bloc k. Figure 1 6. Simulation results of battery characteristics. 0 2 4 68 10 x 10 5 48 49 50 Time (s) Voltage (V) 0246810 x 10 5 0 0.5 1 Time (s) SOC 02 4 6810 x 10 5 -8 -6 -4 -2 0 2 4 Time (s) Current (A)  A. B. Sankar, R. Seyezhai Figure 1 7. Simulation results for battery voltage for various R load. Figure 1 8. Simulation results of SOC for various R load. Figure 1 9. Simulation results for battery voltage for various charging current. Figure 2 0. Simulation results of SOC for various charging current. 0 0.51 1.5 22.5 33.5 4 x 10⁴ 0 20 40 60 Time (s) Battery Voltage (V) 1.5ohm 2ohm 2.5ohm 3ohm Load 00.5 11.5 22.5 33.5 4 x 10 4 0 0.2 0.4 0.6 0.8 1 Time (s) SOC 1.5ohm 2ohm 2.5ohm 3ohm Load 00.5 11.5 22.5 33.5 4 x 10 5 47 47.5 48 48.5 Time (s) Battery Voltage (V) 2A 4A 6A 8A C ha rg i ng c ur r ent 0 0.5 1 1.52 2.5 3 3.5 4 x 10⁵ 0 0.5 1 Time (s) SOC 2A 4A 6A 8A C har ging c urr ent  A. B. Sankar, R. Seyezhai 5. Electric Vehicle Dynamic Performance Dynamic behavior analysis of electric motors is required in order to accurately evaluate the performance of electric vehicles. Simulation to ols for electric vehicles are divided into steady state and dynamic models. For the accurate prediction of electric vehicle performance, dynamic modeling of the motor and other components is necessary. The dynamic performance of the motor for electric vehicles is investigated [14]-[19]. For this purpose a BLDC motor with its electrical drive is modeled and simulated first, and then the other components of a series electric vehicle, such as battery charger, multilevel inverter are designed and linked with the electric motor. The first step in vehicle performance modeling is to obtain an equation for calculating the required vehicle propelling force. This force must overcome the road load and accelerate the vehicle. The tractive force, Ftot, available from the propulsio n system can be written a s: totrollADgrade acc Fffff=++ + (12) The rolling resistance, aerodynamic drag, and climbing resistance are known as the road load. The rolling re- sistance is due to the friction of the vehicle tires on the road and can be written as: (13) where M, fr and g are the vehicle mass, rolling resistance coefficient and gravity acceleration, respectively. The aerod ynamic drag is d ue to the frictio n of the vehicle body mo ving thr ough the air. T he formula for thi s component is: (14) where V, ξ, CD and A are the vehicle speed, air mass density, aerodynamic coefficient and the frontal area of the vehicle, respectively. The climbing resistance is due to the slope of the road and is expressed by: (15) where is the angle of the slo pe. If the velocity of the vehicle is changing, then clearly a force will be needed to be applied in addition to the above forces. This force will provide the linear acceleration of the vehicle, and is given by: (16) Wheels and axle convert Ftot and the vehicle speed to torque and angular speed requirement to the differential as follows: d d wheel wheeltotwheel wheelloss TFR IT t ω ∗=++∗ (17) (18) where Twheel, Rwheel, Iwheel, Tloss, ωwheel, and s are the tractive tor que, ra dius of the whe el, w heel inertia, wheel loss torque, angular velocity of the wheels and wheel slip wheels, respectively. Figure 21 shows that acce le r ation of ele c tric vehicle is calculated using mainl y the position of the accelera tor, which is between −100% and +100% and the measured electric vehicle speed. Note that a negative accelerator position represents a brake position. Figure 22 sho ws that t he starti n g motor to rq ue of ele ctric vehic le is ab out 3 Nm. Figure 23 shows that the maximum motor speed (2500 rpm) achieved in BLDC motor drive. Figure 24 shows the stator c ur rent for ele ctric ve hicle dr ive. It is ob served fro m the results that the stato r c ur- rent ripple is settled in runnin g co nd ition. Figure 25 shows that the maximum vehicle speed (40 Km/hr) achieved BLDC motor drive. The simulation results of motor acceleration, motor torque, stator current, motor speed, vehicle speed for electric vehicle is obtained. The electromagnetic torque of BLDC motor is varied from 0 to 4 second. T hen the rated torque is reached at 8 s. The rated torque can be seen 3 Nm as s hown i n the Figure 22. The stator current  A. B. Sankar, R. Seyezhai Figure 21. Acceleratio n of electric vehicle. Figure 22. Motor to r que of electric veh icle. Figure 23. Motor speed of electric veh icle. 0246810 12 14 16 -0.8 -0.6 -0.4 -0.2 0 0.2 0.4 0.6 0.8 1 Time in s e c Electrical vehicle Acceleration Accelerator 0246810 12 14 16 -1 -0. 5 0 0.5 1 1.5 2 2.5 3 Motor torque in N/m Time in sec 0246810 12 14 16 0 500 1000 1500 2000 2500 3000 Time in s ec Motor speed i n rpm  A. B. Sankar, R. Seyezhai Figure 24. Stator current of electric vehicl e. Figure 25.Vehicle speed of electric vehicle. resp onses of the B LDC mo tor are shown in Figure 24. The stator current is about 10 A and stator current fluc- tuates between 4 and 8 s. With respect to the above Figures 23-25, the rotor speed is gradually increased to the rated speed. The rated speed is 2500 rpm and it is reached at nearly 13 s and the vehicle speed is gradually in- creased to the rated speed. The vehicle speed is 40 km/hr and it is reached at nearly 12 seconds. The experimental P-V and V-I characteristics are shown in Fi gure 26. Table 1 shows that specifications of PV Panel & Boost Converter. The dynamic characteristics of PV array is measured using scope corder (advanced DSO) and it is shown in Figures 27-29 (VOC = 32.5 V and ISC = 8.5 A). The inp ut t o t he c o nver te r i s about 31.9 V and output voltage obtained is about 64.6 V as shown in Figure 30. The MOSFET switches at 50% duty cycle. Output voltage and input curr ent ripp le of DC-DC boost converter measured using PQ analyzer is about 0.9% and 1.3% as sho wn in Figure 31. The dynamic charging and discharging characteristics of battery are measured using scope corder and they are sho wn in Fig ure 32 & Figure 33. The solar powered electric vehicle using BLDC Drive is shown in Figure 34. The vehicle was designed with forward and backward driving system which was able to achieve a speed of 40 K mph. The differential rear axle 02 4 6810 12 1416 -2 -1 0 1 2 Time in s ec Motor stator current in amps 0 2 4 6810121416 0 5 10 15 20 25 30 35 40 45 Time in s e c Vehic le s pe e d in Km/Hr VEHICLE SPEED 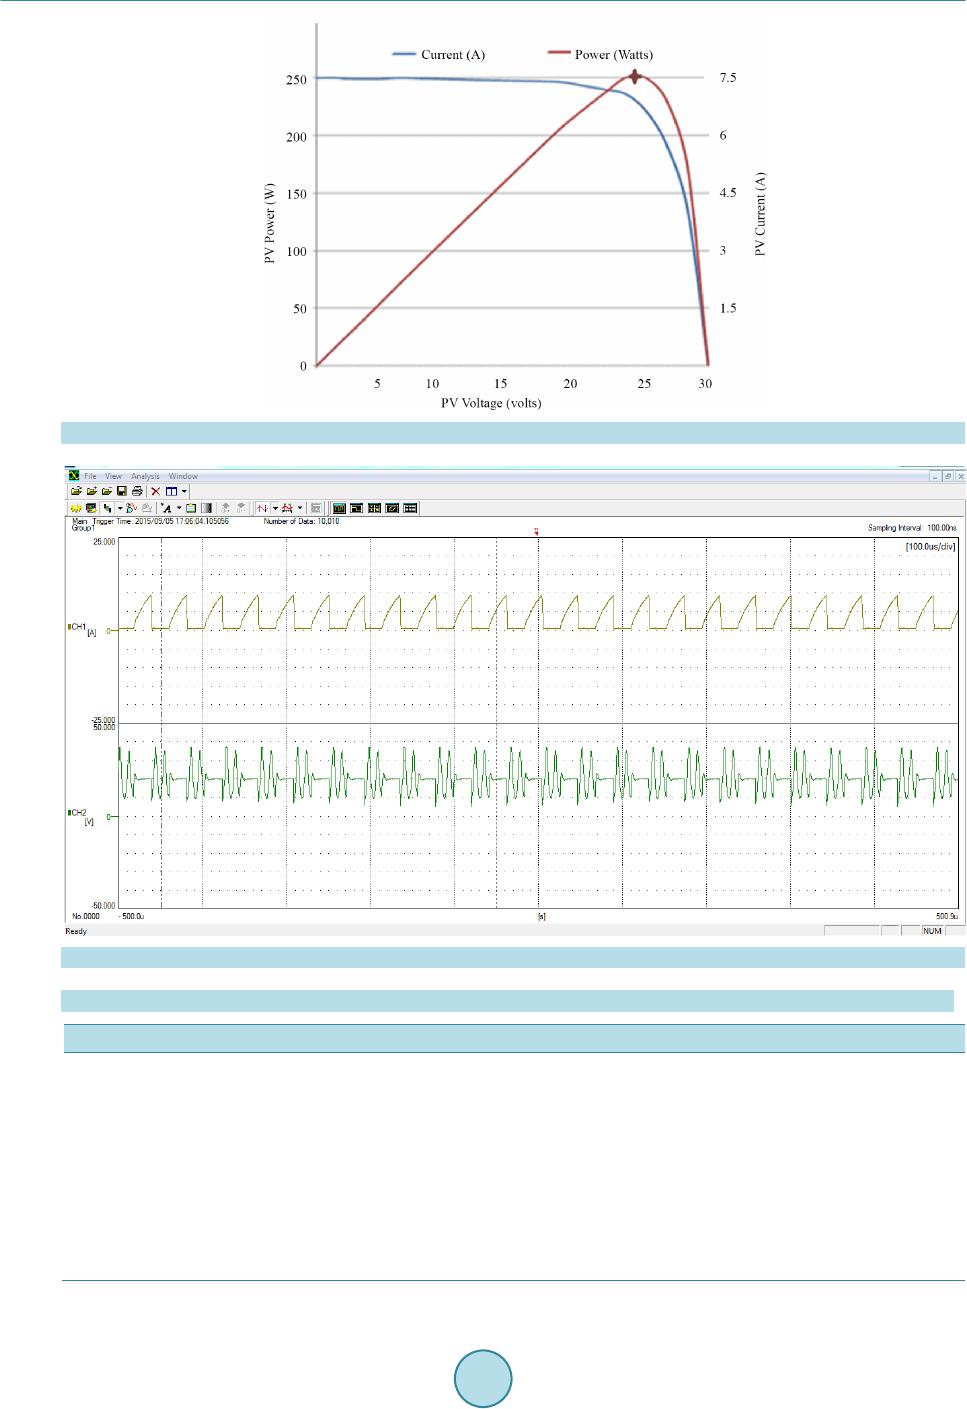 A. B. Sankar, R. Seyezhai Figure 2 6. Experimental P-V & V-I characteristics. Figure 2 7. Experimental results for PV voltage and current. Table 1. Speci ficat ions of PV panel & boost converter. Parameters Values Voc 31.16 V Isc 8.57 A Pmax 250 W Insolation W/m2 1000 W/m2 System Efficiency 7 6.72% Out pu t C a pacitance C1 = 330 μF Inductance L1 = 2 mH, 15 A. Switching Frequency fs = 50 KHz 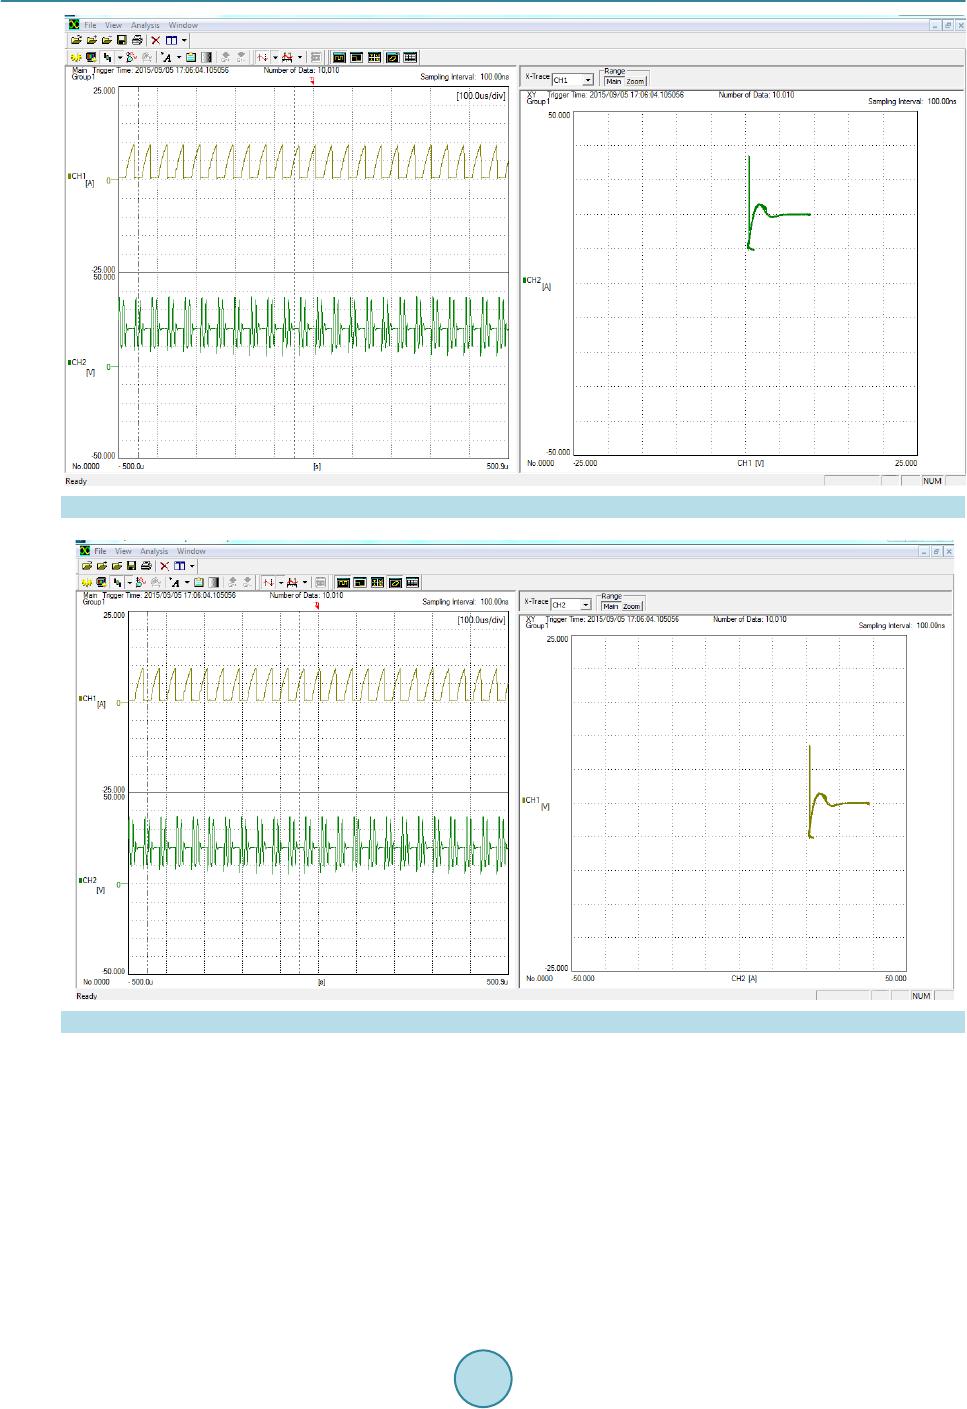 A. B. Sankar, R. Seyezhai Figure 2 8. Experimental results for voltage characteristics of PV. Figure 2 9. Experimental results for current characteristics of PV. of the vehi cle is c onnecte d to the drivin g shaft o f the B LDC moto r thro ugh the gear cou pling. W ith the c hange in mo to r , whic h ha s hi g h to rq ue , t he ve hi cle wo uld b e c ap a b l e o f b ee n dr i ve n with he av y lo ad . The cur r ent fr om the batteries flo ws to the controller, which controls the whole co ntrol system of the vehicle . With respect to the movement of the accelerator, the controller sends forth the current, thereby increasing or decreasing the speed of the vehicle. Tab l e 2 shows electric vehicle sp e c ification. Figure 35 shows experimental values of actual speed and stator current with respect to bat tery voltage. 6. Conclusion The importance of utilization of solar power in electric vehicle application is discussed in this paper. The pro- 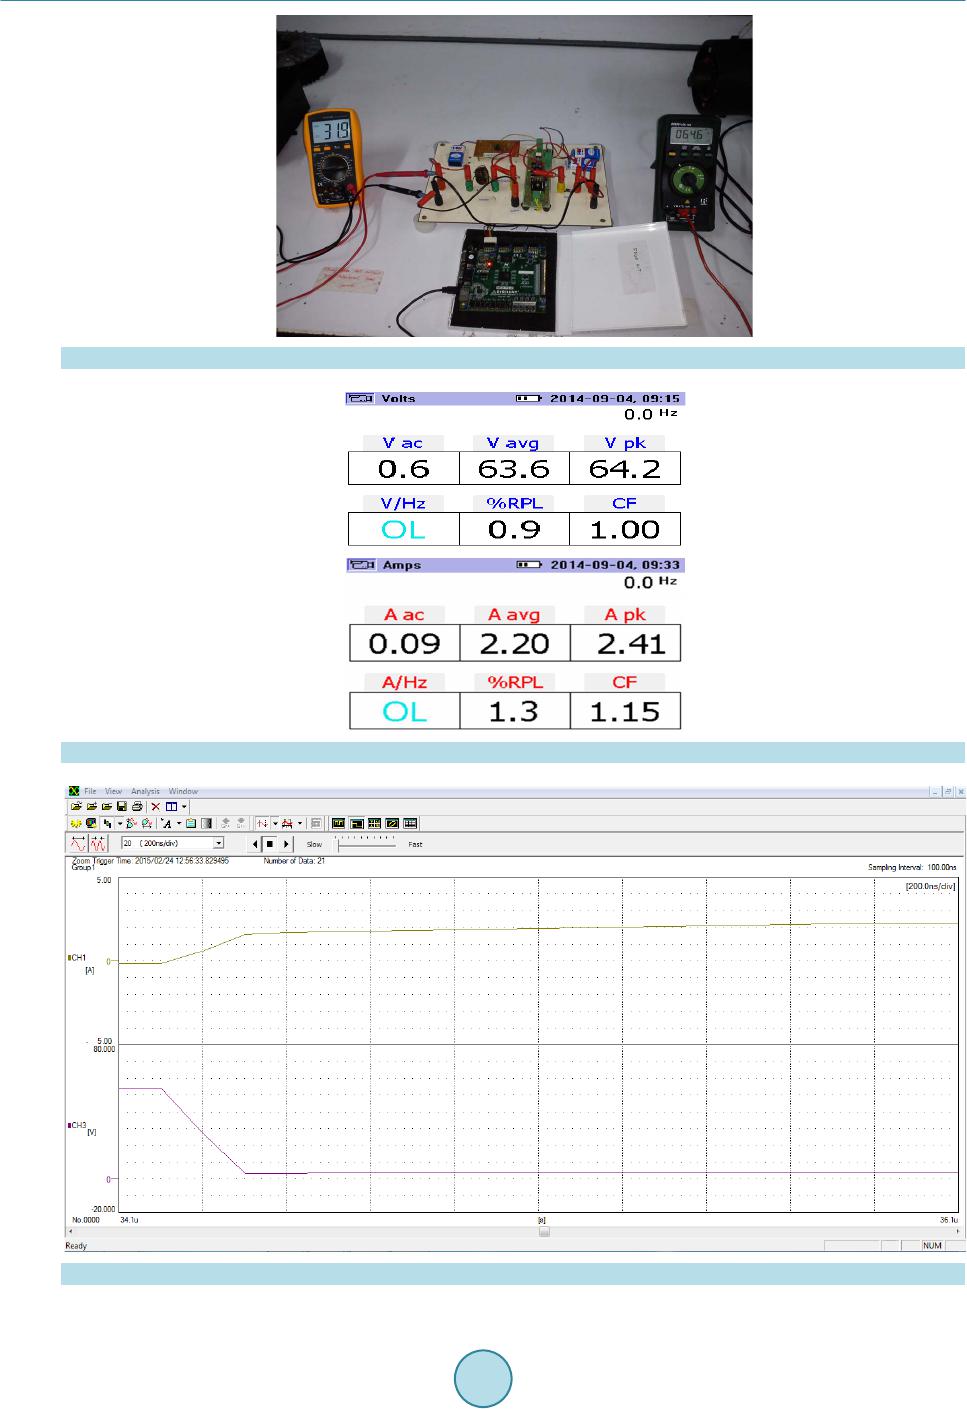 A. B. Sankar, R. Seyezhai Figure 3 0. Experimental s etup for PV interface boost converter. Figure 31. Output voltage and input current ripple of boost converter for 50% duty cycle. Figure 3 2. Experimental results for charging char acteristics. 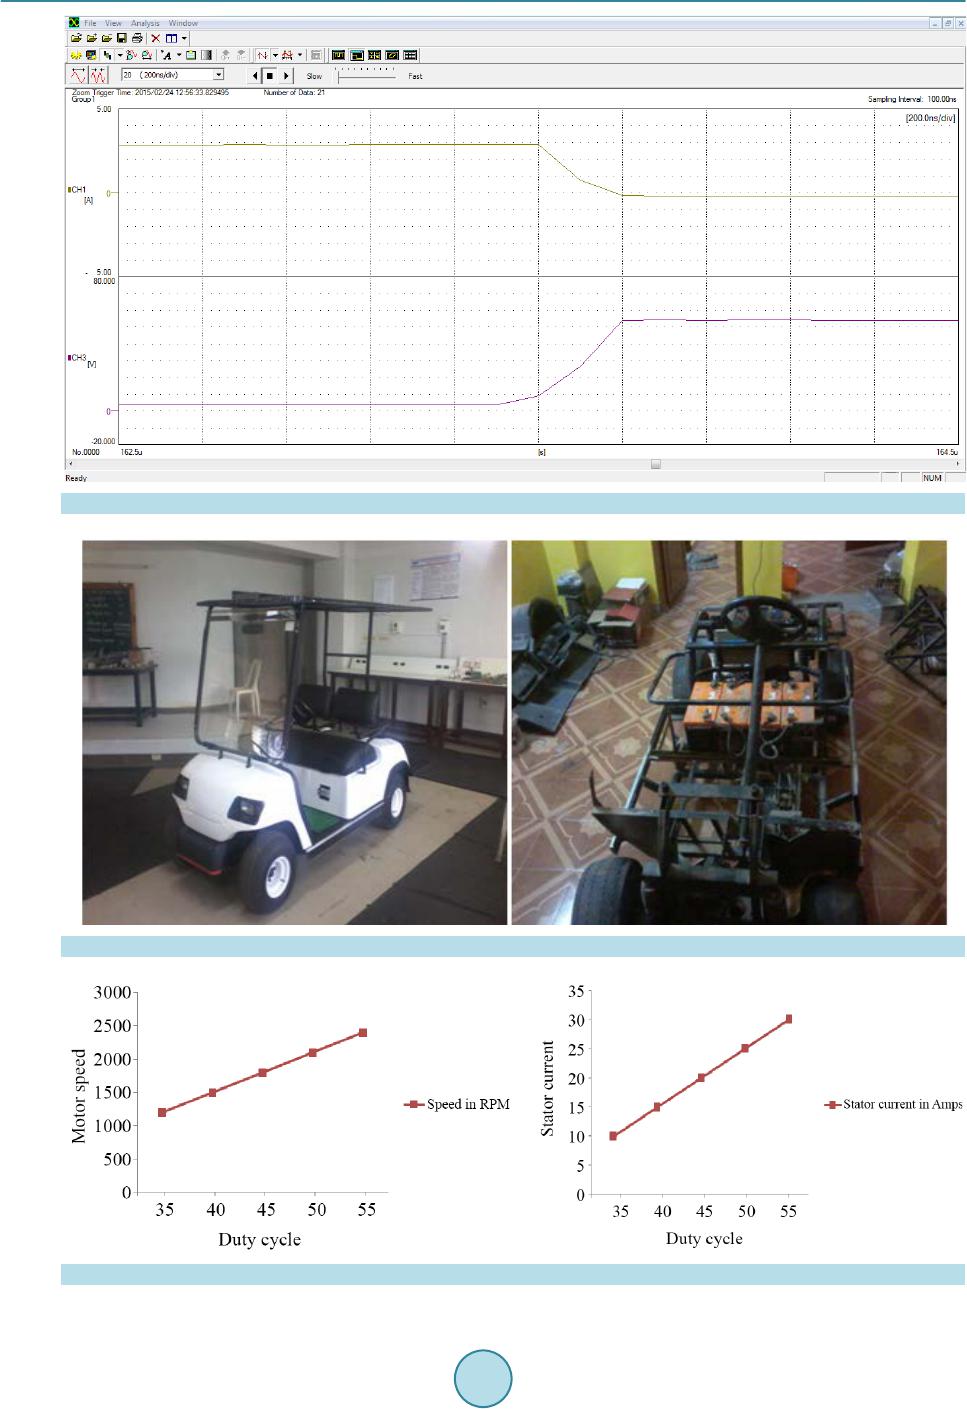 A. B. Sankar, R. Seyezhai Figure 3 3. Experimental results for discharging characteri stics. Figure 3 4. Sola r power e d electric vehicl e. Figure 3 5. Experimental values of motor speed and stator current vs. battery voltage.  A. B. Sankar, R. Seyezhai Table 2. Electric vehicle specification. Electric vehicle specification parameters Vehicle capacity 2-Seater Maximum mileage 60 km Overall Dimension 2750 mml * 1200 mmw *1800 m mh Forwar d & Reverse Sp eed 10 - 40 km/hour Groun d Clearance 1 14 mm Brakin g D istance <2 meter Tred Distance Front 870 mm Rear 980 mm Turning Radius 2.9 meter Net Weight (without battery) 290 kg Climbing Ability Safe Climbing 25% posed electric vehicle will be fuel efficient, reduce the pollution and provide noiseless operation. The drive range of the proposed electric vehicle po wered by solar is improved compared with the conventional one. Selec- tion of BLDC drive for the vehicle provides high efficiency, high operating life, torque/speed characteristics, high output power to size ratio and noiseless operation. The design of DC-DC boost converter is investigated and the input and output voltage ripple is reduced which is verified experimentally. Therefore, solar powered electric vehicle will reduce the pollution and improve the economy of the country. References [1] Spina, M.A., de la Vega , R.J., Rossi, S.R., et al. (2012) Source Issues on the Design o f a So lar Vehicle Based on Hy- brid Energy System. International Journal of Energy Engineering, 2, 15-21. http://dx.doi.org/10.5923/j.ijee.20120201.03 [2] Lalouni, S., Rekioua, D., Rekioua, T. and Matagn e, E. (2009) Fuzzy Logic Control of Standalone Photovoltaic System with Battery Storage. Journal of Power System, 193, 899-907. [3] Mangu, R., Prayaga, K., Nadimpally, B. and Ni caise, S. (2010) Design, Development and Optimization of Highly Effi- cient Solar Cars: Gato Del Sol I-IV. Proceedings of 2010 IEEE Green Technologies Conference, Grapevine, 15-16 April 2010, 1-6. [4] Husain, I. (2005) Electrical and Hybrid Vehicles Design Fundamentals. CRC Press, Boca Raton, London, New York and Washingto n DC. [5] Miller, T.J.E. (1989) Brushless Per manent Magnet and Reluctance Motor Drive. Clarendon Press, Oxford. [6] Trembly, O., Dessaint, L.A. and Dekki che, A.-I. (2007) A Generic Bat tery Model for the Dynamic Simulation of Hy- brid Electric V ehicles. 2007 IEEE Vehicle Power and Propulsion Conference, Arlington, 9-12 September 2007, 284- 289. http://dx.doi.org/10.1109/vppc.2007.4544139 [7] Bellur, D.M. and Kazimierczuk, M.K. (2007) DC-DC Converters for Electric Vehicle Applications. 2007 Electrical Insulation Conference and Electrical Manufacturing Expo, Nashville, 22-24 October 2007, 28 6-293. http://dx.doi.org/10.1109/eeic.2007.4562633 [8] Shmilovitz, D. (2005 ) On the Control of Photovoltaic Maximum Power Point Tracking via Output Parameters. IEE Proceedings—Electric Power Applications, 152, 239 -248. http://dx.doi.org/10.1049/ip-epa:20040978 [9] Chiang, S.J., Chang, K.T. and Yen, C.Y. (1998) Residential Photovoltaic Energy Storage System. IEEE Transactions on Industrial Electronics, 45, 385-394. http://dx.doi.org/10.1109/41.678996 [10] Underland, N.M.T.M. and Robinson, W.P. (2002) Power Electronics Converters Application and Design. 3rd Edit ion, John Wiley & Sons, Inc., Hoboken. [11] Shimizu, T. and Hirakata, M. (2001) Generation Control Circuit for Photovoltaic Modules. IEEE Transactions on Power E lectroni cs , 16, 293-300. http://dx.doi.org/10.1109/63.923760 [12] Beno, J., Thompson, R. and Hebner, R. (2002) Flywheel Batteries for V ehicles. Proceedings of the 2002 Work sh op on Autonomous Underwater Vehi cles, Piscataway, 99-101. http://dx.doi.org/10.1109/AUV.2002.1177211 [13] Zhu , Z.Q. and Howe, D. (2007) E lectrical Machin es and D rives for Electric, Hybrid, and Fuel Cell Veh icles. Proceed- ings of the IEEE, 95, 746-765. http://dx.doi.org/10.1109/JPROC.2006.892482 [14] Karden, E., Ploumen, S., Fricke, B., Miller, T. and Snyder, K. (2007) Energy S torage D evices for Future Hybrid Elec- tric Vehicles. Journal of Power Sou r ces, 168, 2-11. http://dx.doi.org/10.1016/j.jpowsour.2006.10.090 [15] Giannouli, M. and Yianoulis, P. (20 12) Study on the Incorporation of Photovoltaic Systems as an Auxiliary Power Source for Hybrid and Elect r ic Vehicles. Solar Energy, 86, 441-451. http://dx.doi.org/10.1016/j.solener.2011.10.019 [16] Zhang, X., Chau, K.T., Yu, C. and Chan, C.C. (2008) An Optimal Solar-Thermoelectric Hybrid Energy System for  A. B. Sankar, R. Seyezhai Hybrid Electric Vehicles. Proceedings of IEEE Vehicle Power and Propulsion Conference, Harbin, 3-5 September 2008, 1-6. [17] Zhang, X., Chau, K.T. and Chan, C.C. (20 10) Overview of Power Networks in Hybrid Electric Vehicles. Journal of Asian Electric Vehicles, 8, 1371-1377. http://dx.doi.org/10.4130/jaev.8.1371 [18] Ar sie , I., Rizzo, G. and Sorrentino, M. (2010) E ffect o f Engin e Thermal Transi ents on the Ener gy Management of Se- ries Hybrid Solar Vehicles. Control Engineer i ng Pr ac t ice, 18, 1231-1238. http://dx.doi.org/10.1016/j.conengprac.2010.01.015 [19] Matsumoto, S. (2005) Advancement of Hybrid Vehicle Technology. Proceedings of IEEE European Conference on Power Electronics and Applications, Dresden, 11-14 September 2005, 1-7. http://dx.doi.org/10.1109/epe.2005.219775
|