 Vol.1, No.2, 48-56 (2011) Open Journal of Ecology http://dx.doi.org/10.4236/oje.2011.12006 Copyright © 2011 SciRes. OPEN ACCESS Assessment of Posidonia oceanica (L.) Delile conservation status by standard and putative approaches: the case study of Santa Marinella meadow (Italy, W Mediterranean)* Alice Rotini1, Carla Micheli2, Luigi Valiante3, Luciana Migliore1* 1Department Biology, Tor Vergata University, Rome, Italy; *Corresponding Author: luciana.migliore@uniroma2.it 2ENEA, Centro Ricerche Casaccia, Rome, Italy; 3ECON s.r.l., Naples, Italy; Received 10 June 2011; revised 4 July 2011; accepted 15 July 2011. ABSTRACT The conservation status of the Posidonia oce- anica meadow at Santa Marinella (Rome) was evaluated through both standard (bed density, leaf biometry, “A” coefficient, Leaf Area Index, rhizome production) and biochemical/genetic approaches (total phenol content and Random Amplified Polymorphic DNA marker). The bio- chemical/genetic results are in agreement with those obtained by standard approaches. The bed under study was ranked as a disturbed one, due to its low density, and high heterogeneity in leaf biometry, LAI values, “A” coefficient and primary production. This low quality ranking is confirmed by both mean phenol content in pla- nts, quite high and scattered, and by the low genetic variability in the meadow, with a very high similarity of specimen at a local scale. Hence, these two putative approaches clearly identify the endangered conservation status of the meadow. They link plant biodiversity and ecophysiology to ecosystem ‘health’. Further- more, they are repeatable and standardizable and could be usefully introduced in meadows monitoring to check environmental quality. Keywords: Posidonia oceanica; Genetic Variability; Environmental Indicator; RAPD; Seagrass Monitoring; Total Phenols 1. INTRODUCTION Posidonia oceanica (L.) Delile (PO) is the dominant endemic seagrass in the Mediterranean Sea, where it forms meadows which play a crucial role in coastal ecosystem dynamics. They produce high amount of oxygen and organic compounds, sustain food nets, and act as a nursery/refuge for several species. Furthermore they preserve coastal systems trapping sediments into the matte and reducing hydrodynamics [1]. PO is re- garded as a key species, being listed in the Habitat Di- rective 92/43/EEC. Throughout most of the Mediterranean Sea, natural processes and human activities are responsible for a widespread PO meadow regression [2-3]. The identifica- tion of ‘new diagnostic tools’ to monitor the meadows conservation status is a critical issue. Standard monitor- ing indicators are several [4-10]; according to Montefal- cone [11] standard monitoring indicators can be classified as structural descriptors at individual level (shoot phenology and biomass), at population level (bed density and coverage) or at community level (leaves epiphytes). However, many of them suffer of a lack in sensitivity and often to obtain significant information it’s necessary to use a combination/integration of indicators [12]. The identification of approaches providing early and ecologi- cally relevant information, useful for policy and man- agement, is still a critical issue. Recently two putative approaches were proposed [13-15]: phenolic compounds and Random Amplified Polymorphic DNA (RAPD) markers. If conveniently modified, these well known methods can clearly iden- tify PO alterations. Phenolic compounds, as in terrestrial plants [16], can work as biochemical markers of environmental stress *This work is dedicated to the memory of the late Professor Eugenio Fresi  A. Rotini et al. / Open Journal of Ecology 1 (2011) 48-56 Copyright © 2011 SciRes. OPEN ACCESS 49 (total phenol determination is an easy and rapid assay). They are a class of secondary metabolites widely dis- tributed in terrestrial [17] and aquatic plants [18-19]. Phenolic compounds are present in roots, stems, rhi- zomes, leaves, flowers and fruits playing several struc- tural and physiological roles, including the defense of plants. High phenol concentrations were found in PO leaves exposed to different environmental pressures: competition with the invasive seaweed Caulerpa taxifo- lia [20-21], contamination by metals [22], proximity to intensive fish aquaculture [23]. The increase of phenolic compounds represents a generic response to different environmental stress and thus can be used to screen the meadow health state. Total phenol concentration varies in leaves with season due to leaves’ short lifespan [21,24] and with depth. On the opposite, levels of synthesis and accumulation of phenolic compounds are more stable in rhizomes [15,24]. The decline of PO can be facilitated by low genetic diversity which results from a restricted gene flow, as suggested by trinucleotide [25-26] and dinucleotide [27] microsatellites. Low genetic diversity may result in low resistance, low resilience and limited adaptability to environmental changes [13,28-29]. RAPD markers have been used to assess the pattern of genetic diversity and the genetic structure of rare and endangered plants. They provide information for the conservation of en- dangered plants [30]. Moreover, they have been suc- cessfully used to assess genetic diversity of other sea- grasses [31-32]. RAPDs revealed both the intra-population variability in P. australis [33], and the high genetic ho- mogeneity in Cymodocea nodosa from Northern Atlan- tic [34]. They have been used to compare the genetic diversity of Cymodocea nodosa and P. oceanica popu- lations in the Mediterranean Sea [35]. Furthermore, RAPD markers revealed a decreased genetic diversity in PO along an anthropogenic disturbance gradient, both at small within a meadow and at Mediterranean scale [13]. Analogous trends were found in others sea- grasses [36]. Hence, total phenol content in rhizome and RAPD markers in leaves are inexpensive and uncomplicated methods, potentially useful for PO meadows monitor- ing. The aim of this study is to describe the conservation status of a specific meadow by comparing the results of phenol content and RAPDs (putative approaches) to the standard ones. The superimposition of results will con- firm that the putative methods can detect alterations in the meadow and properly contribute to assess the meadow “health status”. To this end, plants from the Santa Marinella meadow (Rome, Italy, W Mediterranean), collected in Spring 2004, were analyzed to obtain the quantification of phenolic compounds and RAPD marker profile. 2. MATERIALS AND METHODS 2.1. Study Site and Sampling The study was conducted on the PO meadow of Santa Marinella (Rome, Italy; Figure 1), a Site of Community Importance (according to Habitat Directive 92/43/EEC). This meadow, spanning from Capo Linaro to Santa Sev- era, for a 13.5 km coastline and covering a surface of 1,800 ha, can be considered a “pure bed”, i.e. mono- specific, with patched distribution and a regressive limit, characterized by the presence of dead matte. The lower limit is at –20 m depth [37]. This meadow is under an- thropogenic impact, mainly intensive agriculture and land use, causing increased water turbidity and fine sediment input. The streams and watercourses flowing in Santa Marinella sea stretch are responsible of pollutant, fine sediment and nutrient input to the sea [38-40]. Sampling was carried out in late spring 2004; 30 sam- pling stations were randomly chosen in the central area of the meadow (about 5 ha), on a relatively homogene- ous topography. The bathymetric values of the sampling area ranged from 7.5 to 13.5 m depth (see Supplemental Data for sampling site information). Samples were obtained by SCUBA diving. In each sampling station shoots were collected for phenologi- cal/lepidochronological analyses (15) and for phenol determination (3 orthotropic). Furthermore, in 4 selected stations (Figure 1), 5 orthotropic shoots per site were sampled for RAPD marker analyses. In § 3.2 are shown some data from the Talamone meadow (Tuscany, Italy; 30 sampling sites at compara- ble depth), which is considered well preserved according to phenological and lepidochronological analysis [24]. All these samples were analysed in our laboratory by the same experimental protocol (unpublished data by L. Migliore, personal communication). 2.2. Phenological and Lepidochronological Analyses Shoot density was evaluated in situ by counting the number of shoots using 40 × 40 cm standard quadrates, five measurements at each site. The value obtained is expressed as number of shoots/m2. Number and biometry of leaving leaves (foliar shoots) were determined, on 10 shoots for sampling site, ac- cording to Giraud [41]. “A” coefficient (percentage of leaves with lost apex) and Leaf Area Index (LAI, leaf surface area per shoot, cm2/shoot) were also calculated.  A. Rotini et al. / Open Journal of Ecology 1 (2011) 48-56 Copyright © 2011 SciRes. OPEN ACCESS 50 Figure 1. Sampling area’s map in the Santa Marinella meadow (Rome, Italy), showing the 30 sampling stations and the bottom characteristics. Stations where genetic analysis was performed are indicated by stars instead of dots. Lepidochronological analysis was carried out on 5 shoots for sampling site, according to standard methods [42], in order to estimate the annual primary production of the rhizomes, expressed as mg rhizome (dry weight, d.w.) produced per shoot per year. 2.3. Total Phenols Total phenol determinations were carried out in du- plicate on 3 different rhizomes for each sampling site according to Migliore et al. [15]. Shoots were main- tained under dark and stored at –20˚C until processing. Plants were first rinsed in 0.1 Triton-X (Sigma) and then in distilled water to remove epiphytes and contaminants. Phenolic compounds were extracted according to Le- grand [43] modified for PO on 100 mg (fresh weight, f.w.) of basal, intermediate and apical sections of the rhizome. Quantification of total phenols was performed by spectrophotometry [λ = 724 nm, chlorogenic acid (Sigma) as standard] using the Booker and Miller [44] method. The amount of protein, known to interfere with Folin-Ciacolteau reagent (Sigma), was determined by the Bradford assay. 2.4. Genetic Analysis Genetic analysis was carried out in duplicate on 5 plants from the 4 selected station. The plants were washed in distilled water and the young leaves stored in liquid nitrogen at −180˚C until processing. Extraction of genomic DNA was carried out according to the protocol of Dellaporta et al. [45]. The PCR amplification was performed (Perkin Elmer 2400) using 10 primers; se- quences are reported in table 1. The primers (10 mM) were chosen for their capacity for discriminating bands and scoring them as present/absent; they gave high re- producibility of electrophoresis pattern in both the signal intensity and the number of bands. All the experiments, including the PCR amplification and electrophoresis conditions, were carried out accord- ing to Micheli et al. [13]. 2.5. Statistical Analysis One-way ANOVA test was utilized to evaluate differ- ences in total phenol content between Talamone and Santa Marinella meadows and among rhizome sections from the two sampling sites. Parametric hypotheses were tested. Box-plots were utilized to show the distribution of bed density, leaf biometry and phenol content data; the box contains 50% data (the extremes of each box are the Q1  A. Rotini et al. / Open Journal of Ecology 1 (2011) 48-56 Copyright © 2011 SciRes. OPEN ACCESS 51 and Q3, 1st and 3rd quartiles), the internal horizontal segment represents the median of the distribution (Q2 value, 2nd quartile), “whiskers” range from the lowest to the highest value. All the RAPD data were elaborated using NT-SYS-pc (Numerical Taxonomy and Multivariate Analysis System) computer package. The bands were recorded as present (1) or absent (0) and assembled in a data matrix table. Then similarity coefficients (Dice index) were obtained (Simqual data matrix, NT-SYS-pc) and their average and standard deviation were calculated. The Nei’s coeffi- cients of similarity between each pair of samples were used to construct a dendrogram using the unweighted pair group method with arithmetic averages (UPGMA). 3. RESULTS AND DISCUSSION 3.1. Standard Monitoring Approaches The absolute density throughout the Santa Marinella meadow is reported in Figure 2A and Supplemental Data; the mean value for the meadow is 342.8 leaves shoots/m2. According to the classification proposed by Pergent et al. [46] and modified by Buia et al. [47], this meadow is considered a “disturbed bed”. The leaf biometry (i.e. number, length and width) was also recorded (Figure 2B-D) to calculate LAI values per shoot (see Supplemental Data for the complete data set). LAIs range from 120 to 68.6 and they probably represent the highest values all the year round, as LAI is maxi- mum at the end of spring and a minimum in late autumn or at the beginning of winter [48]. Santa Marinella LAI values are comparable to those found in other Tyrrhenian meadows [49-51]. The “A” coefficient shows heterogeneous values be- tween stations (see Supplemental Data), from a mini- mum of 25% to a maximum of 80%, suggesting a high spatial heterogeneity in mechanical stress or grazing in the meadow. Both “A” coefficient (r = –0.63; p < 0.01) and LAI/shoot (r = –0.56; p < 0.02) seems negatively related to depth, although the range of bathymetric val- ues is narrow (Figure 3A and B). The mean value of the rhizome production is 41.3 mg (d. w.)/shoot/yr, ranging from 26 to 59 (see Supplemen- tal Data); values are lower than those registered in meadows with same morphological characteristics [39] and no relationship with depth was found. 3.2. Putative Approach I: Phenols Content The total phenol mean content in the entire rhizome is 18.7 mg/g (f. w.), ranging from 8.8 to 30.2 mg/g (Figure 4A). In all rhizomes a decrease in total phenol concen- tration from the apical to the basal section is found; dif- ferences are statistically significant (ANOVA, F = 38.1, p0.01; Figure 4B). These data have been compared with total phenol content, quantified in plants from the Talamone (Tuscany, Italy; see § 2.1) meadow. In Talamone’s plants the total phenol mean content is 5.62 mg/g f. w. (n = 72; SE 0.15) Figure 2. Density (A) and leaves biometry (B-D) reported as box-plots. The box contains 50% data, the horizontal segment repre- sents the median, ‘whiskers’ range from the lowest to the highest recorded value. 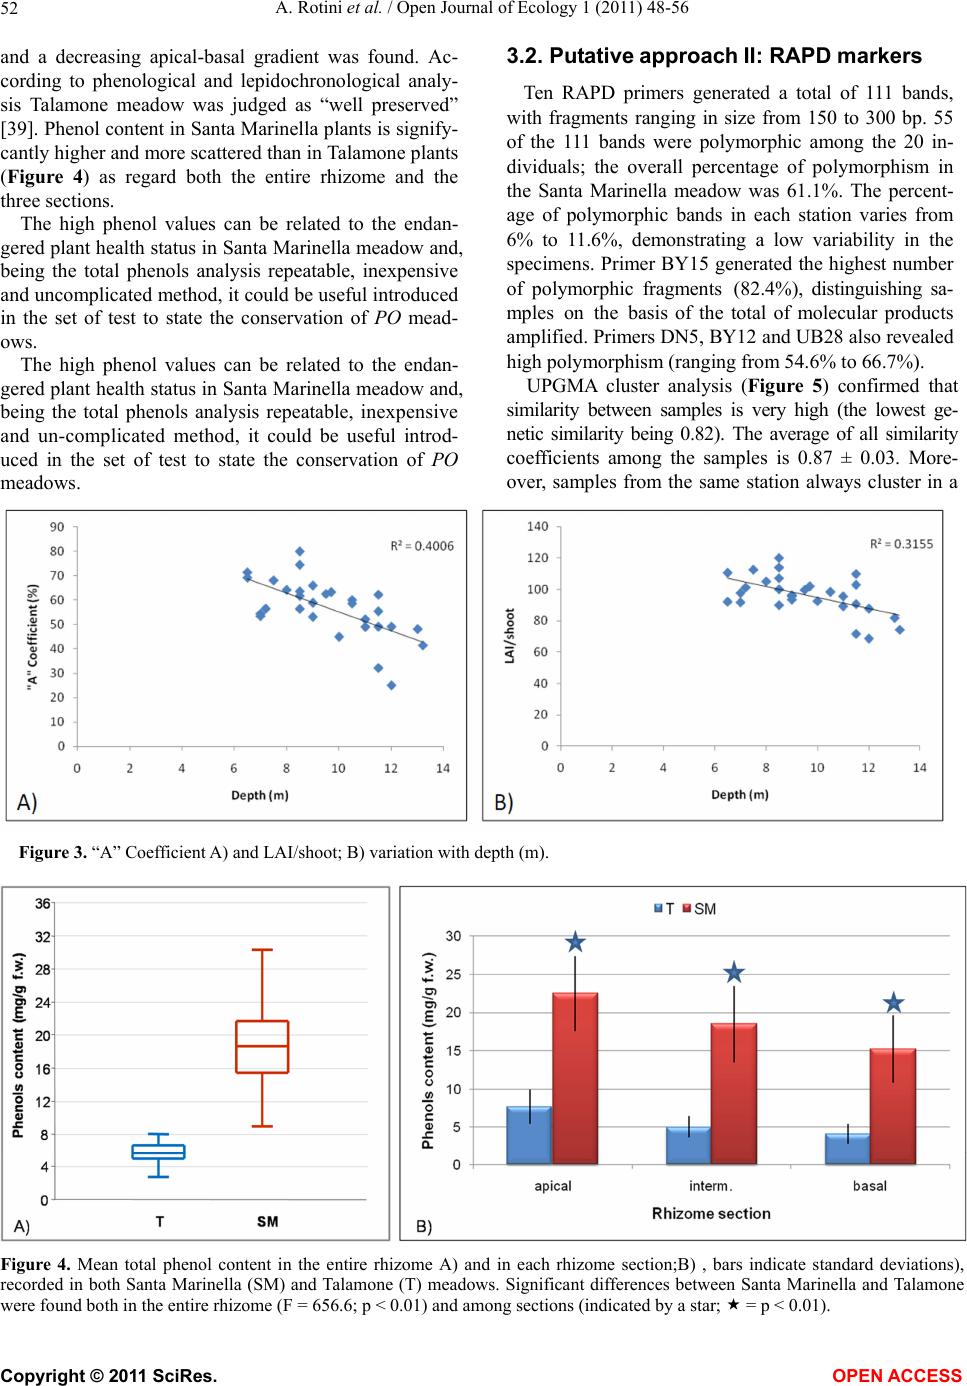 A. Rotini et al. / Open Journal of Ecology 1 (2011) 48-56 Copyright © 2011 SciRes. OPEN ACCESS 52 and a decreasing apical-basal gradient was found. Ac- cording to phenological and lepidochronological analy- sis Talamone meadow was judged as “well preserved” [39]. Phenol content in Santa Marinella plants is signify- cantly higher and more scattered than in Talamone plants (Figure 4) as regard both the entire rhizome and the three sections. The high phenol values can be related to the endan- gered plant health status in Santa Marinella meadow and, being the total phenols analysis repeatable, inexpensive and uncomplicated method, it could be useful introduced in the set of test to state the conservation of PO mead- ows. The high phenol values can be related to the endan- gered plant health status in Santa Marinella meadow and, being the total phenols analysis repeatable, inexpensive and un-complicated method, it could be useful introd- uced in the set of test to state the conservation of PO meadows. 3.2. Putative approach II: RAPD markers Ten RAPD primers generated a total of 111 bands, with fragments ranging in size from 150 to 300 bp. 55 of the 111 bands were polymorphic among the 20 in- dividuals; the overall percentage of polymorphism in the Santa Marinella meadow was 61.1%. The percent- age of polymorphic bands in each station varies from 6% to 11.6%, demonstrating a low variability in the specimens. Primer BY15 generated the highest number of polymorphic fragments (82.4%), distinguishing sa- mples on the basis of the total of molecular products amplified. Primers DN5, BY12 and UB28 also revealed high polymorphism (ranging from 54.6% to 66.7%). UPGMA cluster analysis (Figure 5) confirmed that similarity between samples is very high (the lowest ge- netic similarity being 0.82). The average of all similarity coefficients among the samples is 0.87 ± 0.03. More- over, samples from the same station always cluster in a Figure 3. “A” Coefficient A) and LAI/shoot; B) variation with depth (m). Figure 4. Mean total phenol content in the entire rhizome A) and in each rhizome section;B) , bars indicate standard deviations), recorded in both Santa Marinella (SM) and Talamone (T) meadows. Significant differences between Santa Marinella and Talamone were found both in the entire rhizome (F = 656.6; p < 0.01) and among sections (indicated by a star; = p < 0.01). 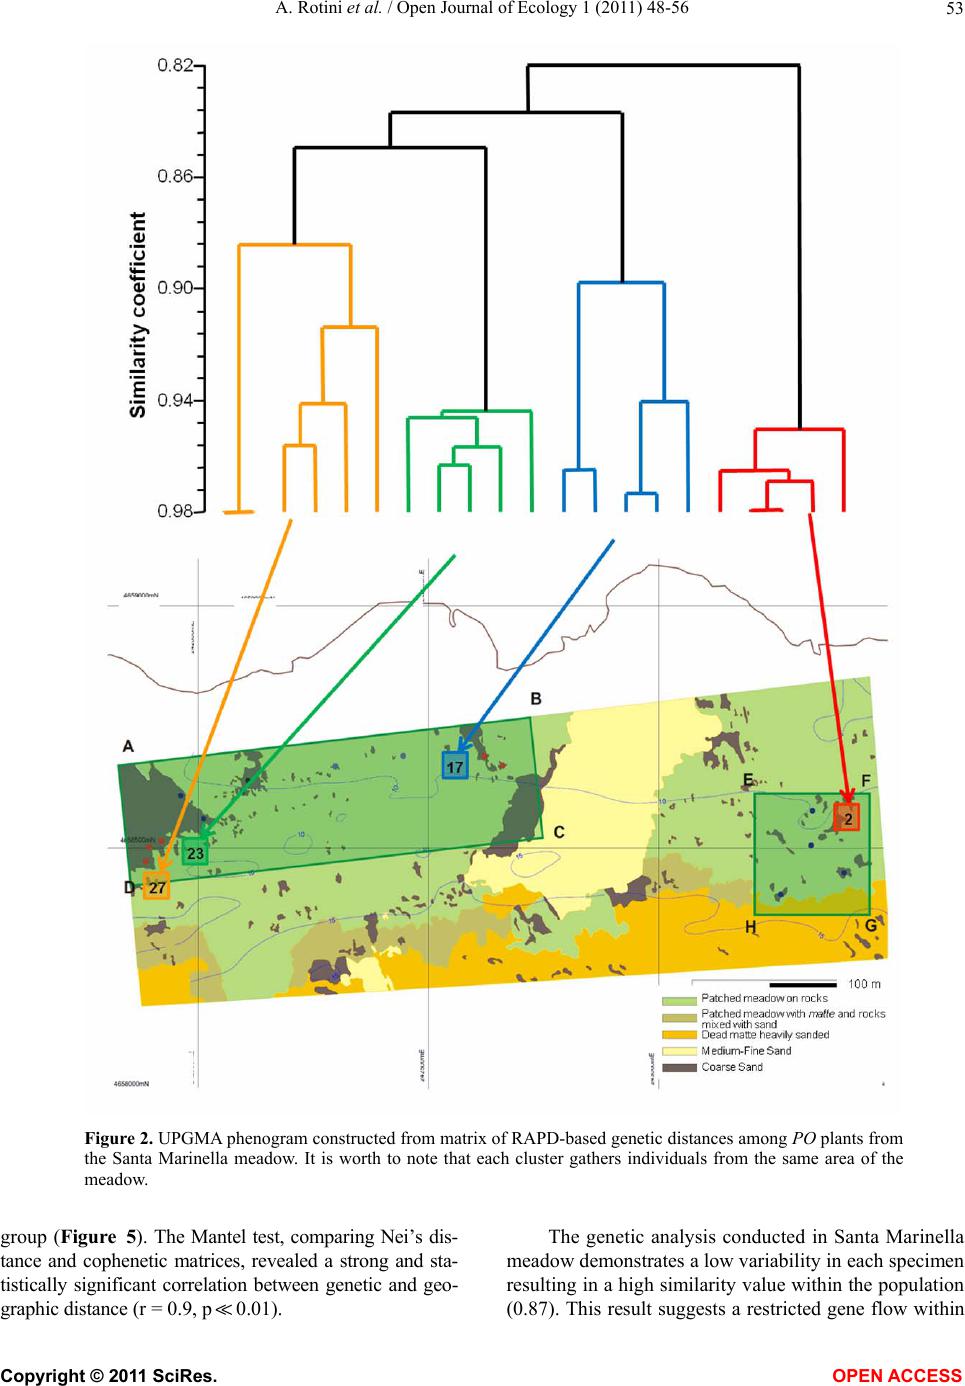 A. Rotini et al. / Open Journal of Ecology 1 (2011) 48-56 Copyright © 2011 SciRes. OPEN ACCESS 53 Figure 2. UPGMA phenogram constructed from matrix of RAPD-based genetic distances among PO plants from the Santa Marinella meadow. It is worth to note that each cluster gathers individuals from the same area of the meadow. group (Figure 5). The Mantel test, comparing Nei’s dis- tance and cophenetic matrices, revealed a strong and sta- tistically significant correlation between genetic and geo- graphic distance (r = 0.9, p0.01). The genetic analysis conducted in Santa Marinella meadow demonstrates a low variability in each specimen resulting in a high similarity value within the population (0.87). This result suggests a restricted gene flow within 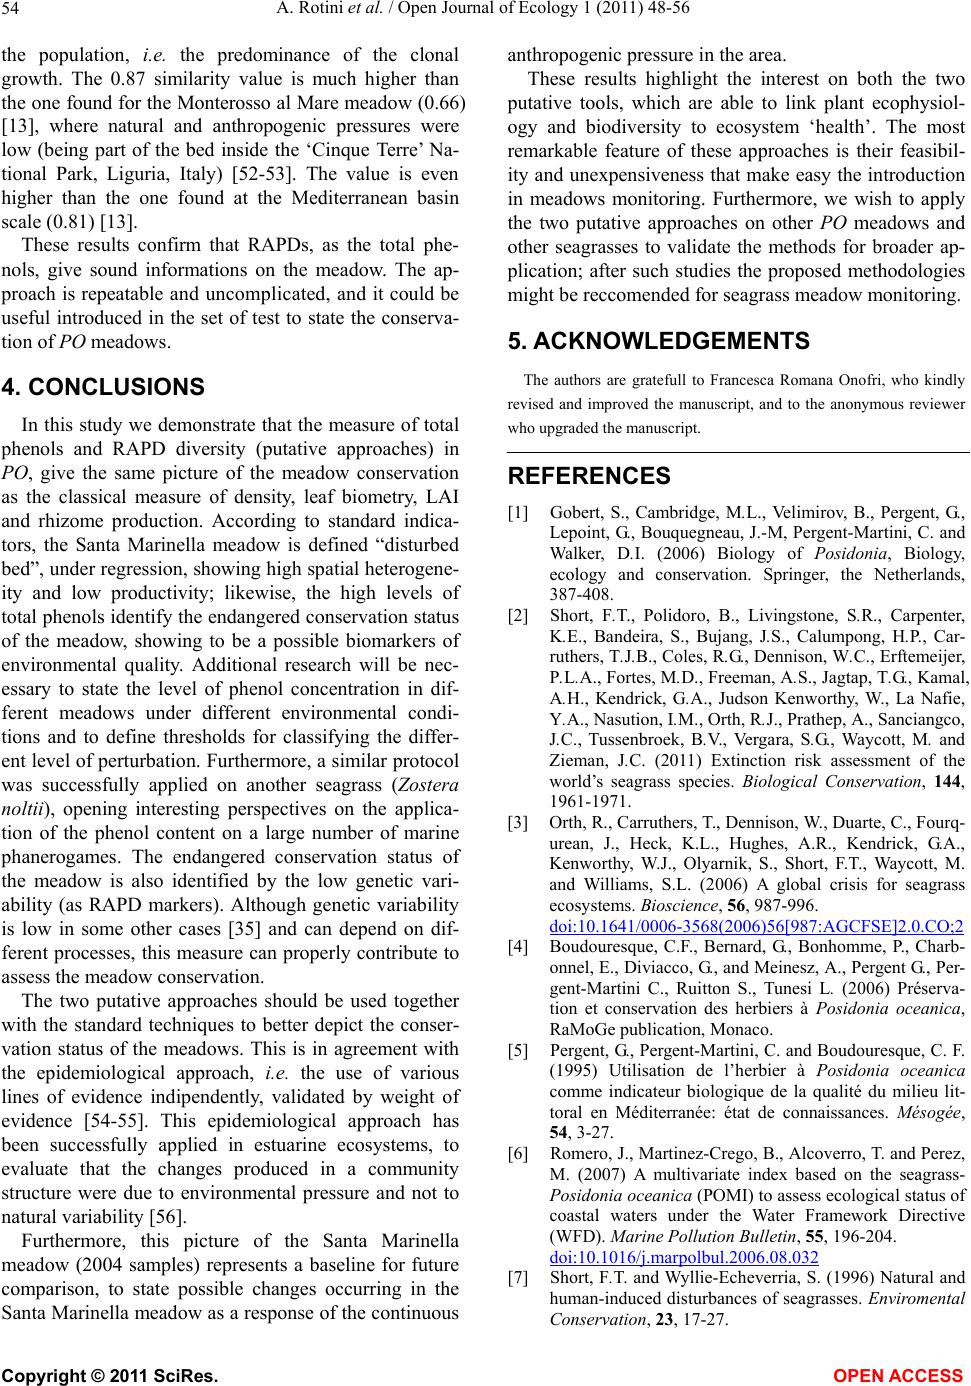 A. Rotini et al. / Open Journal of Ecology 1 (2011) 48-56 Copyright © 2011 SciRes. OPEN ACCESS 54 the population, i.e. the predominance of the clonal growth. The 0.87 similarity value is much higher than the one found for the Monterosso al Mare meadow (0.66) [13], where natural and anthropogenic pressures were low (being part of the bed inside the ‘Cinque Terre’ Na- tional Park, Liguria, Italy) [52-53]. The value is even higher than the one found at the Mediterranean basin scale (0.81) [13]. These results confirm that RAPDs, as the total phe- nols, give sound informations on the meadow. The ap- proach is repeatable and uncomplicated, and it could be useful introduced in the set of test to state the conserva- tion of PO meadows. 4. CONCLUSIONS In this study we demonstrate that the measure of total phenols and RAPD diversity (putative approaches) in PO, give the same picture of the meadow conservation as the classical measure of density, leaf biometry, LAI and rhizome production. According to standard indica- tors, the Santa Marinella meadow is defined “disturbed bed”, under regression, showing high spatial heterogene- ity and low productivity; likewise, the high levels of total phenols identify the endangered conservation status of the meadow, showing to be a possible biomarkers of environmental quality. Additional research will be nec- essary to state the level of phenol concentration in dif- ferent meadows under different environmental condi- tions and to define thresholds for classifying the differ- ent level of perturbation. Furthermore, a similar protocol was successfully applied on another seagrass (Zostera noltii), opening interesting perspectives on the applica- tion of the phenol content on a large number of marine phanerogames. The endangered conservation status of the meadow is also identified by the low genetic vari- ability (as RAPD markers). Although genetic variability is low in some other cases [35] and can depend on dif- ferent processes, this measure can properly contribute to assess the meadow conservation. The two putative approaches should be used together with the standard techniques to better depict the conser- vation status of the meadows. This is in agreement with the epidemiological approach, i.e. the use of various lines of evidence indipendently, validated by weight of evidence [54-55]. This epidemiological approach has been successfully applied in estuarine ecosystems, to evaluate that the changes produced in a community structure were due to environmental pressure and not to natural variability [56]. Furthermore, this picture of the Santa Marinella meadow (2004 samples) represents a baseline for future comparison, to state possible changes occurring in the Santa Marinella meadow as a response of the continuous anthropogenic pressure in the area. These results highlight the interest on both the two putative tools, which are able to link plant ecophysiol- ogy and biodiversity to ecosystem ‘health’. The most remarkable feature of these approaches is their feasibil- ity and unexpensiveness that make easy the introduction in meadows monitoring. Furthermore, we wish to apply the two putative approaches on other PO meadows and other seagrasses to validate the methods for broader ap- plication; after such studies the proposed methodologies might be reccomended for seagrass meadow monitoring. 5. ACKNOWLEDGEMENTS The authors are gratefull to Francesca Romana Onofri, who kindly revised and improved the manuscript, and to the anonymous reviewer who upgraded the manuscript. REFERENCES [1] Gobert, S., Cambridge, M.L., Velimirov, B., Pergent, G., Lepoint, G., Bouquegneau, J.-M, Pergent-Martini, C. and Walker, D.I. (2006) Biology of Posidonia, Biology, ecology and conservation. Springer, the Netherlands, 387-408. [2] Short, F.T., Polidoro, B., Livingstone, S.R., Carpenter, K.E., Bandeira, S., Bujang, J.S., Calumpong, H.P., Car- ruthers, T.J.B., Coles, R.G., Dennison, W.C., Erftemeijer, P.L.A., Fortes, M.D., Freeman, A.S., Jagtap, T.G., Kamal, A.H., Kendrick, G.A., Judson Kenworthy, W., La Nafie, Y.A., Nasution, I.M., Orth, R.J., Prathep, A., Sanciangco, J.C., Tussenbroek, B.V., Vergara, S.G., Waycott, M. and Zieman, J.C. (2011) Extinction risk assessment of the world’s seagrass species. Biological Conservation, 144, 1961-1971. [3] Orth, R., Carruthers, T., Dennison, W., Duarte, C., Fourq- urean, J., Heck, K.L., Hughes, A.R., Kendrick, G.A., Kenworthy, W.J., Olyarnik, S., Short, F.T., Waycott, M. and Williams, S.L. (2006) A global crisis for seagrass ecosystems. Bioscience, 56, 987-996. doi:10.1641/0006-3568(2006)56[987:AGCFSE]2.0.CO;2 [4] Boudouresque, C.F., Bernard, G., Bonhomme, P., Charb- onnel, E., Diviacco, G., and Meinesz, A., Pergent G., Per- gent-Martini C., Ruitton S., Tunesi L. (2006) Préserva- tion et conservation des herbiers à Posidonia oceanica, RaMoGe publication, Monaco. [5] Pergent, G., Pergent-Martini, C. and Boudouresque, C. F. (1995) Utilisation de l’herbier à Posidonia oceanica comme indicateur biologique de la qualité du milieu lit- toral en Méditerranée: état de connaissances. Mésogée, 54, 3-27. [6] Romero, J., Martinez-Crego, B., Alcoverro, T. and Perez, M. (2007) A multivariate index based on the seagrass- Posidonia oceanica (POMI) to assess ecological status of coastal waters under the Water Framework Directive (WFD). Marine Pollution Bulletin, 55, 196-204. doi:10.1016/j.marpolbul.2006.08.032 [7] Short, F.T. and Wyllie-Echeverria, S. (1996) Natural and human-induced disturbances of seagrasses. Enviromental Conservation, 23, 17-27.  A. Rotini et al. / Open Journal of Ecology 1 (2011) 48-56 Copyright © 2011 SciRes. OPEN ACCESS 55 doi:10.1017/S0376892900038212 [8] Gobert, S., Sartoretto, S., Rico-Raimondino, V., Andral, B., Chery, A., Lejeune, P. and Boissery, P. (2009) As- sessment of the ecological status of Mediterranean French coastal waters as required by the Water Framwork Directive using the Posidonia oceanica Rapid Easy In- dex: PREI. Marine Pollution Bulletin, 58, 17-27-1733. doi:10.1016/j.marpolbul.2009.06.012 [9] Lopez y Royo, C., Casazza, G., Pergent-Martini, C. and Pergent, G. (2010) A biotic index using the seagrass Posidonia oceanica (BiPo), to evaluate ecological status of coastal waters. Ecological Indicators, 10, 380-389. doi:10.1016/j.ecolind.2009.07.005 [10] Pergent-Martini, C., Leonia, V., Pasqualini, V., Ardizzone, G.D., Balestri, E., Bedinid, R., Belluscio, A., Belsher, T., Borg, J.A., Boudouresque, C.F., Boumaza, S., Bou- quegneau, J.M., Buia, M.C., Calvo, S., Cebrian, J., Char- bonnel, E., Cinelli, F., Cossu, A., Di Maida, G., Dural, B., Francour, P., Gobert, S., Lepoint, G., Meinesz, A., Mole- naar, H., Mansour, H.M., Panayotidis, P., Peirano, A., Pergent, G., Piazzi, L., Pirrotta, M., Relini, G., Romero, J., Sanchez-Lizaso, J.L., Semroud, R., Shembri, P., Shili, A., Tomasello, A., Velimirov, B. (2005) Descriptors of Posi- donia oceanica meadows: Use and application. Ecological Indicators, 5, 213-230. doi:10.1016/j.ecolind.2005.02.004 [11] Montefalcone, M. (2009) Ecosystem health assessment using the Mediterranean seagrass Posidonia oceanica: a review, Ecolological Indicators, 9, 595-604. doi:10.1016/j.ecolind.2008.09.013 [12] Martínez Crego, B., Alcoverro, T. and Romero, J. (2008) Biotic indices for assessing the status of coastal waters: a review of strengths and weaknesses. Journal of Env- ironmental Monitoring, 12, 1013-1028. [13] Micheli, C., Paganin, P., Peirano, A., Caye, G., Meinesz, A. and Bianchi, C.N. (2005) Genetic variability of Posi- donia oceanica (L.) Delile in relation to local factors and biogeographic patterns, Aquatic Botany, 82, 210-221. doi:10.1016/j.aquabot.2005.03.002 [14] Micheli, C., Spinosa, F., Aliani, S., Gasparini, G.P., Mol- card, A. and Peirano, A. (2010) Genetic input by Posido- nia oceanica (L.) Delile fruits dispersed by currents. Plant Biosystems, 144, 333-339. doi:10.1080/11263501003764798 [15] Migliore, L., Rotini, A., Randazzo, D., Albanese, N.N. and Giallongo, A. (2007) Phenols content and 2-D elec- trophoresis protein pattern: a promising tool to monitor Posidonia meadows health state. BMC Ecology, 7, 6. doi:10.1186/1472-6785-7-6 [16] Dixon, R.A. and Paiva, N.L. (1995) Stress-induced phen- ylpropanoid metabolism, The Plant Cell, 7, 10-85-1097. [17] Bate-Smith, E.C. (1968) The phenolic constituents of plants and their taxonomy significance, II Monocotyle- dons. Journal of the Linnean Society of London: Botany, 60, 325-356. doi:10.1111/j.1095-8339.1968.tb00094.x [18] Mc Clure, J.W. (1970) Secondary constituents of aquatic angiosperms. In Harborne, J.B., Ed., Phytochemical Phylogeny. Academic Press, London, 233-268. [19] Zapata, O. and Mc Millan, C. (1979) Phenolic acids in seagrasses. Aquatic Botany, 7, 307-317. doi:10.1016/0304-3770(79)90032-9 [20] Cuny, P., Serve, L., Jupin, H. and Boudouresque, C.F. (1995) Water soluble phenolic compounds of the marine phanerogam Posidonia oceanica in a Mediterranean area colonised by the introduced chlorophyte, Caulerpa taxi- folia, Aquatic Botany, 52, 237-242. doi:10.1016/0304-3770(95)00504-8 [21] Dumay, O., Costa, J., Desjobert, J.M. and Pergent, G. (2004) Variations in the concentration of phenolic com- pounds in the seagrass Posidonia oceanica under condi- tions of competition. Phytochemistry, 65, 3211-3220. doi:10.1016/j.phytochem.2004.09.003 [22] Ferrat, L., Pergent-Martini, C., Romeo, M. and Pergent, G. (2003) Hydrosoluble phenolic compounds production in a Mediterranean seagrass according to mercury con- tamination. Gulf of Mexico Science Journal, 21, 108. [23] Cannac, M., Ferrat, L., Pergent-Martini, C., Pergent, G. and Pasqualini, V. (2006) Effects of fish farming on fla- vonoids in Posidonia oceanica. Science of the Total En- vironment, 370, 91-98. doi:10.1016/j.scitotenv.2006.07.016 [24] Fresi, E., Dolce, T., Forni, C., Lorenzi, C., Migliore, L., Rizzelli, D. and Scardi, M. (2004) La prateria di Posido- nia oceanica (L.) Delile di Talamone (Grosseto, Italia): struttura e stato di salute, Conference: Le scienze naturali, economiche e giuridiche nello studio e per la gestione degli ambienti acquatici, 18-22 October 2004. Terrasini, Palermo, CONISMA-AIOL. [25] Procaccini, G., Ruggiero, M.V. and Orsini, L. (2002) Genetic structure and distribution of microsatellite popu- lation genetic diversity in Posidonia oceanica in the Mediterranean basin. Bullettin of Marine Science, 71, 1291-1297. [26] Ruggiero, M.V., Turk, R. and Procaccini, G. (2002) Ge- netic identity and homozygosity in North-Adriatic popu- lations of Posidonia oceanica: an ancient, postglacial clone? Conservation Genetics, 3, 71-74. doi:10.1023/A:1014207122382 [27] Serra, I.A., Innocenti, A.M., Di Maida, G., Calvo, S., Migliaccio, M. and Zambianchi, E., et al. (2010) Genetic structure in the Mediterranean seagrass Posidonia oce- anica: disentangling past vicariance events from con- temporary patterns of gene flow. Molecular Ecology, 19, 557-568. doi:10.1111/j.1365-294X.2009.04462.x [28] Arnaud-Haond, S., Marbà, N., Diaz-Almela, E., Serrão, E.A. and Duarte, C.M. (2010) Comparative analysis of stability-genetic diversity in seagrass (Posidonia oce- anica) meadows yields unexpected results. Estuaries and Coasts, 33, 878-889. doi:10.1007/s12237-009-9238-9 [29] Procaccini, G., Olsen, J.L. and Reusch, T.B.H. (2007) Contribution of genetics and genomics to seagrass biol- ogy and conservation. Journal of Experimental Marine Biology and Ecology, 350, 234-259. doi:10.1016/j.jembe.2007.05.035 [30] Dong, Y.H., Gituru, R.W. and Wang, Q.F. (2010) Genetic variation and gene flow in the endagered aquatic fern Ceratopteris pteridoides in China and conservation im- plications. Annales Botanici Fennici, 47, 34-44. [31] Jones, T.C., Gemmill, C.E.C. and Pilditch, C.A. (2008) Genetic variability of New Zealand seagrass (Zostera- muelleri) assessed at multiple spatial scales. Aquatic Botany, 88, 39-46. doi:10.1016/j.aquabot.2007.08.017 [32] Williams, J.G.K., Kubelik, A.R., Livak, K.J., Rafalski,  A. Rotini et al. / Open Journal of Ecology 1 (2011) 48-56 Copyright © 2011 SciRes. OPEN ACCESS 56 J.A. and Tingey, S.V. (1990) DNA polymorphisms am- plified by arbitrary primers are useful as genetic markers. Nucleic Acids Research, 18, 6531-6535. doi:10.1093/nar/18.22.6531 [33] Waycott, M. (1998) Genetic variation, its assessment and implications to the conservation of seagrasses. Molecular Ecology, 7, 793-800. doi:10.1046/j.1365-294x.1998.00375.x [34] Alberto, F., Mata, L. and Santos, R. (2001) Genetic ho- mogeneity in the seagrass Cymodocea nodosa at its northern Atlantic limit revealed through RAPD. Marine Ecology Progress Series, 221, 299-301. doi:10.3354/meps221299 [35] Procaccini, G., and Mazzella, L. (1996) Genetic variabil- ity and reproduction in two Mediterranean seagrasses. In: Kuo, J., Phillips, R.C., Walker, D.I., Kirkman, H., Eds., Seagrass Biology: Proceedings of an international wor- kshop, SCIENCES UWA, Rottnest Island, Western Aus- tralia, 85-92. [36] Micheli, C., Paganin, P., Maffucci, M., Nascetti, G., Rismondo, A. and Curiel, D. (2004) Zostera marina in Venice lagoon: a genetic study, Rapports et Proces-Ver- baux des Réunions Commission International pour l'Ex- ploration Scientifique de la Mer Méditerranée, 37, 536. [37] Diviacco, G., Spada, E. and Virno Lamberti, C. (2001) Le Fanerogame marine del Lazio, Descrizione e Cartografia delle prateria di Posidonia oceanica e dei prati di Cym- odocea nodosa, Roma: ICRAM. [38] ARPA Lazio. (2007) Quarto rapporto sulla qualità delle acque superficiali e sotterranee della Provincia di Roma, 2011. http://www.arpalazio.it/dati2007/IV_rapportoAcqua.pdf. [39] Dante, G. (2010) Development of sustainable strategies for conservation and management of Posidonia oce- anica,(Linneo) Delile 1813, meadow: a case study within a site of community importance, Ph.D. dissertation, Uni- versity of Tuscia, Viterbo (Italy), 2011. http://dspace.unitus.it/bistream/2067/996/1/gdante_tesid. pdf. [40] Rotini, A., Anello, L., Di Bernardo, M., Giallongo, A. and Migliore, L. (2011) A monitoring study of a Posido- nia oceanica meadow coupling total phenol content and 2-D electrophoresis pattern of proteins, Aquatic Botany, Submitted. [41] Giraud, G. (1977) Essai de classement des herbiers de- Posidonia oceanica (L.) Delile. Botanica Marina, 20, 487-491. doi:10.1515/botm.1977.20.8.487 [42] Pergent, G. (1990) Lepidochronological analysis of the seagrass Posidonia oceanica (L.) Delile: a standardized- approach. Aquatic Botany, 37, 39-54. doi:10.1016/0304-3770(90)90063-Q [43] Legrand, B. (1977) Action de la lumière sur les peroxy- dases et sur les teneurs en composés phénoliques de tis- sus de feuilles de Cichorium intybus L. cultivés in vitro. Biologia Plantarum, 19, 27-33. [44] Booker, F.L. and Miller, J.E. (1998) Phenylpropanoid metabolim and phenolic composition of soybean (Gly- cine max L.) leaves following exposure to ozone. Journal of Experimental Botany, 49, 1191-1202. doi:10.1093/jexbot/49.324.1191 [45] Dellaporta, S.L., Wood, J. and Hicks, J.B. (1983) A plant DNA mini preparation: version II. Plant Molecular Bi- ology Reporter, 1, 19-21. doi:10.1007/BF02712670 [46] Buia, M.C., Gambi, M.C. and Dappiano, M. (2004) The seagrass ecosystems, Gambi, M.C., Dappiano, M., Eds., Mediterranean Marine Benthos: a manual for its sam- pling and study, Biologia Marina Mediterranea, 11, 133-183. [47] Pergent, G., Pergent-Martini, C. and Boudouresque, C.F. (1995) Utilisation de l’herbier à Posidonia oceanica comme indicateur biologique de la qualité du milieu lit- toral en Méditerranée: état de connaissances, Mésogée, 54, 3-27. [48] Drew, E.A. (1971) Underwater Science. An introduction to experiments by divers, In: Woods, J.D., Lithgoe, J.N., Eds., Botany, Academic Press, London, 175-233. [49] Borg, J.A. and Schembri, P.J. (1995) Preliminary data on bathymetric and temporal changes in the morphology of a maltese Posidonia oceanica (L.) Delile meadow, Rap- ports et Proces-Verbaux des Réunions Commission In- ternational pour l’Exploration Scientifique de la Mer Méditerranée, 34, 20. [50] Gobert, S., Kyramarios, M., Lepoint, G., Pergent-Martini, C. and Bouquegneau J.M. (2003) Variation à différents échelles spatiales de l’harbier à Posidonia oceanica (L.) Delile; effects sur les paramètres physico-chimiques du sediment. Oceanologica Acta, 26, 199-207. doi:10.1016/S0399-1784(02)00009-9 [51] Pergent, G. and Pergent-Martini, C. (1988) Phenologie de Posidonia oceanica (Linnaeus) Delile dans le bassin méditerranéen. Annales de l’Institut Océanographique Paris, 64, 79-100. [52] Diviacco, G. and Coppo, S. (2007) Atlante degli habitat marini della Liguria: descrizione e cartografia delle praterie di Posidonia oceanica e dei principali popola- menti marini costieri, Edizioni Grafiche Amadeo, Im- peria. [53] Peirano, A. and Bianchi, C.N. (1997) Decline of the sea- grass Posidonia oceanica in response to environmental disturbance: a simulation-like approach off Liguria (NW Mediterranean Sea), The Response of marine organisms to their environments, University of Southampton, U.K, 87-95. [54] Adams, S.M. (2003) Establishing causality between en- vironmental stressors and effects on aquatic ecosystems. Human and Ecological Risk Assessment, 9, 17-35. doi:10.1080/713609850 [55] Chapman, P.M., McDonald, B.G., and Lawrence, G. S. (2002) Weight-of-evidence issues and frameworks for sediment quality (and other) assessments. Human and Ecological Risk Assessment, 8, 1489-1515. doi:10.1080/20028091057457 [56] Sanz-Lázaro, C., and Marin, A. (2009) A manipulative field experiment to evaluate an integrative methodology for assessing sediment pollution in estuarine ecosystems. Science of the Total Environment, 407, 3510-3535.
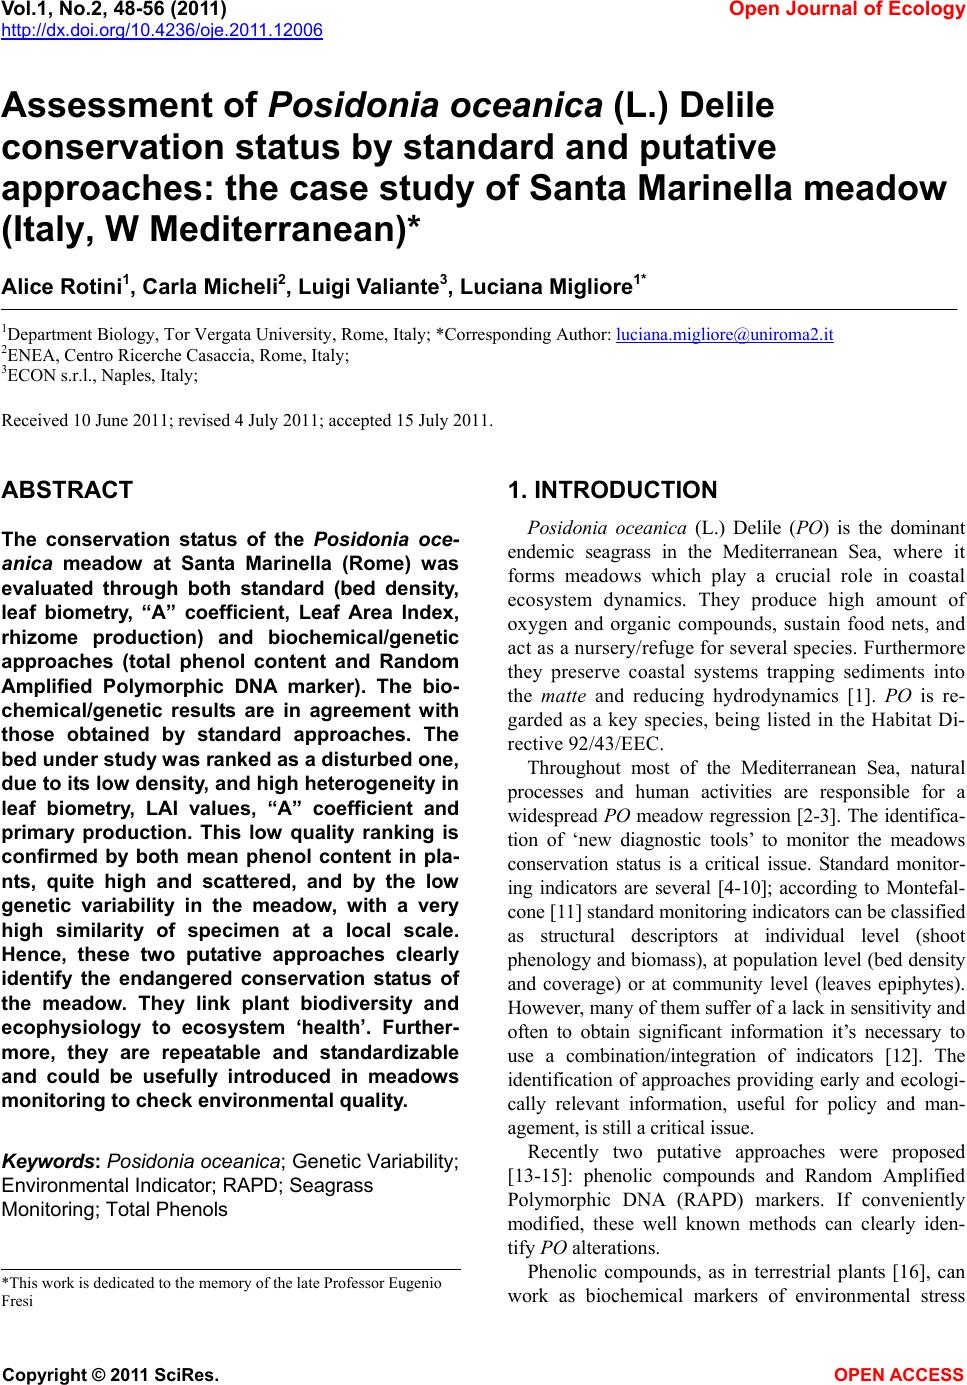
|