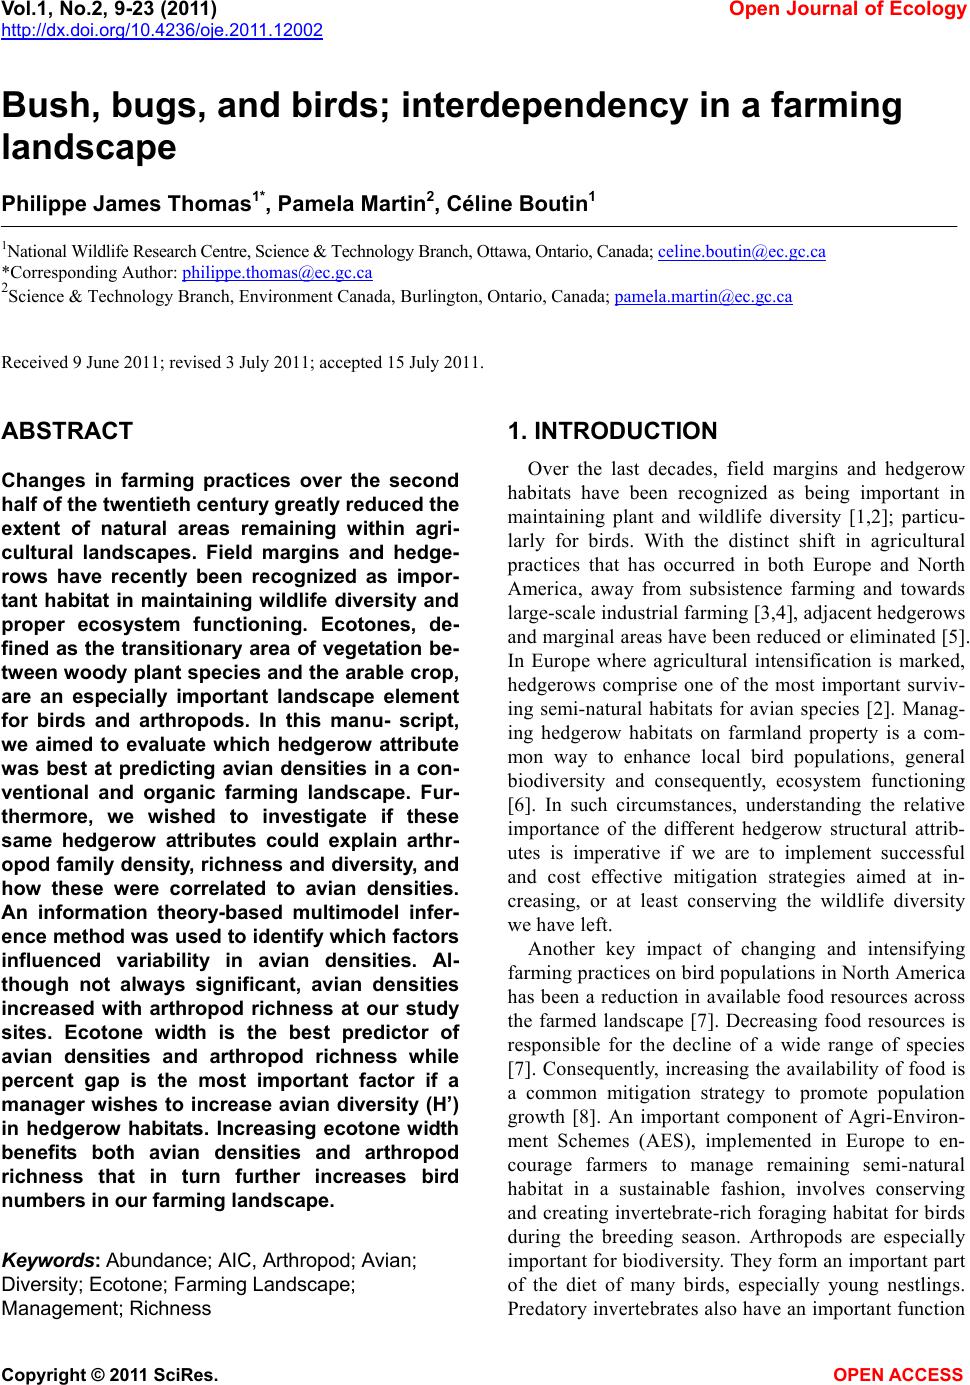
 Vol.1, No.2, 9-23 (2011) http://dx.doi.org/10.4236/oje.2011.12002 Open Journal of Ecolog y Copyright © 2011 SciRes. OPEN A CCESS Bush, bugs, and birds; interdependency in a farming landscape Philippe James Thomas1*, Pamela Martin2, Céline Boutin1 1National Wildlife Research Centre, Science & Technology Branch, Ottawa, Ontario, Canada; celine.boutin@ec.gc.ca *Corresponding Author: philippe.thomas@ec.gc.ca 2Science & Technology Branch, Environment Canada, Burlington, Ontario, Canada; pamela.martin@ec.gc.ca Received 9 June 2011; revised 3 July 2011; accepted 15 July 2011. ABSTRACT Changes in farming practices over the second half of the twentieth century greatly reduced the extent of natural areas remaining within agri- cultural landscapes. Field margins and hedge- rows have recently been recognized as impor- tant habitat in maintaining wildlife diversity and proper ecosystem functioning. Ecotones, de- fined as the transitionary area of vegetation be- tween w oody plant species and the arable crop, are an especially important landscape element for birds and arthropods. In this manu- script, we aimed to evaluate which hedgerow attribute was best at predicting avian densities in a con- ventional and organic farming landscape. Fur- thermore, we wished to investigate if these same hedgerow attributes could explain arthr- opod family density, richness and diversity, and how these were correlated to avian densities. An information theory-based multimodel infer- ence method was used to identify which factors influenced variability in avian densities. Al- though not always significant, avian densities increased with arthropod richness at our study sites. Ecotone width is the best predictor of avian densities and arthropod richness while percent gap is the most important factor if a manager wishes to increase avian diversity (H’) in hedgerow habitats. Increasing ecotone width benefits both avian densities and arthropod richness that in turn further increases bird numbers in our farming landscape. Keywords: Abundance; AIC, Arthropod; Avian; Diversity; Ecotone; Farming Landscape; Management; Rich ness 1. INTRODUCTION Over the last decades, field margins and hedgerow habitats have been recognized as being important in maintaining plant and wildlife diversity [1,2]; particu- larly for birds. With the distinct shift in agricultural practices that has occurred in both Europe and North America, away from subsistence farming and towards large-scale industrial farming [3,4], adjacent hedgerows and marginal areas have been reduced or eliminated [5]. In Europe where agricultural intensification is marked, hedgerows comprise one of the most important surviv- ing semi-natural habitats for avian species [2]. Manag- ing hedgerow habitats on farmland property is a com- mon way to enhance local bird populations, general biodiversity and consequently, ecosystem functioning [6]. In such circumstances, understanding the relative importance of the different hedgerow structural attrib- utes is imperative if we are to implement successful and cost effective mitigation strategies aimed at in- creasing, or at least conserving the wildlife diversity we have left. Another key impact of changing and intensifying farming practices on bird populations in North America has been a reduction in available food resources across the farmed landscape [7]. Decreasing food resources is responsible for the decline of a wide range of species [7]. Consequently, increasing the availability of food is a common mitigation strategy to promote population growth [8]. An important component of Agri-Environ- ment Schemes (AES), implemented in Europe to en- courage farmers to manage remaining semi-natural habitat in a sustainable fashion, involves conserving and creating invertebrate-rich foraging habitat for birds during the breeding season. Arthropods are especially important for biodiversity. They form an important part of the diet of many birds, especially young nestlings. Predatory invertebrates also have an important function 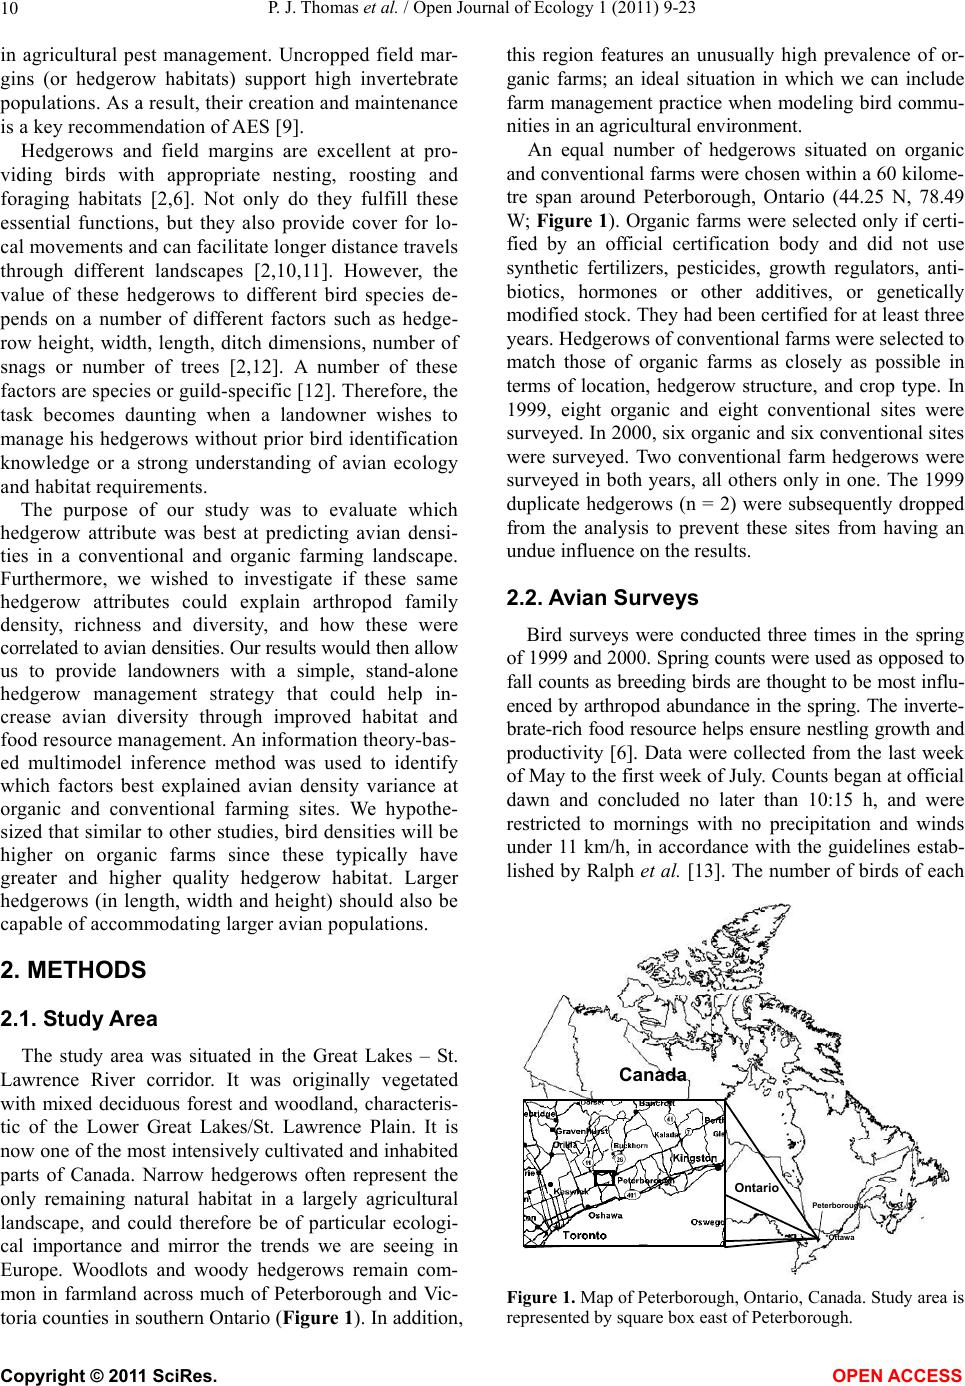 P. J. Thomas et al. / Open Journal of Ecology 1 (2011) 9-23 10 in agricultural pest management. Uncropped field mar- gins (or hedgerow habitats) support high invertebrate populations. As a result, their creation and maintenance is a key recommendation of AES [9]. Hedgerows and field margins are excellent at pro- viding birds with appropriate nesting, roosting and foraging habitats [2,6]. Not only do they fulfill these essential functions, but they also provide cover for lo- cal movements and can facilitate longer distance travels through different landscapes [2,10,11]. However, the value of these hedgerows to different bird species de- pends on a number of different factors such as hedge- row height, width, length, ditch dimensions, number of snags or number of trees [2,12]. A number of these factors are species or guild-specific [12]. Therefore, the task becomes daunting when a landowner wishes to manage his hedgerows without prior bird identification knowledge or a strong understanding of avian ecology and habitat requirements. The purpose of our study was to evaluate which hedgerow attribute was best at predicting avian densi- ties in a conventional and organic farming landscape. Furthermore, we wished to investigate if these same hedgerow attributes could explain arthropod family density, richness and diversity, and how these were correlated to avian densities. Our results would then allow us to provide landowners with a simple, stand-alone hedgerow management strategy that could help in- crease avian diversity through improved habitat and food resource management. An information theory-bas- ed multimodel inference method was used to identify which factors best explained avian density variance at organic and conventional farming sites. We hypothe- sized that similar to other studies, bird densities will be higher on organic farms since these typically have greater and higher quality hedgerow habitat. Larger hedgerows (in length, width and height) should also be capable of accommodating larger avian populations. 2. METHODS 2.1. Study Area The study area was situated in the Great Lakes – St. Lawrence River corridor. It was originally vegetated with mixed deciduous forest and woodland, characteris- tic of the Lower Great Lakes/St. Lawrence Plain. It is now one of the most intensively cultivated and inhabited parts of Canada. Narrow hedgerows often represent the only remaining natural habitat in a largely agricultural landscape, and could therefore be of particular ecologi- cal importance and mirror the trends we are seeing in Europe. Woodlots and woody hedgerows remain com- mon in farmland across much of Peterborough and Vic- toria counties in southern Ontario (Figure 1). In addition, this region features an unusually high prevalence of or- ganic farms; an ideal situation in which we can include farm management practice when modeling bird commu- nities in an agricultural environment. An equal number of hedgerows situated on organic and conventional farms were chosen within a 60 kilome- tre span around Peterborough, Ontario (44.25 N, 78.49 W; Figure 1). Organic farms were selected only if certi- fied by an official certification body and did not use synthetic fertilizers, pesticides, growth regulators, anti- biotics, hormones or other additives, or genetically modified stock. They had been certified for at least three years. Hedgerows of conventional farms were selected to match those of organic farms as closely as possible in terms of location, hedgerow structure, and crop type. In 1999, eight organic and eight conventional sites were surveyed. In 2000, six organic and six conventional sites were surveyed. Two conventional farm hedgerows were surveyed in both years, all others only in one. The 1999 duplicate hedgerows (n = 2) were subsequently dropped from the analysis to prevent these sites from having an undue influence on the results. 2.2. A vian Surveys Bird surveys were conducted three times in the spring of 1999 and 2000. Spring counts were used as opposed to fall counts as breeding birds are thought to be most influ- enced by arthropod abundance in the spring. The inverte- brate-rich food resource helps ensure nestling growth and productivity [6]. Data were collected from the last week of May to the first week of July. Counts began at official dawn and concluded no later than 10:15 h, and were restricted to mornings with no precipitation and winds under 11 km/h, in accordance with the guidelines estab- lished by Ralph et al. [13]. The number of birds of each Canada Ontario *Ottawa Peterborough Canada Ontario *Ottawa Peterborough Canada Ontario *Ottawa Peterborough Figure 1. Map of Peterborough, Ontario, Canada. Study area is represented by square box east of Peterborough. Copyright © 2011 SciRes. OPEN A CCESS 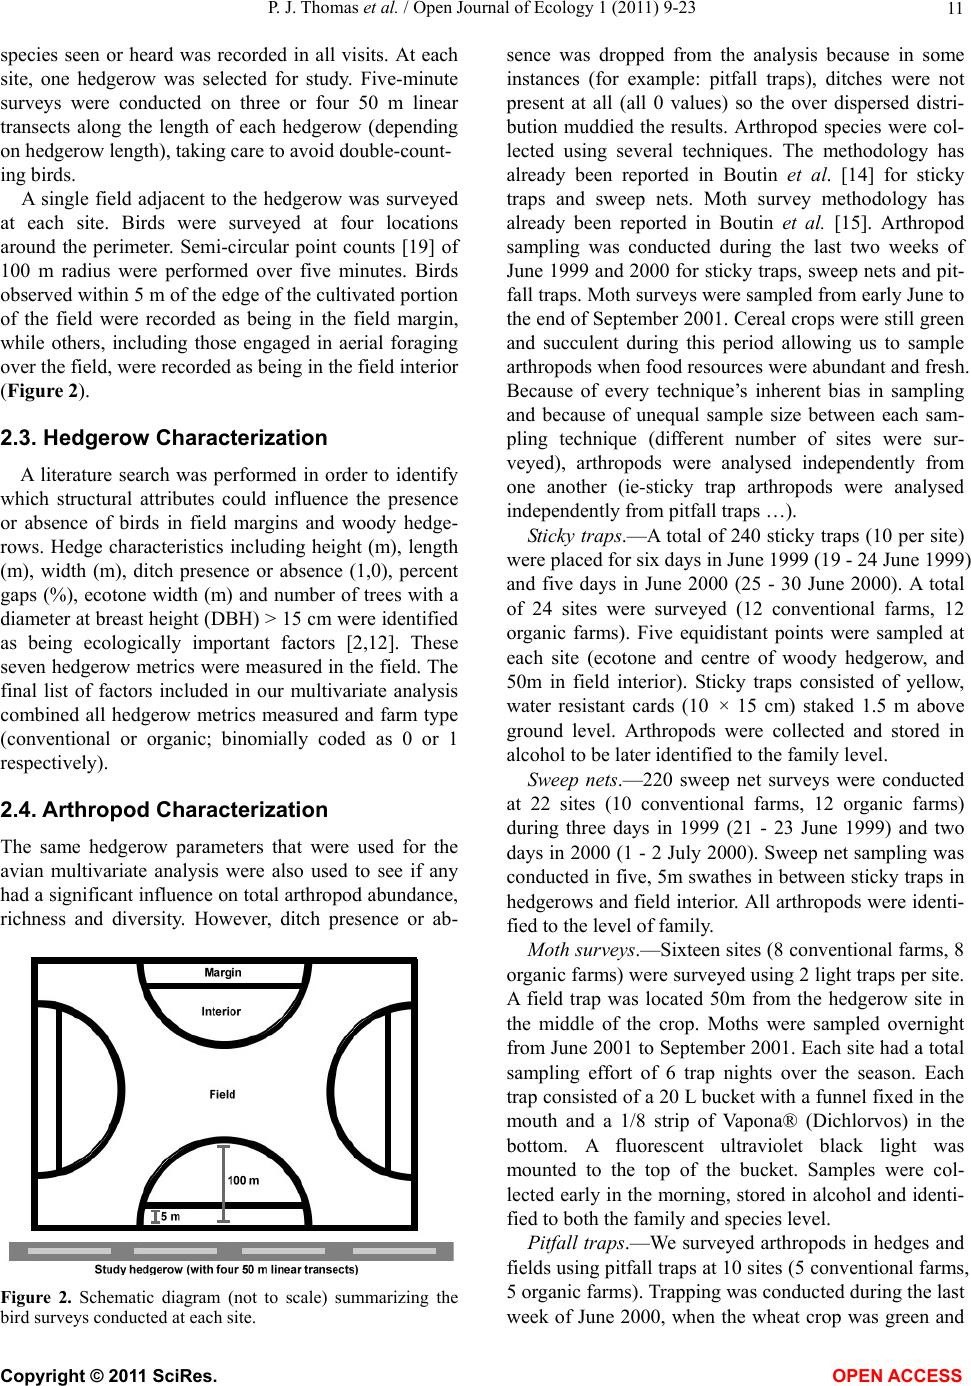 P. J. Thomas et al. / Open Journal of Ecology 1 (2011) 9-23 11 species seen or heard was recorded in all visits. At each site, one hedgerow was selected for study. Five-minute surveys were conducted on three or four 50 m linear transects along the length of each hedgerow (depending on hedgerow length), taking care to avoid double-count- ing birds. A single field adjacent to the hedgerow was surveyed at each site. Birds were surveyed at four locations around the perimeter. Semi-circular point counts [19] of 100 m radius were performed over five minutes. Birds observed within 5 m of the edge of the cultivated portion of the field were recorded as being in the field margin, while others, including those engaged in aerial foraging over the field, were recorded as being in the field interior (Figure 2). 2.3. Hedgerow Characterization A literature search was performed in order to identify which structural attributes could influence the presence or absence of birds in field margins and woody hedge- rows. Hedge characteristics including height (m), length (m), width (m), ditch presence or absence (1,0), percent gaps (%), ecotone width (m) and number of trees with a diameter at breast height (DBH) > 15 cm were identified as being ecologically important factors [2,12]. These seven hedgerow metrics were measured in the field. The final list of factors included in our multivariate analysis combined all hedgerow metrics measured and farm type (conventional or organic; binomially coded as 0 or 1 respectively). 2.4. Arthropod Characterization The same hedgerow parameters that were used for the avian multivariate analysis were also used to see if any had a significant influence on total arthropod abundance, richness and diversity. However, ditch presence or ab- Figure 2. Schematic diagram (not to scale) summarizing the bird surveys conducted at each site. sence was dropped from the analysis because in some instances (for example: pitfall traps), ditches were not present at all (all 0 values) so the over dispersed distri- bution muddied the results. Arthropod species were col- lected using several techniques. The methodology has already been reported in Boutin et al. [14] for sticky traps and sweep nets. Moth survey methodology has already been reported in Boutin et al. [15]. Arthropod sampling was conducted during the last two weeks of June 1999 and 2000 for sticky traps, sweep nets and pit- fall traps. Moth surveys were sampled from early June to the end of September 2001. Cereal crops were still green and succulent during this period allowing us to sample arthropods when food resources were abundant and fresh. Because of every technique’s inherent bias in sampling and because of unequal sample size between each sam- pling technique (different number of sites were sur- veyed), arthropods were analysed independently from one another (ie-sticky trap arthropods were analysed independently from pitfall traps …). Sticky traps.—A total of 240 sticky traps (10 per site) were placed for six days in June 1999 (19 - 24 June 1999) and five days in June 2000 (25 - 30 June 2000). A total of 24 sites were surveyed (12 conventional farms, 12 organic farms). Five equidistant points were sampled at each site (ecotone and centre of woody hedgerow, and 50m in field interior). Sticky traps consisted of yellow, water resistant cards (10 × 15 cm) staked 1.5 m above ground level. Arthropods were collected and stored in alcohol to be later identified to the family level. Sweep nets.—220 sweep net surveys were conducted at 22 sites (10 conventional farms, 12 organic farms) during three days in 1999 (21 - 23 June 1999) and two days in 2000 (1 - 2 July 2000). Sweep net sampling was conducted in five, 5m swathes in between sticky traps in hedgerows and field interior. All arthropods were identi- fied to the level of family. Moth surveys.—Sixteen sites (8 conventional farms, 8 organic farms) were surveyed using 2 light traps per site. A field trap was located 50m from the hedgerow site in the middle of the crop. Moths were sampled overnight from June 2001 to September 2001. Each site had a total sampling effort of 6 trap nights over the season. Each trap consisted of a 20 L bucket with a funnel fixed in the mouth and a 1/8 strip of Vapona® (Dichlorvos) in the bottom. A fluorescent ultraviolet black light was mounted to the top of the bucket. Samples were col- lected early in the morning, stored in alcohol and identi- fied to both the family and species level. Pitfall traps.—We surveyed arthropods in hedges and fields using pitfall traps at 10 sites (5 conventional farms, 5 organic farms). Trapping was conducted during the last week of June 2000, when the wheat crop was green and Copyright © 2011 SciRes. OPEN A CCESS  P. J. Thomas et al. / Open Journal of Ecology 1 (2011) 9-23 12 immature. At each location, five equidistant sampling sites were selected along the length of the chosen hedgerow. Hedge sites were located as close as possible to the centre of the width of the hedge and field interior sites were 25 m into the field from the edge of the hedgerow. At each of these sampling sites, we positioned a pitfall trap. Pitfall traps consisted of a one litre plastic container filled with 500 ml of water and 10 ml of Photoflo, a photographic cleanser added to reduce surface tension of the water in the trap. Traps were dug into the soil such that the lip of the trap was at the surface of the soil; traps remained open for three days and were collected at that time. Following collection, arthropod specimens were labelled in plastic bags and frozen pending identification. Specimens were identified to the family level. Common sticky trap, sweep net, moth survey and pit- fall trapping sites were matched to avian survey sites for analysis after pooling the data by sampling technique. 2.5. Data Analysis Bird counts were summed at each site (field, margin and woody hedgerow), our three spring censuses were averaged and density was expressed as the number of birds per hectare (no. birds/ha). T-tests were used to evaluate differences between conventional and organic farming sites. Because of a high degree of variation in bird densities, significance was set at α = 0.1 level. Kol- mogorov-Smirnov tests and Kernel density plots were used to confirm the normality of the data. If a Folded F-test indicated a significant difference in the two vari- ances, the Satterthwaite method was used to compute the p-value. If variances were found to be homogenous, the pooled t statistic was used. Furthermore, since bird densities were derived from count data, generalized linear models were employed. Depending on the distribution of the count data, one can fit either Negative Binomial Regression Models (NBRM) or Poisson Regression Models (PRM). PRM models are however not recommended as they do not take into ac- count over-dispersion of the data, or in our case, the ex- tremely high frequency of zero counts [20]. Since NBRM models tend to under-predict the occurrence of zero counts, we opted for a zero-inflated version of the Poisson model (ZIP) to accurately account for the high frequency of zero counts. The presence of colinearirty was investigated using variance inflation factors (VIF) and was found to be non-existent. All statistics were completed using SAS version 9.2 TS Level 2M0. Models.—All possible subset of models were tested for the eight hedgerow factors. By using the information theoretic model comparison (ITMC) technique, an Akaike’s Information Criterion (AIC) value for each model was calculated from the log likelihoods obtained from fitting the ZIP regressions. In lieu of using the standard AIC, we used the small-sample bias correction form (AICc) which has been shown to converge to the standard AIC value as you increase sample size [21]. The formula to calculate AICc is: c K1 AIC2LL2K2K nK1 (1) where: LL = log likelihood, K = # of parameters and n = sample size. Since the actual AICc value is less important than the change in the AICc value between different models, the difference, or Δi, between the best model (lowest AICc value) and model i was calculated. The “best” model will have a delta AICc equal to 0 [21]. This value repre- sents the information lost if modeli was used instead of the “best” model. Anderson et al. [17] stipulate that as a general rule of thumb, if Δi < 2, the models compared are too similar to be ranked by the AICc value (or Δi) and the most parsimonious model should be selected. How- ever, Guthery et al. [18] cautioned that from a biological standpoint, especially in the field of conservation biol- ogy, being able to statistically unravel the “best” model is not the most important result. It is the model’s predic- tive ability that will determine how it will hold up against what is happening in “real world” situations. Thus, it is necessary to cross-validate the models, and also consider parsimonious models against a stronger model that includes additional variables. In our situation, we investigated the top three models ranked according to their ΔAICc values regardless of whether its ΔAICc ex- ceeded the 2.0 cut off. 2.6. Diversity Index Shannon-Diversity index were calculated for every conventional and organic site using the total number of birds detected in fields, margins and hedgerows (pooled species density). Similar to the above AIC analysis, Shannon-Diversity indexes were analyzed to uncover which structural hedgerow metric accounted for most of the variance in the dataset. An identical diversity index analysis was conducted for pooled sticky trap, pitfall trap, sweep net and moth survey arthropods independ- ently but using family level information. 3. RESULTS 3.1. Organic and Conventional Farming Avian Densities When considering avian species density (no. birds/ha) at conventional and organic farms calculated for the Copyright © 2011 SciRes. OPEN A CCESS 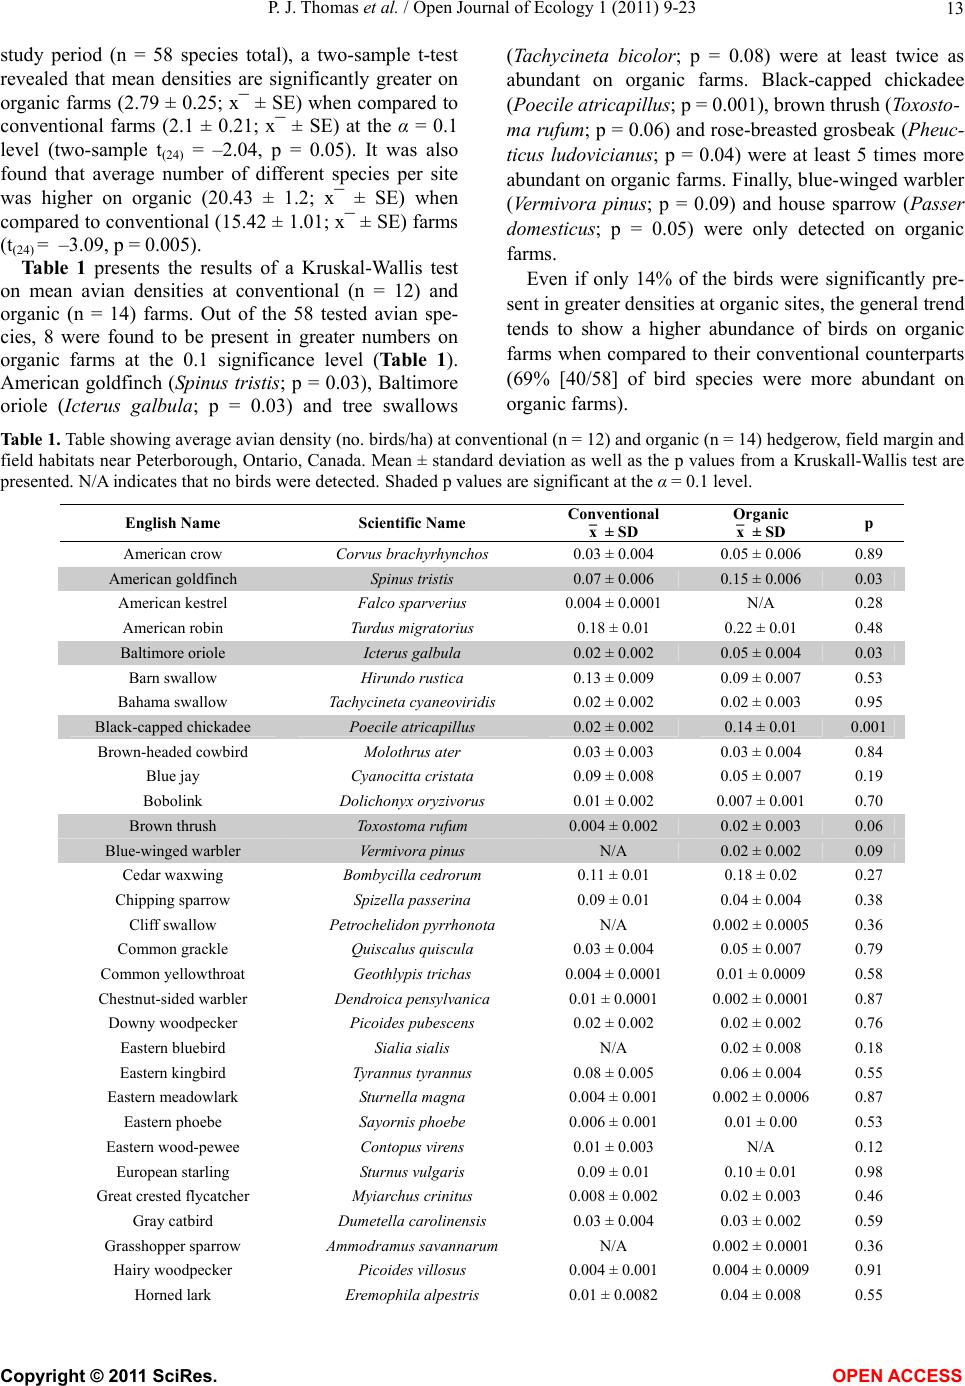 P. J. Thomas et al. / Open Journal of Ecology 1 (2011) 9-23 Copyright © 2011 SciRes. 13 OPEN ACCESS Organic study period (n = 58 species total), a two-sample t-test revealed that mean densities are significantly greater on organic farms (2.79 ± 0.25; x¯ ± SE) when compared to conventional farms (2.1 ± 0.21; x¯ ± SE) at the α = 0.1 level (two-sample t(24) = –2.04, p = 0.05). It was also found that average number of different species per site was higher on organic (20.43 ± 1.2; x¯ ± SE) when compared to conventional (15.42 ± 1.01; x¯ ± SE) farms (t(24) = –3.09, p = 0.005). Table 1 presents the results of a Kruskal-Wallis test on mean avian densities at conventional (n = 12) and organic (n = 14) farms. Out of the 58 tested avian spe- cies, 8 were found to be present in greater numbers on organic farms at the 0.1 significance level (Table 1). American goldfinch (Spinus tristis; p = 0.03), Baltimore oriole (Icterus galbula; p = 0.03) and tree swallows (Tachycineta bicolor; p = 0.08) were at least twice as abundant on organic farms. Black-capped chickadee (Poecile atricapillus; p = 0.001), brown thrush (Toxosto- ma rufum; p = 0.06) and rose-breasted grosbeak (Pheuc- ticus ludovicianus; p = 0.04) were at least 5 times more abundant on organic farms. Finally, blue-winged warbler (Vermivora pinus; p = 0.09) and house sparrow (Passer domesticus; p = 0.05) were only detected on organic farms. Even if only 14% of the birds were significantly pre- sent in greater densities at organic sites, the general trend tends to show a higher abundance of birds on organic farms when compared to their conventional counterparts (69% [40/58] of bird species were more abundant on organic farms). Table 1. Table showing average avian density (no. birds/ha) at conventional (n = 12) and organic (n = 14) hedgerow, field margin and field habitats near Peterborough, Ontario, Canada. Mean ± standard deviation as well as the p values from a Kruskall-Wallis test are presented. N/A indicates that no birds were detected. Shaded p values are significant at the α = 0.1 level. English Name Scientific Name Conventional x¯ ± SD x¯ ± SD p American crow Corvus brachyrhynchos 0.03 ± 0.004 0.05 ± 0.006 0.89 American goldfinch Spinus tristis 0.07 ± 0.006 0.15 ± 0.006 0.03 American kestrel Falco sparverius 0.004 ± 0.0001 N/A 0.28 American robin Turdus migratorius 0.18 ± 0.01 0.22 ± 0.01 0.48 Baltimore oriole Icterus galbula 0.02 ± 0.002 0.05 ± 0.004 0.03 Barn swallow Hirundo rustica 0.13 ± 0.009 0.09 ± 0.007 0.53 Bahama swallow Tachycineta cyaneoviridis 0.02 ± 0.002 0.02 ± 0.003 0.95 Black-capped chickadee Poecile atricapillus 0.02 ± 0.002 0.14 ± 0.01 0.001 Brown-headed cowbird Molothrus ater 0.03 ± 0.003 0.03 ± 0.004 0.84 Blue jay Cyanocitta cristata 0.09 ± 0.008 0.05 ± 0.007 0.19 Bobolink Dolichonyx oryzivorus 0.01 ± 0.002 0.007 ± 0.001 0.70 Brown thrush Toxostoma rufum 0.004 ± 0.002 0.02 ± 0.003 0.06 Blue-winged warbler Vermivora pinus N/A 0.02 ± 0.002 0.09 Cedar waxwing Bombycilla cedrorum 0.11 ± 0.01 0.18 ± 0.02 0.27 Chipping sparrow Spizella passerina 0.09 ± 0.01 0.04 ± 0.004 0.38 Cliff swallow Petrochelidon pyrrhonota N/A 0.002 ± 0.0005 0.36 Common grackle Quiscalus quiscula 0.03 ± 0.004 0.05 ± 0.007 0.79 Common yellowthroat Geothlypis trichas 0.004 ± 0.0001 0.01 ± 0.0009 0.58 Chestnut-sided warbler Dendroica pensylvanica 0.01 ± 0.0001 0.002 ± 0.0001 0.87 Downy woodpecker Picoides pubescens 0.02 ± 0.002 0.02 ± 0.002 0.76 Eastern bluebird Sialia sialis N/A 0.02 ± 0.008 0.18 Eastern kingbird Tyrannus tyrannus 0.08 ± 0.005 0.06 ± 0.004 0.55 Eastern meadowlark Sturnella magna 0.004 ± 0.001 0.002 ± 0.0006 0.87 Eastern phoebe Sayornis phoebe 0.006 ± 0.001 0.01 ± 0.00 0.53 Eastern wood-pewee Contopus virens 0.01 ± 0.003 N/A 0.12 European starling Sturnus vulgaris 0.09 ± 0.01 0.10 ± 0.01 0.98 Great crested flycatcher Myiarchus crinitus 0.008 ± 0.002 0.02 ± 0.003 0.46 Gray catbird Dumetella carolinensis 0.03 ± 0.004 0.03 ± 0.002 0.59 Grasshopper sparrow Ammodramus savannarum N/A 0.002 ± 0.0001 0.36 Hairy woodpecker Picoides villosus 0.004 ± 0.001 0.004 ± 0.0009 0.91 Horned lark Eremophila alpestris 0.01 ± 0.0082 0.04 ± 0.008 0.55 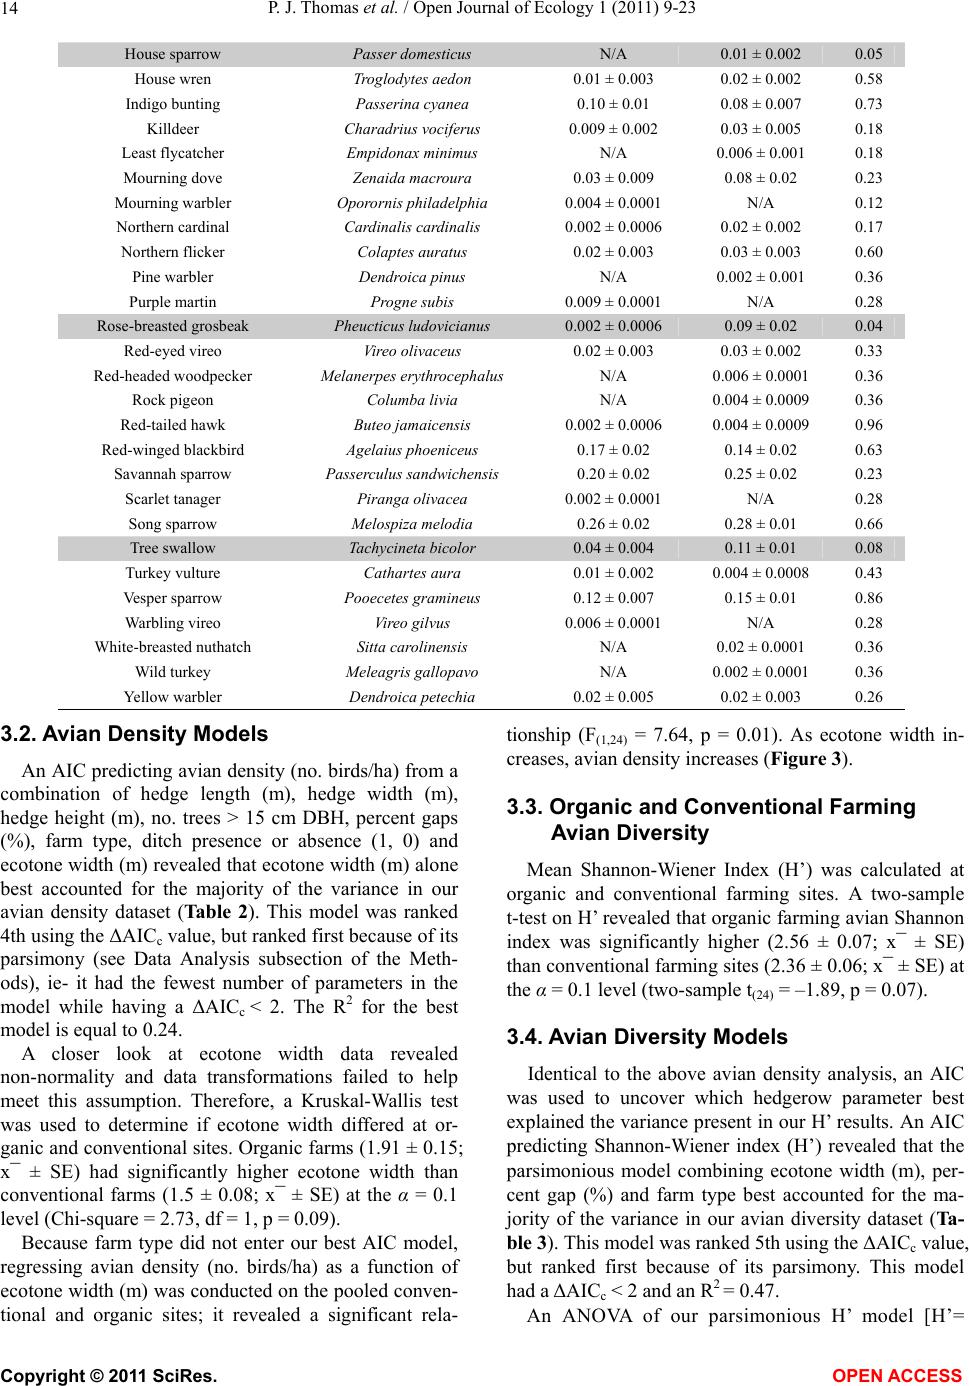 P. J. Thomas et al. / Open Journal of Ecology 1 (2011) 9-23 14 House sparrow Passer domesticus N/A 0.01 ± 0.002 0.05 House wren Troglodytes aedon 0.01 ± 0.003 0.02 ± 0.002 0.58 Indigo bunting Passerina cyanea 0.10 ± 0.01 0.08 ± 0.007 0.73 Killdeer Charadrius vociferus 0.009 ± 0.002 0.03 ± 0.005 0.18 Least flycatcher Empidonax minimus N/A 0.006 ± 0.001 0.18 Mourning dove Zenaida macroura 0.03 ± 0.009 0.08 ± 0.02 0.23 Mourning warbler Oporornis philadelphia 0.004 ± 0.0001 N/A 0.12 Northern cardinal Cardinalis cardinalis 0.002 ± 0.0006 0.02 ± 0.002 0.17 Northern flicker Colaptes auratus 0.02 ± 0.003 0.03 ± 0.003 0.60 Pine warbler Dendroica pinus N/A 0.002 ± 0.001 0.36 Purple martin Progne subis 0.009 ± 0.0001 N/A 0.28 Rose-breasted grosbeak Pheucticus ludovicianus 0.002 ± 0.0006 0.09 ± 0.02 0.04 Red-eyed vireo Vireo olivaceus 0.02 ± 0.003 0.03 ± 0.002 0.33 Red-headed woodpecker Melanerpes erythrocephalus N/A 0.006 ± 0.0001 0.36 Rock pigeon Columba livia N/A 0.004 ± 0.0009 0.36 Red-tailed hawk Buteo jamaicensis 0.002 ± 0.0006 0.004 ± 0.0009 0.96 Red-winged blackbird Agelaius phoeniceus 0.17 ± 0.02 0.14 ± 0.02 0.63 Savannah sparrow Passerculus sandwichensis 0.20 ± 0.02 0.25 ± 0.02 0.23 Scarlet tanager Piranga olivacea 0.002 ± 0.0001 N/A 0.28 Song sparrow Melospiza melodia 0.26 ± 0.02 0.28 ± 0.01 0.66 Tree swallow Tachycineta bicolor 0.04 ± 0.004 0.11 ± 0.01 0.08 Turkey vulture Cathartes aura 0.01 ± 0.002 0.004 ± 0.0008 0.43 Vesper sparrow Pooecetes gramineus 0.12 ± 0.007 0.15 ± 0.01 0.86 Warbling vireo Vireo gilvus 0.006 ± 0.0001 N/A 0.28 White-breasted nuthatch Sitta carolinensis N/A 0.02 ± 0.0001 0.36 Wild turkey Meleagris gallopavo N/A 0.002 ± 0.0001 0.36 Yellow warbler Dendroica petechia 0.02 ± 0.005 0.02 ± 0.003 0.26 3.2. A vian Density Models An AIC predicting avian density (no. birds/ha) from a combination of hedge length (m), hedge width (m), hedge height (m), no. trees > 15 cm DBH, percent gaps (%), farm type, ditch presence or absence (1, 0) and ecotone width (m) revealed that ecotone width (m) alone best accounted for the majority of the variance in our avian density dataset (Table 2). This model was ranked 4th using the ΔAICc value, but ranked first because of its parsimony (see Data Analysis subsection of the Meth- ods), ie- it had the fewest number of parameters in the model while having a ΔAICc < 2. The R2 for the best model is equal to 0.24. A closer look at ecotone width data revealed non-normality and data transformations failed to help meet this assumption. Therefore, a Kruskal-Wallis test was used to determine if ecotone width differed at or- ganic and conventional sites. Organic farms (1.91 ± 0.15; x¯ ± SE) had significantly higher ecotone width than conventional farms (1.5 ± 0.08; x¯ ± SE) at the α = 0.1 level (Chi-square = 2.73, df = 1, p = 0.09). Because farm type did not enter our best AIC model, regressing avian density (no. birds/ha) as a function of ecotone width (m) was conducted on the pooled conven- tional and organic sites; it revealed a significant rela- tionship (F(1,24) = 7.64, p = 0.01). As ecotone width in- creases, avian density increases (Figure 3). 3.3. Organic and Conventional Farming Avian Diversity Mean Shannon-Wiener Index (H’) was calculated at organic and conventional farming sites. A two-sample t-test on H’ revealed that organic farming avian Shannon index was significantly higher (2.56 ± 0.07; x¯ ± SE) than conventional farming sites (2.36 ± 0.06; x¯ ± SE) at the α = 0.1 level (two-sample t(24) = –1.89, p = 0.07). 3.4. A vian Diversity Models Identical to the above avian density analysis, an AIC was used to uncover which hedgerow parameter best explained the variance present in our H’ results. An AIC predicting Shannon-Wiener index (H’) revealed that the parsimonious model combining ecotone width (m), per- cent gap (%) and farm type best accounted for the ma- jority of the variance in our avian diversity dataset (Ta- ble 3). This model was ranked 5th using the ΔAICc value, but ranked first because of its parsimony. This model had a ΔAICc < 2 and an R2 = 0.47. A n ANOVA of our parsimonious H’ model [H’= Copyright © 2011 SciRes. OPEN A CCESS 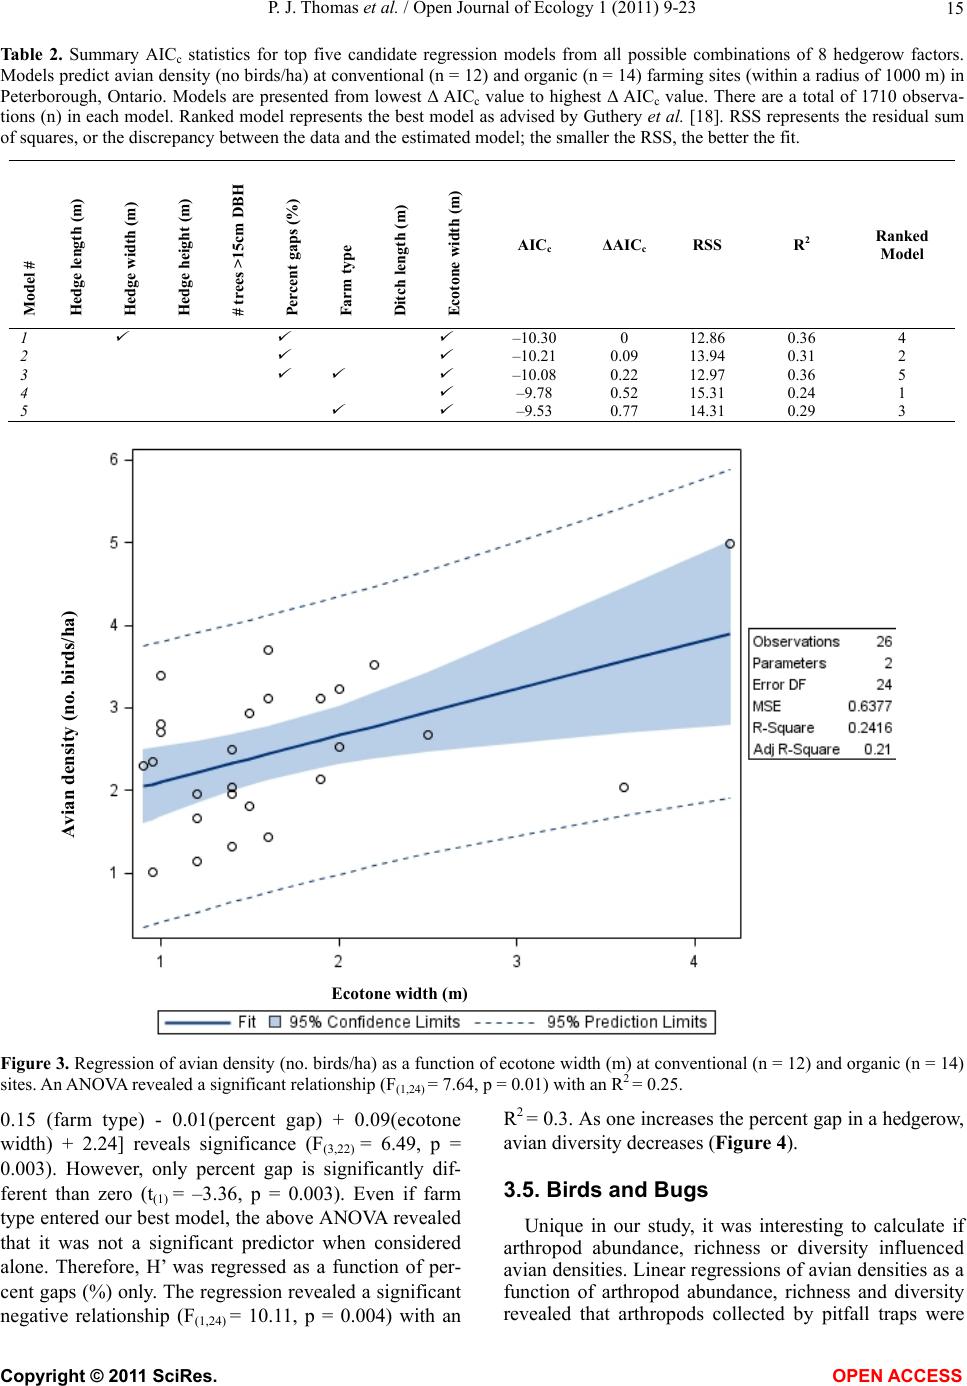 P. J. Thomas et al. / Open Journal of Ecology 1 (2011) 9-23 15 Table 2. Summary AICc statistics for top five candidate regression models from all possible combinations of 8 hedgerow factors. Models predict avian density (no birds/ha) at conventional (n = 12) and organic (n = 14) farming sites (within a radius of 1000 m) in Peterborough, Ontario. Models are presented from lowest Δ AICc value to highest Δ AICc value. There are a total of 1710 observa- tions (n) in each model. Ranked model represents the best model as advised by Guthery et al. [18]. RSS represents the residual sum of squares, or the discrepancy between the data and the estimated model; the smaller the RSS, the better the fit. Model # Hedge length (m) Hedge width (m) Hedge height (m) # trees >15cm DBH Percent gaps (%) Farm type Ditch length (m) Ecotone width (m) AICc ΔAICcRSS R2 Ranked Model 1 –10.30 0 12.86 0.36 4 2 –10.21 0.09 13.94 0.31 2 3 –10.08 0.22 12.97 0.36 5 4 –9.78 0.52 15.31 0.24 1 5 –9.53 0.77 14.31 0.29 3 Ecotone width m Avian densit no. birds/ha Figure 3. Regression of avian density (no. birds/ha) as a function of ecotone width (m) at conventional (n = 12) and organic (n = 14) sites. An ANOVA revealed a significant relationship (F(1,24) = 7.64, p = 0.01) with an R2 = 0.25. 0.15 (farm type) - 0.01(percent gap) + 0.09(ecotone width) + 2.24] reveals significance (F(3,22) = 6.49, p = 0.003). However, only percent gap is significantly dif- ferent than zero (t(1) = –3.36, p = 0.003). Even if farm type entered our best model, the above ANOVA revealed that it was not a significant predictor when considered alone. Therefore, H’ was regressed as a function of per- cent gaps (%) only. The regression revealed a significant negative relationship (F(1,24) = 10.11, p = 0.004) with an R2 = 0.3. As one increases the percent gap in a hedgerow, avian diversity decreases (Figure 4). 3.5. Birds and Bugs Unique in our study, it was interesting to calculate if arthropod abundance, richness or diversity influenced avian densities. Linear regressions of avian densities as a function of arthropod abundance, richness and diversity revealed that arthropods collected by pitfall traps were Copyright © 2011 SciRes. OPEN A CCESS 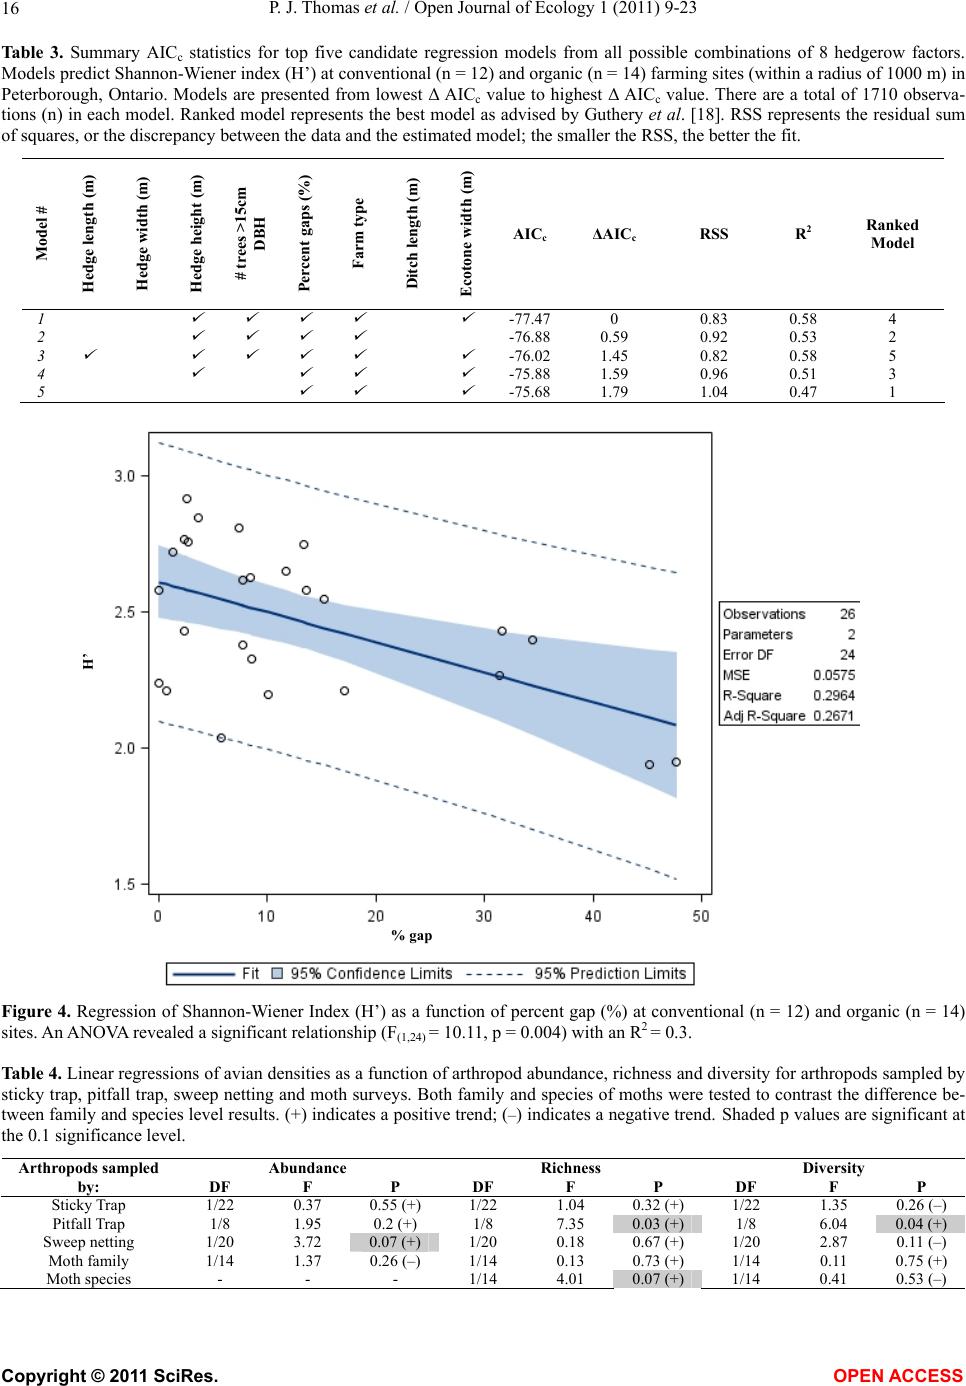 P. J. Thomas et al. / Open Journal of Ecology 1 (2011) 9-23 16 Table 3. Summary AICc statistics for top five candidate regression models from all possible combinations of 8 hedgerow factors. Models predict Shannon-Wiener index (H’) at conventional (n = 12) and organic (n = 14) farming sites (within a radius of 1000 m) in Peterborough, Ontario. Models are presented from lowest Δ AICc value to highest Δ AICc value. There are a total of 1710 observa- tions (n) in each model. Ranked model represents the best model as advised by Guthery et al. [18]. RSS represents the residual sum of squares, or the discrepancy between the data and the estimated model; the smaller the RSS, the better the fit. Model # Hedge length (m) Hedge width (m) Hedge height (m) # trees >15cm DBH Percent gaps (%) Farm type Ditch length (m) Ecotone width (m) AICc ΔAICc RSS R2 Ranked Model 1 -77.47 0 0.83 0.58 4 2 -76.88 0.59 0.92 0.53 2 3 -76.02 1.45 0.82 0.58 5 4 -75.88 1.59 0.96 0.51 3 5 -75.68 1.79 1.04 0.47 1 % gap H’ Figure 4. Regression of Shannon-Wiener Index (H’) as a function of percent gap (%) at conventional (n = 12) and organic (n = 14) sites. An ANOVA revealed a significant relationship (F(1,24) = 10.11, p = 0.004) with an R2 = 0.3. Table 4. Linear regressions of avian densities as a function of arthropod abundance, richness and diversity for arthropods sampled by sticky trap, pitfall trap, sweep netting and moth surveys. Both family and species of moths were tested to contrast the difference be- tween family and species level results. (+) indicates a positive trend; (–) indicates a negative trend. Shaded p values are significant at the 0.1 significance level. Abundance Richness Diversity Arthropods sampled by: DF F P DF F P DF F P Sticky Trap 1/22 0.37 0.55 (+) 1/22 1.04 0.32 (+) 1/22 1.35 0.26 (–) Pitfall Trap 1/8 1.95 0.2 (+) 1/8 7.35 0.03 (+) 1/8 6.04 0.04 (+) Sweep netting 1/20 3.72 0.07 (+) 1/20 0.18 0.67 (+) 1/20 2.87 0.11 (–) Moth family 1/14 1.37 0.26 (–) 1/14 0.13 0.73 (+) 1/14 0.11 0.75 (+) Moth species - - - 1/14 4.01 0.07 (+) 1/14 0.41 0.53 (–) Copyright © 2011 SciRes. OPEN A CCESS  P. J. Thomas et al. / Open Journal of Ecology 1 (2011) 9-23 17 most important to avian densities (Table 4). Furthermore, arthropod richness had the strongest p-values, was sig- nificant at the family level for pitfall traps, and at the species level for moths and was the only measure that consistently showed a positive trend (albeit, not always significant). Therefore, given the results, arthropod richness is selected as the strongest predictor of avian densities. Table 5 presents the results of a comparison of ar- thropod family richness at conventional and organic farming sites for those sampled by sticky trap, pitfall trap, sweep netting and moth surveys. In no instance did the richness at conventional and organic sites differ. 3.6. Arthropod Richness Models Similar to the avian models, an AIC predicting sticky trap, pitfall trap, sweep netting and moth survey arthro- pod richness (total no. families) from a combination of hedge length (m), hedge width (m), hedge height (m), no. trees > 15 cm DBH, percent gaps (%), farm type, and ecotone width (m) revealed that the only significant model was for sweep netting insects (Table 6). The top parsimonious sweep netting model combined 2 parame- ters, hedge length (m) and ecotone width (m). This model was ranked 1st using the ΔAICc value and was also the most parsimonious model. An ANOVA of our parsimonious sweep netting ar- thropod richness model [sweep family richness = –0.09 (hedge length) + 2.39 (ecotone width) + 37.65] reveals significance (F(2,19) = 4.17, p = 0.03) at the α = 0.1 level. The R2 value of the model is 0.31. Both factors were significant in the model (with p = 0.04) so they were graphed as a function of each other’s residuals to illus- trate the relationship. Regressing pooled arthropod richness residuals as a function of ecotone width (m) on the pooled conven- tional and organic sites revealed a significant and posi- tive relationship. As ecotone width increases, sweep net- ting arthropod richness increases (Figure 5a). On the other hand, as hedgerow length increases, sweep netting arthropod richness decreases (Figure 5b). Both R2 val- ues were equal at roughly 0.2. 4. DISCUSSION Our best models revealed some important factors in understanding the dynamic links between habitat, ar- thropod richness and avian density and diversity in an organic and conventional farming landscape. High ar- thropod family richness translates in higher avian densi- ties. Ecotone width is the best predictor of avian densi- ties and is an important factor influencing arthropod richness at conventional and organic farming sites while percent gap in hedgerows is the most important predictor of avian diversity (H’). 4.1. On Defining Ecotones In our study, we have used the term “ecotone” to de- Table 5. Species richness comparisons for arthropods sampled by sticky traps, pitfall traps, sweep netting and moth surveys. Mean ± standard error as well as the statistical results of a T-test is presented. Conventional Organic Arthropods sampled by: Mean ± SE Mean ± SE DF t P Sticky Trap 32.82 ± 1.72 32.31 ± 1.56 22 0.22 0.83 Pitfall Trap 15.2 ± 2.35 16.0 ± 2.77 8 –0.22 0.83 Sweep netting 23.0 ± 1.19 24.67 ± 1.6 20 –0.81 0.43 Moth Surveys 8.13 ± 0.35 8.5 ± 0.63 14 –0.52 0.61 Table 6. Multiple regression results of arthropod richness as a function of habitat parameters selected by AIC (only top models were tested for every sampling technique). Shaded p value is significant. AIC Model Parameter Arthropods sampled by: Hedge length (m) Hedge width (m) Hedge height (m) # trees >15cm DBH Percent gaps (%) Farm type Ecotone width (m) DF F Pr > F R2 Sticky Trap 1/22 0.53 0.48 0.02 Pitfall Trap 7/2 6.44 0.14 0.96 Sweep netting 2/19 4.17 0.03 0.31 Moth Surveys 1/14 1.63 0.22 0.1 Copyright © 2011 SciRes. OPEN A CCESS  P. J. Thomas et al. / Open Journal of Ecology 1 (2011) 9-23 18 fine the transitionary area of vegetation between woody plant species (characteristic of the centre of the hedge- row) and the arable crop. Ecotone is therefore consid- ered a synonym of the popularly used term “field mar- gin”. We have decided to stray from using “field margin” as we felt “ecotone” was more appropriate. The definition of ecotone includes certain ecological processes and assumptions that are otherwise missed when character- ising edge habitat as “field margin”. According to the Encyclopaedia Britannica, “ecotone” is defined as the “area of vegetation between two different plant commu- nities, such as forest and grassland. It has some of the characteristics of each bordering community and often contains species not found in the overlapping communi- ties” [22]. Our data supports this definition as a higher density and diversity of organisms (arthropods and birds) were present with increasingly large ecotone width. Even if the popular use of the term “ecotone” usually applies to the area of vegetation transition on a larger geographical scale, we felt it was as valid to use it at the smaller spa- tial scale our research was concerned with. 4.2. Importance of Ecotones to Bird Abundance Many of the breeding avian species observed used hedgerows for nesting, while foraging along ecotones. Very few used crop fields. In fact, a study by Douglas et al. [6] discussed the importance of maintaining and im- proving ecotones as foraging habitat for farmland birds. Others [23,24] stress the importance of maintaining nar- row habitat strips along the perimeter of agricultural areas in order to maintain a high abundance of bird spe- cies. To further improve avian densities in hedgerow habitat, in Europe, some farms have provided pesticide exclusion strips around the perimeter of fields, resulting in a noticeable increase in wildlife numbers with only a negligible decrease in arable area [25,26]. Twenty-six of 44 European countries have instituted agri-environment schemes that provide farmers with financial compensa- tion for loss of income associated with efforts to ecol- ogically improve their land [29]. As studies on the use of hedgerow and ecotone habitat by birds at conventional and organic farms have shown similar results across re- gions, it is expected that such measures would also be beneficial in North America. Conover et al. [16] found that bird abundance was up to 2 times greater in wider ecotones. Our study supports his findings. Similar to our results, he also found that bird diversity was not as influenced by ecotone width. Common with the recommendations brought forward by our findings, the authors recommend implementing wider field borders (or ecotones) that contribute substan- tially to grassland bird conservation measures in agri- cultural landscapes. The importance of ecotones cannot be understated. These field borders benefit avian populations year-round by providing nesting, foraging, roosting and movement corridors for many species [30-32]. Wider herbaceous ecotones adjacent to woody hedgerows further enhance avian benefits where bird abundance are typically ele- vated such as was the case at our avian-rich Peterbor- ough sites. Ecotone width is a particularly important factor as it most likely mitigates the vulnerability of cer- tain avian species to edge effects [33,34]. Wider ecotones also provide habitat farther from wooded areas which can benefit grassland birds that select for edges and those that avoid this habitat type [35]. We have presented evidence that there exist differ- ences in avian densities and richness at conventional and organic farms supporting findings presented by Shuttler et al. [27]. Since ecotone width was also significantly higher on organic farms, we found convincing support that greater avian densities might not be correlated to agricultural management as much as ecotone width. In fact, agricultural management did not enter our best model and this could be attributed to the nature of the landscape. In a paper published by Chamberlain et al. [28], the authors found that on average, 25% more birds were found on organic farms but that only some individual species were significantly more abundant. In a North American context, especially at our study area (Peter- borough, Ontario), few recently established (3 - 8 years old) organic farms were interspersed amongst well-established conventional farms. As a result, organi- cally managed farmland differed only marginally from their conventional counterparts. Thus, if habitat is the limiting avian density factor, then one would not expect significantly different bird densities in conventional and organic hedgerow and ecotone habitats. A similar situa- tion was observed with arable weeds [36] and butterflies [37]. The outcome of these studies varied according to the landscape on a broader context. The differences in biodiversity between organic and conventional farmland were greater in more homogeneous landscapes. Organic farm management may recreate some of this heterogene- ity in the more intensively farmed (ie- more homogenous) areas [37] and would therefore favour and increase bio- diversity in organically managed farmland. Therefore, as a result of the already heterogeneous landscape, agricul- tural management was not an important predictor of vian densities, but finer habi at features such as ecotone at Copyright © 2011 SciRes. OPEN A CCESS 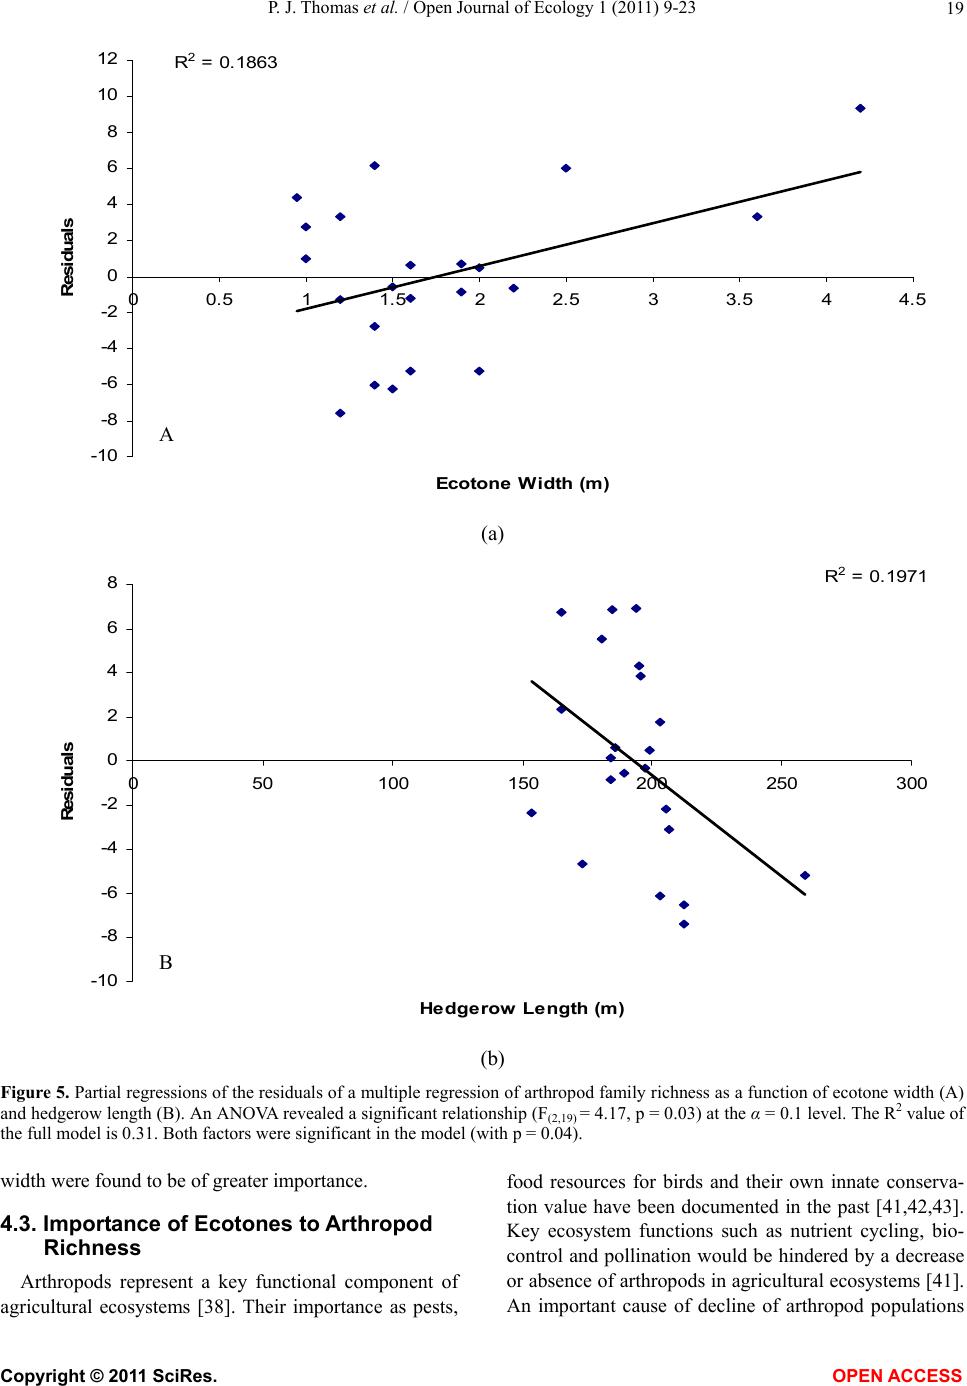 P. J. Thomas et al. / Open Journal of Ecology 1 (2011) 9-23 19 R 2 = 0.1863 -10 -8 -6 -4 -2 0 2 4 6 8 10 12 0 0.51 1.52 2.533.54 4.5 Ecotone Wi dth (m) Residuals A (a) R 2 = 0.19 71 -10 -8 -6 -4 -2 0 2 4 6 8 050100 150200 250 300 Hedgerow Length (m ) Residuals B (b) Figure 5. Partial regressions of the residuals of a multiple regression of arthropod family richness as a function of ecotone width (A) and hedgerow length (B). An ANOVA revealed a significant relationship (F(2,19) = 4.17, p = 0.03) at the α = 0.1 level. The R2 value of the full model is 0.31. Both factors were significant in the model (with p = 0.04). width were found to be of greater importance. 4.3. Importance of Ecotones to Arthropod Richness Arthropods represent a key functional component of agricultural ecosystems [38]. Their importance as pests, food resources for birds and their own innate conserva- tion value have been documented in the past [41,42,43]. Key ecosystem functions such as nutrient cycling, bio- control and pollination would be hindered by a decrease or absence of arthropods in agricultural ecosystems [41]. An important cause of decline of arthropod populations Copyright © 2011 SciRes. OPEN A CCESS  P. J. Thomas et al. / Open Journal of Ecology 1 (2011) 9-23 20 in hedgerow and ecotone habitats involves structural changes in the plant community as a whole through cut- ting, grazing, fertilizer and pesticide applications [42]. A study by Woodcock et al. [44] found that ecotones receiving either no management or minimal cutting sup- ported greater abundances and species richness of bee- tles. Subtle modifications of conventional management practices (such as discontinuing the use of NPK fertiliz- ers and maintaining grazing) were also shown to be beneficial to beetle populations [44]. Others such as Merckx et al. [48] found that wider ecotones positively affected abundance of mobile arthropod species such as moths. Clearly, floristic and structural attributes of ecotones influence arthropod abundance and should be managed accordingly to sustain proper ecosystem func- tioning. Wider ecotones in arable landscapes affect groups of arthropods in different ways. Unfortunately, these rela- tionships are often complex and should be considered individually (in different arthropod species, or groups of species such as families). However, wider margin habitat increases the abundance of certain insects and changes the species composition in the ecotone itself [45,46]. Few studies have attempted to investigate the effects of ecotone width on invertebrate density and diversity. Wider margins may support higher plant diversity [47] which in turn favours particular groups of arthropods who feed on nectar sources for-example [48]. It could also be that wider margins with increased floral diversity provides better quality breeding habitat for arthropods whose larvae are phytophageous [48]. The greater area resulting from wider ecotones could even act as a buffer against agrochemical drift that negatively impacts in- sects. 4.4. Hedgerow Length and Gaps Similar to our results, Conover et al. [16] detected no effect of ecotone width on avian diversity during their study. The authors speculated that the lack of a positive relationship between border width and avian diversity was most likely influenced by the scarcity of non-crop habitat at the landscape scale. In the context of our study area, non-crop habitats were diverse and represented the majority of the landscape cover. As a consequence, birds in both conventional and organic farming sites were di- verse (with high H’ values over 2). Our best model revealed that percentage hedgerow gap was the best predictor of avian diversity (H’) at our 26 farming sites. Therefore, our results support the the- ory that increasing hedgerow fragmentation (or gaps) in a dominantly forested landscape decreases avian diver- sity. This decrease could be due to an increase in nest predators such as raccoons (Procyon lotor) or brood parasitism by species such as the cowbird [49]. With increasing hedgerow gaps, avian diversity decreases through increased nest predation and brood parasitism; unlike the trend reported by Bowen et al. [50] where the creation of small canopy gaps increased local bird spe- cies richness. It was surprising that longer hedgerows supported lower arthropod richness. This could be due to a diluting effect but the interpretation is still subject to criticism. In fact, Ricci et al. [40] documented that hedgerow length was not a significant predictor of moth abundance in an agricultural landscape and the trend was opposite with each sampling year. It is mentioned that this erratic result could be due to insecticide treatments that affect the presence or absence of enemies and/or the fact that longer hedgerows support a greater number of natural insect enemies such as parasitoids or predators. Our study lacks the data to support such claims. 4.5. Bugs and Birds We have documented 8 avian species that were pre- sent in higher densities at organic farms (see results). These bird species were for the most part, insectivores and seed eaters that favour forested, early successional and ecotone areas of the landscape [50]. Contrary to re- sults presented by Parish et al. [12], the abundance of the majority of our avian species was not strongly influ- enced by hedgerow height, width and length. However, similar to his findings, ecotone width was important for the smaller insectivores and seed eating birds, or the 8 species present in higher densities on organic farms. Furthermore, the presence of wider ecotones altered bird use of row-crop fields in a study by Conover et al. [32]. The authors observed increased sparrow (Ember- izidae) abundance in agricultural fields near wide ecotones. This was most likely a result from enhanced waste grain foraging opportunities. Similar to their study, house sparrows were more abundant in organically managed farmland with wider ecotones. The positive impacts of higher arthropod richness on bird populations favouring ecotones have been docu- mented by others such as Douglas et al. [6]. Indeed, maintaining high arthropod-rich ecotones is a core com- ponent of Agri-Environment Schemes. It has been stipu- lated that their value is limited in late summer [6], but the benefits to foraging birds during the breeding season is crucial to the birds’ reproductive success and ensures healthy ecosystem functioning in the long run. In general, agricultural management options that promote floral diversity will automatically stimulate arthropod diversity [51]. A rich variety of Angiospermae provides larval foodstuffs and structural diversity that benefits a wide range of invertebrates [51]. Insects that Copyright © 2011 SciRes. OPEN A CCESS  P. J. Thomas et al. / Open Journal of Ecology 1 (2011) 9-23 21 thrive on wildflowers and naturally regenerated vegeta- tion will enhance the reproductive success of the many birds that prey on these arthropods. Encouraging a di- verse insect fauna will not automatically address the food requirements of all farmland birds, but it at least provides a strategic angle that could be used to mitigate the decline of many aerial insectivores that frequent ar- able land. Favouring a higher richness of arthropods through ecotone management may increase the abundance and distribution of avian species who select for arthro- pod-rich habitats as a source of food [45]. At the field scale during the summer months (or the breeding season), many bird species nest at the base of woody hedgerows and will forage in nearby ecotonal areas. By increasing arthropod richness (and abundance) in margin areas (or ecotones), one should increase reproductive success by allowing an insectivorous bird to successfully forage for bugs, using the least amount of energy. Arthropod-rich ecotones thus provide more “bang for your buck”. 4.6. Study Limitations Although we have documented some interesting trends and some strong significant results, our study is not without any limitations. First, it would have been appropriate to sample pitfall traps, sticky traps, sweep net surveys and moth surveys at every single avian site in order to increase our sample size and subsequent power. A carefully tailored multi-year study would have helped reduce some of the variability in the dataset. Also, identifying all arthropods to species level would have helped keep the sample size high and would have in- creased our statistical strength. For-example, 313 known moth species were part of our dataset. Rolling the infor- mation up to family level reduced our sample size to only 12. Clearly, in Table 4, this reduction explains why the p-value drops from 0.73 when moth family richness is calculated as opposed to moth species richness where the p-value becomes an impressive 0.07. Identifying all our arthropods to species level would have most likely helped us in uncovering stronger relationships. 4.7. Implications for Management Common to the recommendations of Vickery et al. [51], we continue to stress the importance of creating, maintaining and improving ecotones (field margins) as a cost-effective way of providing ample resources to dif- ferent taxa at every trophic level. Field margins should be managed with adjacent woody hedgerows in a way to create a heterogeneous habitat structure capable of sup- porting a wide range of needs in different species such as nesting opportunities (for birds), refuge and food supply (for arthropods). Increasing ecotone width and keeping woody hedgerow habitats as gapless as possible is a good strategy to ensure proper agroecosystem health and functioning. Our findings are important in that they further our knowledge on the relationships amongst different trophic levels in two different ecotone management systems (organic and conventional farming). In our case, agri- cultural management did not have a strong effect on these relationships but finer habitat attributes (such as ecotone width and percent hedgerow gap) clearly influ- enced prey-predator dynamics. 5. ACKNOWLEDGEMENTS We would like to thank all the landowners who permitted access to their properties and provided information about their farming practices. J. Duffe and A. Baril conducted the GIS analysis of landscape habitat variables. M. Gaubehr, D. Kirk and K. Lindsay conducted preliminary statistical analysis and provided valuable advice. This research was funded by Environment Canada. REFERENCES [1] O'Connor, R.J. and Shrubb, M. (1986) Farming and birds. Cambridge University Press, Cambridge. [2] Hinsley, S.A. and Bellamy, P.E. (2000) The influence of hedge structure management and landscape context on the value of hedgerows to birds: A review. Journal of Environmental Management, 60, 33-49. doi:10.1006/jema.2000.0360 [3] Green, R.E., Cornell, S.J. and Scharlemann, J.P. (2005) Farming and the fate of wild nature. Science, 307, 550-555. doi:10.1126/science.1106 049 [4] Hole, D.G., Perkins, A.J. and Wilson, J.D. (2005) Does organic farming benefit biodiversity? Biological Cons- ervation, 122, 113-130. doi:10.1016/j.biocon.2004.07.018 [5] Donald, P.F., Green, R.E. and Heath, M.F. (2000) Agricultural intensification and the collapse of Europe’s farmland bird populations, Proceedings of the Royal So- ciety London, Series B, 268, 25-29. doi:10.1098/rspb.2000.1325 [6] Douglas, D.J.T., Vickery, J.A. and Benton, T.G. (2009) Improving the value of field margins as foraging habitat for farmland birds. Journal of Applied Ecology, 46, 353-362. doi:10.1111/j.1 365-26 64.2009.016 13.x [7] Robinson, R.A. and Sutherland, W.J. (2002) Post-war changes in arable farming and biodiversity in Great Britain. Journal of Applied Ecology, 39, 157-176. doi:org/10.1046/j.1365-2664.2002.00695.x [8] Newton, I. (2004) The recent declines of farmland bird populations in Britain: an appraisal of causal factors and conservation actions. Ibises, 146, 579-600. doi:10.1111/j.1474-919X.2004.00375.x [9] Vickery, J.A., Carter, N. and Fuller, R.J. (2002) The potential value of managed cereal field margins as foraging habitats for farmland birds in the UK. Agri- culture, Ecosystems and Environment, 89, 41-52. doi:10.1016/S0167-8809(01)00317-6 [10] Moles, R.T. and Breen, J. (1995) Long-term change Copyright © 2011 SciRes. OPEN A CCESS  P. J. Thomas et al. / Open Journal of Ecology 1 (2011) 9-23 22 within lowland farmland bird communities in relation to field boundary attributes. Biology and Environment: Proceedings of the Royal Irish Academy, 95B, 203-215. [11] Demers, M.N., Simpson, J.W., Boerner, R.E.J., Silva, A., Berns, L. and Artigas, F. (1995) Fencerows, edges, and implications of changing connectivity illustrated by two contiguous Ohio landscapes. Conservation Biology, 9, 1159–1168. doi:10.1046/j.1523-1739.1995.9051148.x-i1 [12] Parish, T. Lakhani, K.H. and Sparks, T.H. (1995) Modelling the relationship between bird population var- iables and hedgerow, and other field margin attributes. II. Abundance of individual species and of groups of similar species. Journal of Applied Ecology, 32, 362-371. doi:10.2307/2405102 [13] Ralph, C.J., Sauer, J.R. and Droege S. (1995) Monitoring Bird Populations by Point Counts. Gen. Tech. Rep. PSW-GTR-149. Pacific Southwest Research Station, USDA Forest Service, Albany. [14] Boutin, C., Martin, P.A. and Baril, A. (2009) Arthropod diversity as affected by agricultural management (org- anic and conventional farming), plant species, and landscape context, Ecoscience, 16 , 492-501. doi:10.2980/16-4-3250 [15] Boutin, C., Baril, A., McCabe, S.K., Martin, P.A. and Guy, M. (2011) The value of woody hedgerows for moth diversity on organic and conventional farms, Biological Conservation, (in press). [16] Conover, R.R., Burger, L.W.Jr., and Linder, E.T. (2009) Breeding bird response to field border presence and width. The Wilson Journal of Ornithology, 121, 548-555. doi:10.1676/08-082.1 [17] Anderson, D.R., Burnham, K.P. and Thompson, W.L. (2000) Null hypothesis testing: problems, prevalence and an alternative. Journal of Wildlife Management, 64, 912-923. doi:10.2307/3803199 [18] Guthery, F.S., Brennan, L.A., and Petersen, M.J. (2005) Information theory in wildlife science: critique and viewpoint. Journal of Wildlife Management, 69, 457-465. doi:10.2193/0022-541X(2005)069[0457:ITIWSC]2.0.CO ;2 [19] Rogers, C.A., and Freemark, K.E. (1991) A feasibility study comparing birds from organic and conventional (chemical) farms in Canada, Technical Report Series No. 137, Canadian Wildlife Service, Headquarters, Gatineau, Québec, Canada. [20] Long, J.S., and Freese, J. (2006) Regression models for categorically dependent variables using Stata, Second Edition, Stata Press, Texas [21] Burnham, K.P., and Anderson, D.R. (2004) Multimodel inference: understanding AIC and BIC in model selection. Sociological Methods and Research, 33, 261-304. doi:10.1177/0049124104268644 [22] "ecotone." Encyclopædia Britannica, Encyclopædia Br- itannica Online, Encyclopædia Britannica. (2011) Web. 26 Japan 2011. http://www.britannica.com/EBchecke- d/topic/178617/ecotone. [23] Boutin, C., Freemark, K.E. and Weseloh, D.V. (1996) Bird use of crops in southern Ontario: Implications for assessment of pesticide risk, Technical Report Series No. 264, Canadian Wildlife Service Headquarters, Hull, Quebec. [24] Henderson, I.G., Vickery, J.A. and Fuller, R.J. (2000) Summer bird abundance and distribution on set-aside fields on intensive arable farms in England. Ecography, 23, 50-59. doi:10.1111/j.1600-0587.2000.tb00260.x [25] Hald, A.B., and Elmegaard, N. (1988) Pesticide excl- usion strips between agricultural and non-agricultural areas in Denmark: Introduction to a Danish 3-year project in cereals, 1985-1987. Ecological Bulletin, 39, 189-190. [26] Tew, T.E., MacDonald, D.W. and Rands, M.R.W. (1992) Herbicide application affects microhabitat use by arable wood mice (Apodemus sylvaticus). Journal of Applied Ecology, 28, 906-917. [27] Shutler, D., Mullie, A. and Clark, R.G. (2000) Bird communities of prairie uplands and wetlands in relation to farming practices in Saskatchewan. Conservation Biology, 14, 1441-1451. doi:10.1046/j.1523-1739.2000.98246.x [28] Chamberlain, D.E., Wilson, J.D. and Fuller, R.J. (1999) A comparison of bird populations on organic and conventional farmland in southern Britain. Biological Conservation, 88, 307-320. doi:10.1016/S0006-3207(98)00124-4 [29] Kleijn, D., and Sutherland, W.J. (2003) How effective are European agri-environment schemes in conserving and promoting biodiversity? Journal of Applied Ecology, 40, 947-969. doi:10.1111/j.1365-2664.2003.00868.x [30] Conover, R.R. (2005) Avian response to field borders in the Mississippi Alluvial Valley, Thesis, Mississippi State University, Mississippi State. [31] Smith, M.D., Barbour, P.J.Jr., Burger, L.W., Dinsmore, S.J. (2005) Density and diversity of overwintering birds in managed field borders in Mississippi. Wilson Bulletin, 117, 258-269. doi:10.1676/04-097.1 [32] Conover, R.R., Burger, L.W.Jr., and Linder, E.T. (2007) Winter avian community and sparrow response to field border width, Journal of Wildlife Management, 71, 1917-1923. [33] Ratti, J.T. and Reese, K.P. (1988) Preliminary test of the ecological trap hypothesis. Journal of Wildlife Man- agement, 52, 484-491. doi:10.2307/3801596 [34] Paton, P.W.C. (1994) The effect of edge on avian nest success: how strong is the evidence? Conservation Biology, 8, 17-26. doi:10.1046/j.1523-1739.1994.08010017.x [35] Vickery, P.D., Hunter, M.L.Jr., and Melvin, S.M. (1994) Effects of habitat area on the distribution of grassland birds in Maine. Conservation Biology, 8, 1087-1097. doi:10.1046/j.1523-1739.1994.08041087.x [36] Roschewitz, I., Gabriel, D. and Tscharntke, T. (2005) The effects of landscape complexity on arable weed species diversity in organic and conventional farming. Journal of Applied Ecology, 42, 873-882. doi:10.1111/j.1365-2664.2005.01072.x [37] Rundlöf, M., and Shmidt, H.G. (2006) The effect of organic farming on butterfly diversity depends on the landscape context. Journal of Applied Ecology, 43, 1121-1127. [38] Woodcock, B.A., Pywell, R., Roy, D.B., Rose, R. and Bell, D. (2005) Grazing management of calcareous grasslands and its implications for the conservation of Copyright © 2011 SciRes. OPEN A CCESS  P. J. Thomas et al. / Open Journal of Ecology 1 (2011) 9-23 Copyright © 2011 SciRes. 23 OPEN ACCESS beetle communities. Biological Conservation, 125, 192- 202. doi:10.1016/j.biocon.2005.03.017 [39] Bowen, L.T., Moorman, C.E. and Kilgo, J.C. (2007) Seasonal bird use of canopy gaps in a bottomland forest. The Wilson Journal of Ornithology, 119, 77-88. doi:10.1676/05-091.1 [40] Ricci, B., Franck, P., Toubon, J.F., Bouvier, J.C., Sau- phanor, B. and Lavigne, C. (2009) The influence of landscape on insect pest dynamics: a case study in south- eastern France. Landscape Ecology, 24, 337-349. doi:10.1007/s10980-008-9308-6 [41] Norris, K.R. (1994) General biology Systematic and Applied Entomology: An Introduction, Melbourne Un- iversity Press, Carlton, Australia. [42] Vickery, J.A., Tallowin, J.R., Feber, R.E., Asteraki, E.J., Atkinson, P.W., Fuller, R.J. and Brown, V.K. (2001) The management of lowland neutral grasslands in Britain: effects of agricultural practices on birds and their food resources. Journal of Applied Ecology, 38, 647-664. doi:10.1046/j.1365-2664.2001.00626.x [43] Asher, J., Warren, M., Fox, R., Harding, P., Jeffcoate, G. and Jeffcoate, S. (2001) The Millennium Atlas of Butterflies in Britain and Ireland, Oxford University Press, Oxford. [44] Woodcock, B.A., Potts, S.G., Pilgrim, E., Ramsay, A.J., Tscheulin, T., Parkinson, A., Smith, R.E.N., Gundrey, A.L., Brown, V.K. and Tallowin, J.R. (2007) The poten- tial of grass field margin management for enhancing beetle diversity in intensive livestock farms. Journal of Applied Ecology, 44, 60-69. doi:10.1111/j.1365-2664.2006.01258.x [45] Aviron, S., Herzog, F., Klaus, I., Luka, H., Pfiffner, L., Schüpbach, B. and Jeanneret, P. (2007) Effects of Swiss agri-environmental measures on arthropod biodiversity in arable landscapes. Aspects of Applied Biology, 81 , 101- 109. [46] Dennis, P. and Fry, G.L.A. (1992) Field margins: can they enhance natural enemy population densities and general arthropod diversity on farmland? Agriculture, Ecosystems and Environment, 40, 95-115. doi:10.1016/0167-8809(92)90086-Q [47] Schippers, P. and Joenje, W. (2002) Modelling the effect of fertiliser, mowing, disturbance and width on the bio- diversity of plant communities of field boundaries, Agr- iculture. Ecosystems and Environment, 93, 351-365. doi:10.1016/S0167-8809(01)00339-5 [48] Merckx, T., Feber, R.E., Dulieu, R.L., Townsend, M.C., Parsons, M.S., Bourn, N.A.D., Riordan, P. and Mac- donald, D.W. (2009) Effect of field margins on moths depends on species mobility: Field-based evidence for landscape-scale conservation. Agriculture, Ecosystems and Environment, 129, 302-309. doi:10.1016/j.agee.2008.10.004 [49] Robinson, W.D. and Robinson, S.K. (1999) Effects of selective logging on forest bird populations in a fra- gmented landscape. Conservation Biology, 13, 58-66. doi:10.1046/j.1523-1739.1999.97226.x [50] Poole, A. (2005) The Birds of North America Online: http://bna.birds.cornell.edu/BNA/, Cornell Laboratory of Ornithology, Ithaca, NY. [51] Vickery, J.A., Feber, R.E. and Fuller, R.J. (2009) Arable field margins managed for biodiversity conservation: A review of food resource provision for farmland birds. Agriculture Ecosystems and Environment, 133, 1-13. doi:10.1016/j.agee.2009.05.012
|