 Vol.2, No.3, 220-237 (2011) doi:10.4236/as.2011.23031 Copyright © 2011 SciRes. Openly accessible at http://www.scirp.org/journal/AS/ Agricultural Scienc es Cropping frequency and N fertilizer effects on soil water distribution from spring to fall in the semiarid Canadian prairies R. de Jong1*, C. A. Campbell1, R. P. Zentner2, P. Basnyat2, B. Grant1, R. Desjardins1 1Eastern Cereal and Oilseed Research Centre, Central Experimental Farm, Agriculture and Agri-Food Canada, Ottawa, Canada; *Corresponding Author: dejongr@agr.gc.ca 2Semiarid Prairie Agricultural Research Centre, Agriculture and Agri-Food Canada, Swift Current, Canada. Received 26 May 2011; revised 24 June 2011; accepted 25 July 2011. ABSTRACT In the semiarid Canadian prairies, water is the most limiting and nitrogen (N) the second most limiting factor influencing spring wheat (Triti- cum aestivum L.) production. The efficiency of water- and nitro gen use need s to be asses sed in order to maintain this production system. The effects of cropping frequency and N fertilization on trends in soil water distribution and water use were quantified for an 18-yr (1967-1984) field experiment conducted on a medium tex- tured Orthic Brown Chernozem (Aridic Haplo- boroll) in southwestern Saskatchewan, Canada. Soil water contents were measured eight times each year and plant samples were taken at five phenological growth stages. The treatments studied were continuous wheat (Cont W), summer fallow - wheat, F-(W) and summer fal- low - wheat - wheat, F-W-(W) each receiving recommended rates of N and phosphorus (P) fertilizer, and (F)-W-W and (Cont W) each re- ceiving only P fertilizer, with the examined rota- tion phase shown in parentheses. Soil water conserved under fallow during the summer months averaged 25 mm in the root zone, and was related to the initial water content of the soil, the amount of precipitation received, its distri- bution over time, and potential evapotranspira- tion. Under a wheat crop grown on fallow, soil water contents between spring and the five-leaf stage remained relatively constant at about 250 mm, but those under a stubble crop, with 40 mm lower spring soil water reserves, increased slightly until about the three-leaf stage. During the period of expansive crop growth (from the five-leaf to the soft dough stage) soil water was rapidly lost from all cropped phases at rates of 1.87 mm·day–1 for F-(W) ( N+P), 1.23 mm· day –1 for Cont W (N+P) and 1.17 m m·day –1 for Con t W (+P). The initial loss was from the 0 - 0.3 m depth, but during the la tter half of the gr o wing season from deeper depths, although rarely from the 0.9 - 1.2 m depth. In very dry years (e.g., 1973, with 87 mm precipitation between spring and fall) summer fallow treatments lost water. In wet years with poor precipitation distribution (e.g., 1970, with 287 mm precipitation between spring and fall but 142 mm of this in one week between the three- and five-leaf stages) even cropped treatments showed evidence of leaching. The above-ground biomass water use efficiency for Cont W was 19.2 and 16.7 kg·ha–1·mm–1, respec- tively, for crops receiving (N+P) and P fertilizer only. Grain yield water use efficiency (8.91 kg·ha–1·mm–1) was not significantly influenced by cropping frequency or N fertilizer. The 18 years of detailed measurements of plant and soil parameters under various crop manage- ment systems provide an invaluable source of information for developing and testing simula- tion models. Keywords: Fallow Frequency; Water Use; Plant Biomass; Spring Wheat; Soil Water 1. INTRODUCTION In the semiarid region of the northern Great Plains (i.e., the Brown Chernozemic soil zone), water is the main factor influencing wheat (Triticum aestivum L.) production [1,2]. Potential evapotranspiration (PET) always exceeds precipitation (PPT) during the growing season, and consequently farmers in this area often prac-  R. de Jong et al. / Agricultural Science 2 (2011) 220-237 Copyright © 2011 SciRes. Openly accessible at http://www.scirp.org/journal/AS/ 221221 tice summer fallowing (F) to conserve water for the next crop. This practice also serves to control weeds and to increase mineral nitrogen (N) in the soil, thereby helping to alleviate the second greatest restriction to production in this region (i.e., soil N deficiency) [1]. Although the area devoted to summer fallow on the Canadian prairies has been decreasing steadily in recent years, the rate of decrease is lowest in the Brown soil zone (1.3% yr–1) [3]; thus, summer fallowing is still an important management tool in this region. The efficiency of soil water storage from precipitation in the prairies is generally low and varies greatly de- pending on soil texture, type of cultural practice, the amount of crop residues left standing to trap snow, and the amount and distribution of precipitation received in the non-crop-growing period [4,5]. We recently assessed the effects of cropping frequency and N fertilization on soil water conservation based on the results from a 40-yr experiment conducted on a medium-textured Orthic Brown Chernozem (Aridic Haploboroll) at Swift Current, Sas- katchewan [6]. We examined three treatments: continu- ous wheat (Cont W) and fallow-wheat (F-W) each re- ceiving N and phosphorus (P) fertilizer, and Cont W receiving only P fertilizer. The results showed that at harvest, F-W and Cont W (N+P) had similar amounts of water in the soil profile, but Cont W (+P) had more be- cause of less growth and reduced water use. However by the following spring, soil water recharge, being propor- tional to the amount of crop residues produced, had conserved an extra 64, 55 and 40 mm of water in treat- ments F-W, Cont W (N+P) and Cont W (+P), respec- tively [6]. Numerous studies (see review articles [7,8]) have been conducted in which the relationships between crop yield and water use on the prairies have been assessed. The effects of fertilization rates [9-11], tillage practices [12-14], cropping frequency [15,16] and soil- and weather- conditions [17] on water use efficiency have been docu- mented extensively. However, less is known about the seasonal changes in crop water use and in water use effi- ciency of the plant biomass. Agro-ecosystem models are being increasingly used for site specific analyses and the development of site adapted agricultural production systems [18,19]. On a regional and/or national scale these models are used for the evaluation of current land use and potential remedia- tion measures through scenario simulations [20-22]. However, testing and validation of the models should be done using independently measured data from field ex- periments such as those described in this manuscript. During the first 18 years (1967-1984) of the Swift Cur- rent long-term crop rotation experiment, detailed meas- urements of soil water and plant biomass were made, with eight samplings between spring and fall on selected treatments. Although some assessments of these data were made [23,24], seasonal changes in soil water con- tent and its distribution within the profile were not ex- amined. The objectives of this paper were to determine the ef- fect of cropping frequency and N fertilizer on 1) soil water trends and its depth distribution from spring to fall, and to assess how these patterns were influenced by weather conditions, and 2) the efficiency of water use to produce above-ground biomass and grain of spring wheat. Furthermore, we want to alert agricultural system modellers to the unique nature of these long term ex- perimental results. 2. MATERIALS AND METHODS The Swift Current crop rotation experiment was initi- ated in 1967 on a flat (slope < 2%) Swinton loam [25], an Orthic Brown Chernozem [26]. Swift Current (50˚17′ N, 107˚48′ W, elevation 883 m) is located in the driest portion of the Canadian Prairies, with long cold winters and short growing seasons [27]. The soils are frozen from mid October until March/April. Rainfall is mar- ginal for many agricultural activities (on average 197 mm is received during the growing season) and timing of rainfall is as important as total amount. Over the 18-yr study period, the annual average precipitation was 324 mm, of which 108 mm was in the form of snow. A sub- stantial proportion of the latter can disappear as sublim- tion, snow blowoff and, after melting, as surface runoff. No runoff from rainfall was observed during the growing season. The 18-yr mean PET (calculation method de- scribed in Section 2.2 below) was 661 mm. The rotation experiment consisted of 12 cropping sys- tems, of which we discuss five of the special plots. Spe- cial plots (0.04 ha each) were sampled for soil water and above-ground plant dry matter eight times between spring and fall of each year between 1967 and 1984 [28, 29]. The experiment has been described in numerous publications [23,24,30,31], thus we only present infor- mation required to assess the factors examined. The treatments examined were summer fallow-wheat F-(W), summer fallow-wheat-wheat-F-W-(W), and con- tinuous wheat (Cont W) each receiving N and P fertilizer, and (F)-W-W and (Cont W) each receiving only P fertil- izer. The rotation phase shown in parentheses was the special plot treatment. Fertilizer N and P were applied in accordance with the soil NO3-N (0 - 0.6 m depth) and soil P (0 - 0.15 m depth) levels in individual plots, measured the previous fall (mid-October) [30]. Fertilizer  R. de Jong et al. / Agricultural Science 2 (2011) 220-237 Copyright © 2011 SciRes. Openly accessible at http://www.scirp.org/journal/AS/ 222 N, as ammonium nitrate, was applied by broadcasting it in spring prior to seedbed preparation. We used N rates recommended by the soil testing laboratory at the Uni- versity of Saskatchewan [32]. Wheat grown on summer fallow received about 9 kg·N·ha–1·yr–1 and wheat grown on stubble received an average of 30 kg·N·ha–1·yr–1 during the 18-yr period. Phosphorus fertilizer (monoammonium phosphate) was applied with the seed, with the desig- nated treatments receiving 9 to 10 kg·N·ha–1·yr–1 in ac- cordance with the general recommendations for the area and crop [33]. Nitrogen in the P source was accounted for in the N rates. All phases of each rotation were pre- sent each year. There were three replicates. Full-sized farm equipment was used for all field op- erations. Tillage on summer fallow was performed two to five times with a heavy-duty cultivator and/or rod weeder. Late fall application of 2,4-D ester to control broadleaf weeds was customary and other herbicides were applied to cropped areas as required [31]. No fall tillage was performed on the plots. The field manage- ment operations (i.e., seedbed preparation, in-crop her- bicide application, seeding, harvesting, and tillage of summer fallow areas) were generally similar to those discussed previously [34]. Seeding dates ranged from May 3 to June 5 (average May 17) and harvest dates ranged from August 16 to September 23 (average September 1). 2.1. Plant and Soil Sampling At the three-leaf, five-leaf, shot blade (also known as flag leaf complete) and soft dough growth stages, which on the Feekes scale [35] correspond approximately to stages 1, 2, 10 and 10.5.3, respectively, and at harvest, plant samples were taken from two plant rows, each 3 m long and located 1 m from the edge of the plot (sampled area = 1.115 m2). Plant samples were dried at 70˚C and the mass of the above-ground parts determined. The soil was sampled at the aforementioned growth stages, as well as prior to spring seeding in early May, at plant emergence, at harvest, and in the fall, just prior to freeze- up. The fallow plots of rotation (F)-W-W (+P) were sampled at the same time as the cropped plots and therefore its sampling times will also be referred to as spring, emergence, three-leaf, etc. Over the 18-yr period most sampling stages occurred within a 2- to 4-wk range. Soil samples were taken (three cores per plot were bulked) from the 0 - 0.15, 0.15 - 0.3, 0.3 - 0.6, 0.6 - 0.9 and 0.9 - 1.2 m depths. These samples were analyzed for gravimetric soil water content, which was converted to volumetric units using measured bulk densities of 1.20, 1.22, 1.26, 1.49 and 1.67 Mg·m–3 for the five depths, respectively [28]. The lower limits of available water, i.e. the permanent wilting point, as determined from field measurements [36] were 27, 28, 28, and 31 mm for the 0 - 0.3, 0.3 - 0.6, 0.6 - 0.9 and 0.9 - 1.2 m depths respec- tively, for a total of 114 mm for the 1.2-m depth. Water contents at –0.03 MPa (i.e., field capacity) were 88, 87, 97 and 109 mm for the same depth intervals, for a total of 381 mm for the 1.2-m profile [37]. 2.2. Weather Data Daily maximum and minimum air temperatures and precipitation were measured at a meteorological site located 1 km west of the experimental site. Potential evapotranspiration was estimated from a regression equation relating latent evaporation (i.e., evaporation from Bellani plate atmometers) to meteorological infor- mation [38]. Although equations using a number of weather elements were developed, the most common one, using daily maximum and minimum air temperature data, was used: LE = 0.928 Tmax + 0.933 Trange + 0.0486 Qo – 87.03 where, LE is latent evaporation from a Bellani plate sur- face (cm3·day–1), Tmax is daily maximum temperature (˚F), Trange is the difference between daily maximum and daily minimum temperature (˚F), and Qo is the daily amount of solar radiation at the top of the atmosphere (cal·cm–2). The latter can be calculated for a given lati- tude and day of the year. LE is multiplied by a factor of 0.096 to obtain PET in mm·day–1 [39]. The empirical Baier-Robertson equation, which has been calibrated and validated for Canadian conditions, was chosen over the more physically based Penman-Monteith formulation, because net radiation, windspeed and humidity data were not continuously available during the 18-yr study period. 2.3. Data Anal ysis Grain yields and above-ground plant biomass at the various stages of growth were related by regression analysis to water use (WU) and relative water use, WU/ PET. Water use was defined as: (spring soil water - soil water at a later stage) + precipitation received during that period. 3. RESULTS 3.1. Soil Water under Summer Fallow 3.1.1. Eighteen-yr Mean Soil Water Contents Producers use summer fallow to conserve extra water for the next crop. The main portion of the 20-mo fallow eriod in which water is conserved in the semiarid prai- p  R. de Jong et al. / Agricultural Science 2 (2011) 220-237 Copyright © 2011 SciRes. http://www.scirp.org/journal/AS/Openly accessible at 223223 Ta b le 1 . 18-yr (1967-1984) mean soil water (0 - 1.2 m depth), above-ground dry matter, and precipitation (PPT) received between sampling times in five crop rotation phases at Swift Current, Saskatchewana. Rotation Phase Sampled (F)-W-W(+P) F-(W) (N+P) F-W-(W) (N+P) Cont W (N+P) Cont W (+P) Average calendar day Stage sampled Soil water (mm) Soil water (mm) Dry matter (kg·ha–1) Soil water (mm) Dry matter (kg·ha–1) Soil water (mm) Dry matter (kg·ha–1) Soil water (mm) Dry matter (kg·ha–1) Period Period PPT (mm) 123 Spring (Sp) 213 251 - 211 - 210 - 203 - Sp to Em 29.2 151 Emergence (Em) 217 248 - 218 - 211 - 210 - Em to 3L 17.5 162 Three-leaf (3L) 222 252 90 217 87 214 87 211 78 3L to 5L 29.8 177 Five-leaf (5L) 225 246 503 214 422 211 424 213 365 5L to SB 28.1 188 Shot blade (SB) 224 215 1792 192 1343 190 1428 188 1176 SB to Do 52.1 224 Soft dough (Do) 230 158 5130 157 3808 152 3788 158 3102 Do to Ha 11.1 238 Harvest (Ha) 233 154 4957 150 3706 150 3463 154 2877 Ha to Fa 40.9 290 Fall (Fa) 238 161 - 160 - 160 - 162 - Sp to Fa 208.7 aSoil water and dry matter are for rotation phases shown in parentheses. rie is the 5.5-mo period from May to mid-October [5]. Thus we observed an 18-yr average gain in soil water in the 0 - 1.2 m depth of 25 mm (i.e., 0.15 mm·day–1) dur- ing this period (Table 1). On average, the 0 - 0.3 m depth starts in spring close to 70% of field capacity with a little over 60 mm of water stored from the first eight months of the fallow period (Figure 1). Between spring and fall, the water content in this segment stayed fairly constant as gains from precipitation were balanced by evaporation and drainage losses. Water in the 0.3 - 0.6 m depth at the spring sampling time was slightly over 50 mm and the amount gradually increased to as much as that in the 0 - 0.3 m depth by the shot blade stage (Cal- endar day 188), and thereafter remained constant at slightly over 60 mm (like in the 0 - 0.3 m depth) until fall. Water in the 0.6 - 0.9 m and 0.9 - 1.2 m depths was about the same (45 mm) at the spring sampling. The water contents in these two depths increased gradually until the end of August, when it reached about 55 mm, i.e., slightly above 50% of field capacity. 3.1.2. Soil W ater Con tents under Summer Fallow during Selected Years As might be expected, the amount of water stored and the pattern of gain over time were quite variable, de- pending primarily on the rainfall frequency, the amount years (1970 and 1982) (Figure 2). In 1968, 177 mm precipitation that was well distrib- uted throughout the season was received between spring and fall (Figure 2(a)). The PET during this period was calculated to be 579 mm, and as a result the soil profile only gained 25 mm of water, or 14.1% of the precipita- tion. The early increases of about 28 mm of water in the 0.3 - 0.9 m depth between spring and emergence was received, and also on the temperature and wind which control evaporation in the southern prairies. We present examples of trends in water storage under fallow [(F)-W- W (+P)], in two dry years (1968 and 1973) and two wet peculiar because there was little precipitation received in this period (15 mm). We suspect that this anomaly might be due to spatial variability because the coefficient of variation of the sampled spring soil water content was high, i.e., 39%. From emergence to fall, the soil water contents of all depths remained fairly constant, except between harvest and fall when the 0 - 0.6 m depth re- flected the substantial precipitation (91 mm) received during this period. With only 87 mm precipitation and PET totalling 626 mm between spring and fall, 1973 represented a very dry year (Figure 2(b)). The 0 - 0.3 and 0.3 - 0.6 m depths gradually lost water throughout the spring to harvest period, while the water content in the 0.6 - 0.9 m depth remained fairly constant. On the other hand, the 0.9 - 1.2 m depth gained 12 mm water from spring to the five-leaf stage, and then remained relatively constant. Thus there was evidence of water moving from upper to lower depths prior to the five-leaf stage. Overall, 21 mm of water was lost from the soil profile under summer fallow conditions due to evaporation exceeding the well dis- tributed, but small occurrences of precipitation events in this dry year. During the very wet years of 1970 and 1982, when summer fallow started in the spring with a modest amount of water in the profile (220 mm and 170 mm, respectively), large amounts of precipitation received in ay and/or June, before evaporative demands were very M  R. de Jong et al. / Agricultural Science 2 (2011) 220-237 Copyright © 2011 SciRes. Openly accessible at http://www.scirp.org/journal/AS/ 224 Figure 1. 18-yr mean trend in soil water content under summer fallow [(F)-W-W (+P)] as a function of time of sam- pling, precipitation received during the sampling periods, and depth (successive sampling times are spring, emergence, three-leaf, five-leaf, shot blade, soft dough, harvest and fall). high, resulted in marked gains in soil water, i.e., 53 mm, or 18.5% of the precipitation, in 1970 and 105 mm, or 31.6% of the precipitation in 1982 (Figures 2(c)-(d)). About half (142 mm) of the total precipitation received in 1970 fell in a one week period between the three- and five- leaf stage, causing wetting of all depths to 1.2 m and possible deeper. After the five-leaf stage small rain- fall events were balanced by evaporation and thus, bar- ring the anomalous water contents in the 0.9 - 1.2 m depth at the soft dough stage and the one in the 0 - 0.3 m depth at harvest, the soil water contents of all depths remained constant till fall. In 1982, when the precipita- tion was better distributed throughout the season than in 1970, soil water contents in the upper two depths reached almost field capacity at the five-leaf stage and stayed constant and high till harvest before increasing slightly till fall. The steady gains in water in the 0.6 - 1.2 m depth were 84% of those in the 0 - 0.6 m depth. Water draining beyond the 1.2 m depth during wet years has also been demonstrated in several soil water simulation studies [37,40,41]. Thus, the amount of water conserved during the summer months under summer fallow depends on the complex combination of amount and time-distribution of precipitation received, the initial soil water content in spring, and the evaporative de- mands during the season. 3.2. Soil Water under a Crop 3.2.1. Eighteen-yr Mean Soil Water Contents for 0 - 1.2 m Dept h Soil water conditions under cropped systems in the semiarid prairies reflect the net balance between pre- cipitation received and water lost via evaporation and transpiration. Drainage through the root zone should be rare except when very wet conditions occur in the early part of the growing season, before the crop is well estab- lished. The 18-yr mean amount of soil water in 0 - 1.2 m depth under wheat being grown on fallow [F-(W) (N+P)] was approximately 250 mm from spring to the five-leaf stage; thereafter, soil water decreased rapidly to 158 mm at the soft dough stage (i.e., at a rate of 1.87 mm·day–1) (Table 1). Between harvest and fall there was an average gain of about 7 mm of water in response to an average precipitation of 41 mm received in this 52-day period. The 18-yr mean soil water content in the 0 - 1.2 m depth at spring sampling under well-fertilized stubble rop wheat systems [e.g. F-W-(W) (N+P) and Cont W c  R. de Jong et al. / Agricultural Science 2 (2011) 220-237 Copyright © 2011 SciRes. Openly accessible at http://www.scirp.org/journal/AS/ 225225 Figure 2. Examples of soil water contents under summer fallow [(F)-W-W (+P)] as a function of time of sampling, daily precipitation, and depth for four selected years (values in brackets are precipitation totals between spring and fall). (N+P)] was 210 mm (Table 1). Generally, these drier systems gained a few mm of water by the three-leaf stage, as gains from precipitation exceeded losses due to low evapotranspiration rates related to minimal dry mat- ter production and generally cool spring conditions. Here too, as was the case for wheat grown on fallow [F-(W) (N+P)], soil water in the profile decreased rapidly be- tween the five-leaf and soft dough stage to about 155 mm in 1.2 m depth (at about 1.23 mm·day–1). Between harvest and fall these well fertilized, stubble cropped systems then gained on average 10 mm of water from the 41 mm of precipitation received in this period. As discussed by [6], Cont W (+P), because it had less standing stubble than Cont W (N+P), trapped less snow over winter; thus in spring, on average, it started with about 7 mm less water in the profile (Table 1). Like well-fertilized systems of wheat grown on stubble, Cont W (+P) gained a small amount of water (10 mm) be- tween the spring sampling and the five-leaf stage, then, like the other cropped systems, it lost water rapidly at a rate of 1.17 mm·day–1 until the soft dough stage, before regaining about 8 mm between harvest and fall. Note that the rates of decrease in soil water during the period of rapid growth (i.e. the five-leaf to soft dough stage) were proportional to the rate of above-ground dry matter production (Table 1). This suggests that transpiration was mainly responsible for the water loss in that period. 3.2.2. Eighteen-yr Mean Soil Water Contents at Individ ual Depths The 18-yr mean soil water content in the 0 - 0.3 m and 0.3 - 0.6 m depths at spring sampling under wheat being grown on summer fallow [F-(W) (N+P)] was about 64 mm (Figure 3(a)). Soil water remained almost constant till the three-leaf stage (five-leaf stage for the 0.3 - 0.6 m depth), then decreased sharply to about 35 mm at the soft dough stage as evapotranspiration markedly ex- ceeded precipitation. The soil water contents then re- mained constant for a short time until harvest. Between harvest and fall (with no transpiration) the water content of the 0 - 0.3 m depth was recharged with precipitation to reach about 46 mm of water by the fall sampling. The water content of the second depth remained constant till fall, as excess precipitation between harvest and fall was insufficient to wet the soil beyond the 0.3 m depth. Both the 0.6 - 0.9 m and 0.9 - 1.2 m depths had about 59 mm of soil water at the spring sampling, and water levels in these two depths remained almost constant till the five- leaf stage before decreasing slightly in both depths till the shot blade stage. Thereafter, soil water in both of these segments decreased sharply, though faster in the .6 - 0.9 m depth, till harvest, and then remained con- 0  R. de Jong et al. / Agricultural Science 2 (2011) 220-237 Copyright © 2011 SciRes. Openly accessible at http://www.scirp.org/journal/AS/ 226 Figure 3. 18-yr mean trend in soil water content under spring wheat as a function of time of sampling, precipitation received during the sampling periods, and depth (successive sampling times are spring, emergence, three-leaf, five-leaf, shot blade, soft dough, harvest and fall). stant till fall when the 0.6 - 0.9 m depth had about 38 mm and the 0.9 - 1.2 m depth had about 46 mm of water. Thus, in the F-(W) (N+P) system most of the water was used between the five-leaf and soft dough stage, and mainly from the top 0.6 m of soil. This was related to the period of greatest growth (Ta b l e 2 ) and evapotranspira- tion. Water was used more slowly from the 0.6 - 0.9 m depth and even more slowly from the 0.9 - 1.2 m depth. After harvest there was generally only sufficient extra water to recharge the 0 - 0.3 m depth by the fall. Soil water distribution with depth and changes from spring to fall were similar for the stubble crop systems F-W-(W) (N+P) and Cont W (N+P) (Figures 3(b)-(c)); therefore, we will only discuss the results for Cont W (N+P). Soil water content and response in the 0 - 0.3 m depth between spring and fall in this system were almost identical to that of a summer fallow crop system F-(W) (N+P) (Figure 3(a)). The stubble crop system, with much less time for soil water to be recharged (8 mo vs 20 mo), had only about 51 mm of water in the 0.3 - 0.6 m depth in spring. There was sufficient precipitation and maybe some drainage from the 0 - 0.3 m depth to slightly increase the soil water content in the 0 - 0.6 m depth to about 55 mm by the five-leaf stage. From the five-leaf to the soft dough stage, soil water in both the 0 - 0.3 and 0.3 - 0.6 m depths decreased sharply and line- arly at the same rate to about 35 mm, which is similar to that for the F-(W) (N+P) system. Thereafter, as for F-(W) (N+P), soil water in the 0 - 0.3 m depth increased, and that of the 0.3 - 0.6 m depth remained constant, until fall. Soil water in the 0.6 - 0.9 m and 0.9 - 1.2 m depths, like in the 0.3 - 0.6 m depth, started the spring with much less water than in F-(W) (N+P). Although this pattern of water loss from these two lower depths mimicked those for the respective depths in F-(W) (N+P), the lower rate of water use by the lower-yielding stubble crop com- pared to the fallow crop (Table 2), resulted in less water being taken-up from these two depths under the stubble crops. Consequently, the soil water contents in these lower depths were generally similar in Cont W (N+P), F- W-(W) (N+P) and F-(W) (N+P) by fall. Soil water content in the 0 - 0.3 m depth under Cont W receiving only P [(Cont W (+P)] (Figure 3(d)) was similar in amounts and distribution with depth as Cont W (N+P) from spring to fall. However, soil water in the 0.3 - 0.6 m depth under Cont W (+P) exceeded that in the 0 - 0.3 m depth from spring to the five-leaf stage constant at about 66 mm). This may be related to the (  R. de Jong et al. / Agricultural Science 2 (2011) 220-237 Copyright © 2011 SciRes. Openly accessible at http://www.scirp.org/journal/AS/ 227227 Tab le 2. Effect of cropping frequency and N fertilizer on above-ground dry matter accumulation at Swift Current, Saskatchewan (1967-1984)a. Dry matter (kg·ha–1) Year Stage F-(W) (N+P) F-W-(W) (N+P)Cont W (N+P)Cont W (+P) PPTb (mm) (Spring to harvest) PETc (mm) (Spring to harvest) 1967 Three-leaf Five-leaf Shot blade Soft dough Harvest 161 606 1474 2984 3401 128 522 1329 2960 3834 111 566 1376 2489 3345 67 345 1032 2210 2687 54 450 1968 Three-leaf Five-leaf Shot blade Soft dough Harvest 84 432 1072 2237 3044 101 432 917 1198 1243 121 502 1169 1306 1261 91 358 764 1346 1315 87 466 1969 Three-leaf Five-leaf Shot blade Soft dough Harvest 101 355 911 2013 4379 104 348 897 2083 3992 108 318 917 2076 4302 101 237 794 2023 3694 135 464 1970 Three-leaf Five-leaf Shot blade Soft dough Harvest 37 348 2060 5107 3410 44 311 1256 3633 3107 54 429 1742 4202 3310 57 452 1882 3473 2486 244 460 1971 Three-leaf Five-leaf Shot blade Soft dough Harvest 50 419 3536 7059 5491 57 375 2267 3667 3405 67 476 2930 3490 3709 71 372 1762 3051 2976 124 522 1972 Three-leaf Five-leaf Shot blade Soft dough Harvest 50 177 897 4082 3360 64 281 1075 4116 3730 60 214 884 3606 2337 60 224 961 3832 2379 155 536 1973 Three-leaf Five-leaf Shot blade Soft dough Harvest 50 991 1799 3596 2888 47 532 1156 3064 2418 37 535 1178 3473 2588 34 465 991 2505 2251 64 503 1974 Three-leaf Five-leaf Shot blade Soft dough Harvest 104 917 2019 4488 5435 104 717 1956 3231 3896 111 791 1979 3483 3778 114 724 1711 3366 3643 258 464 1975 Three-leaf Five-leaf Shot blade Soft dough Harvest 111 1215 3128 5486 3489 101 853 2144 4357 3375 101 747 2164 4756 3870 84 687 1861 3985 3468 210 457 1976 Three-leaf Five-leaf Shot blade Soft dough Harvest 134 515 3610 9417 8053 141 603 3074 6343 5563 148 556 3295 6772 5100 101 489 2368 5486 5030 223 479 1977 Three-leaf Five-leaf Shot blade Soft dough 134 429 2063 8774 74 180 964 7090 84 221 1142 6480 71 207 1175 5419 227 551  R. de Jong et al. / Agricultural Science 2 (2011) 220-237 Copyright © 2011 SciRes. Openly accessible at http://www.scirp.org/journal/AS/ 228 Harvest 7719 5796 5337 4725 1978 Three-leaf Five-leaf Shot blade Soft dough Harvest 57 261 680 3211 5602 77 626 1122 3014 3021 64 483 1089 2388 2892 67 355 754 1953 1902 135 510 1979 Three-leaf Five-leaf Shot blade Soft dough Harvest - 214 1018 4601 4565 - 161 995 2746 3521 - 177 1105 3543 3491 - 207 724 2270 2535 131 487 1980 Three-leaf Five-leaf Shot blade Soft dough Harvest - 321 840 5579 5184 - 174 442 3643 2827 - 108 399 2689 2418 - 148 442 1725 2027 189 550 1981 Three-leaf Five-leaf Shot blade Soft dough Harvest - - - - 6284 - - - - 4282 - - - - 3670 - - - - 2573 211 484 1982 Three-leaf Five-leaf Shot blade Soft dough Harvest 60 416 1185 9353 8742 64 368 1105 6339 6166 77 355 1068 6627 4967 57 315 646 5392 4237 285 466 1983 Three-leaf Five-leaf Shot blade Soft dough Harvest - - - - - 87 375 890 5914 5787 84 375 512 5639 5220 - - - - - 150 441 1984 Three-leaf Five-leaf Shot blade Soft dough Harvest 124 436 2384 4082 3220 114 311 1239 1333 757 94 355 1333 1373 757 121 261 958 1604 990 113 494 Mean Three-leaf Five-leaf Shot blade Soft dough Harvest 90 503 1792 5130 4957 87 422 1343 3808 3706 87 424 1428 3788 3463 78 365 1176 3102 2877 167 488 aSome data, especially in 1981 and 1983, were missing; bPPT = precipitation; cPET = potential evapotranspiration. reduced water uptake by a crop whose early growth is partly restricted by inadequate nitrogen fertility [6]. The pattern of water response in the 0.3 - 0.6 m depth under Cont W (+P) was similar to that of the other cropped systems. Soil water patterns and contents in the 0.6 - 0.9 m and 0.9 - 1.2 m depths under Cont W (+P) were gen- erally similar to those under Cont W (N+P). There was about 45 mm of water in each of these two depths be- tween spring and the shot blade growth stage. There- after, water was slowly and gradually lost from these two depths till harvest, but from the 0.6 - 0.9 m depth moreso than from the 0.9 - 1.2 m depth (Figure 3(d)). No water gains occurred in these lower depths between harvest and fall. 3.2.3. Soil Water Contents during Selected Years In four selected years of varying precipitation, soil water contents in the profile varied from the 18-yr mean pattern (Figure 4). In the period prior to the five-leaf stage and after harvest, the 0 - 1.2 m depth soil water content was mainly related to precipitation. For example, in 1970 the very wet month of June caused the soil water content to increase from 261 mm at the spring sampling to 308 mm at the five-leaf stage (Figure 4(a)). However, in 1976, when spring precipitation was only moderate see Figure 4(b)); the soil water content was fairly con- (  R. de Jong et al. / Agricultural Science 2 (2011) 220-237 Copyright © 2011 SciRes. Openly accessible at http://www.scirp.org/journal/AS/ 229229 Figure 4. Examples of trends in soil water content in the 0 - 1.2 m depth under spring wheat grown on fallow [F-(W) (N+P)] for four typical years (values in brackets are the precipitation totals between spring and fall). stant to the five-leaf stage (Figure 4(b)). Transpiration during this early part of the growing season was gener- ally low. Similarly, precipitation dictated the pattern of soil water trends after the soft dough stage when the crop was no longer withdrawing soil water. In dry years such as 1971 and 1973 when little precipitation fell before the five-leaf stage, the soil water content decreased rapidly from early spring onwards (Figures 4(c)-(d)). In all sys- tems the rapid growth between the five-leaf and soft dough stages (Table 2) was accompanied by a rapid de- crease of soil water, irrespective of the amount of pre- cipitation received, as evapotranspiration far exceeded precipitation. Soil water distribution in the profile from spring to fall under a crop, was similar under F-(W) (N+P) as un- der Cont W (N+P), therefore we show only a couple of examples for Cont W (N+P) for two dry years (1968 and 1973), and for two wet ones (1970 and 1982) (Figure 5). In 1968, 177 mm of precipitation fell between spring and fall, of which almost 90 mm was received outside the growing season, between harvest and fall. (Figure 5(a)). Most of the changes in soil water content occurred in the 0 - 0.3 m depth; after an initial slow decrease from spring to the three-leaf stage, the water content rapidly decreased to near the wilting point by the shot blade stage, remained constant till the soft dough stage and then increased till fall to about 60 mm in response to the 121 mm precipitation received in this late period. The low spring soil water contents in the 0 - 0.3 m and 0.3 - 0.6 m depths reflect the dry conditions of the previous year and the small amount of overwinter precipitation (74 mm between fall and spring) that did not wet the soil beyond the 0.3 m depth. All depths below 0.3 m gradu- ally lost small amounts of water till the shot blade stage, as water use by the crop slightly exceeded the rainfall replenishment. The small amount of water uptake by the crop (133 mm) was reflected in the low total dry matter production [maximum at the soft dough stage, 1306 kg·ha–1 (Table 2)]. The increase in soil water content at the 0.6 - 0.9 m depth between the three- and five- leaf stage may be a sampling error because there was no precipitation during this period. The year 1973 was even drier than 1968, with only 64 mm precipitation well-distributed between spring and harvest (Figure 5(b)). The soil water content in the 0 - 0.3 m depth decreased almost linearly from spring to harvest, and then increased slightly from harvest to fall n response to the late small precipitation events. The i  R. de Jong et al. / Agricultural Science 2 (2011) 220-237 Copyright © 2011 SciRes. Openly accessible at http://www.scirp.org/journal/AS/ 230 Figure 5. Soil water distribution with depth (spring to fall) under stubble wheat [Cont W (N+P)] for two dry (1968 and 1973) and two wet (1970 and 1982) years (values in brackets are the precipitation totals between spring and fall). water content of the 0.3 - 0.6 m depth decreased slowly from spring to the three-leaf stage, then rapidly to the soft dough stage before levelling off at maturity. This pattern reflects plant growth and crop water uptake. Be- cause of low rainfall, the soil water content of the 0.6 - 0.9 m depth remained constant till the five-leaf stage, reflecting the time it takes for roots to reach this depth. Thereafter, water loss was linear to the soft dough stage and more slowly till the fall sampling date. Generally, between the five-leaf stage and harvest, water losses from the 0.3 - 0.6 m depth and from the 0.6 - 0.9 m depth were parallel to each other. In the 0.9 - 1.2 m depth the soil water content remained relatively constant from emergence to the shot blade stage, then decreased slowly, but linearly to harvest and even more slowly till fall. The marked loss of soil water from all four depths from spring to harvest, a total of 194 mm, was reflected in a dry matter production of 3473 kg·ha–1 at the soft dough stage (Table 2), almost three times higher than in 1968. The two wet years shown as examples differed in that 50% (142 mm) of the period precipitation received in 1970 occurred during a single week in June (Figure 5(c)) while the 332 mm of precipitation received in 1982 was well-distributed throughout the period (Figure 5(d)). Thus, plant dry matter production was much greater in 1982 than in 1970 [6627 kg·ha–1 vs 4202 kg·ha–1 at the soft dough stage (Ta bl e 2 )] and presumably evapotran- spiration would also have been much greater in 1982. The balance between evapotranspiration and precipita- tion favoured drainage in 1970 as was evidenced by a rare occurrence under crop when all soil segments to 1.2 m depth (and probably beyond) showed an increase in water content between the three- and five- leaf stage (Figure 5(c)). All soil depths then lost water rapidly between the five-leaf and soft dough stage in 1970, then they remained constant, except for the 0 - 0.3 m depth which gained water between harvest and fall, reflecting the 40 mm of rainfall received in this period. In 1982, the low spring soil water contents in the 0.3 - 1.2 m depth reflect the lower than normal fall soil water contents in 1981 and the small amount of overwinter precipitation (95 mm between fall and spring) that did not wet the soil beyond the 0.3 m depth. Large amounts of precipitation received prior to the five-leaf stage (177 mm) markedly increased the soil water content in the 0 - 0.6 m depth and to a lesser extent that in the 0.6 - 0.9 m depth. However the 80 mm of precipitation received  R. de Jong et al. / Agricultural Science 2 (2011) 220-237 Copyright © 2011 SciRes. Openly accessible at http://www.scirp.org/journal/AS/ 231231 between the shot blade and soft dough stage was more than counter-balanced by high evapotranspiration, and consequently the 0 - 0.9 m depth lost significant amounts of water (82 mm). Between the harvest and fall sampling, when there is no transpiration, the 50 mm precipitation received increased the water content in the 0 - 0.3 m depth by 35 mm, with no wetting below this depth. The soil water content in the 0.9 - 1.2 m depth remained rela- tively constant throughout the growing season, suggest- ing that sufficient water was available for good crop growth in the upper three depths. 3.3. Dry Matter Production and Water Use (WU) We calculated WU and total above-ground dry matter production between spring and each sampling time for Cont W (N+P) and Cont W (+P), in order to assess the influence of N fertilizer on this parameter (Ta b l e 3 and Figure 6). A regression of dry matter accumulated to each growth stage vs WU was linear for both treatments (Figure 6). The y-intercepts were not significantly dif- ferent (P < 0.05), but the regression slopes were signifi- Table 3. Effect of N fertilizer on relationship between total dry matter (TDM) accumulation versus water use (WU), potential evapotranspiration (PET) and relative water use (WU/PET) at Swift Current, Saskatchewan. The values are 18-yr means ρ standard deviation. Change in soil water (0 - 1.2 m depth) Precipitation (Spring to period) WUa (Spring to period) PET (Spring to period) Period Treatment (Spring to period) WU/PET TDM (mm) (kg·ha–1) Spring to three-leaf Cont W (N+P) Cont W (+P) –1 ρ22 –5 ρ21 48 ρ35 48 ρ35 47 ρ26 43 ρ28 143 ρ24 143 ρ24 0.329 ρ0.157 0.301 ρ0.178 87.0 ρ29.2 78.3 ρ24.6 Spring to five-leaf Cont W (N+P) Cont W (+P) –2 ρ34 –11 ρ29 75 ρ48 75 ρ48 73 ρ33 64 ρ34 199 ρ24 199 ρ24 0.367 ρ0.176 0.322 ρ0.179 424 ρ189 365 ρ166 Spring to shot blade Cont W (N+P) Cont W (+P) 20 ρ37 14 ρ34 103 ρ52 103 ρ52 123 ρ39 117 ρ37 264 ρ23 264 ρ23 0.467 ρ0.141 0.443 ρ0.141 1428 ρ780 1176 ρ559 Spring to soft dough Cont W (N+ P) Cont W (+P) 58 ρ30 44 ρ28 155 ρ68 155 ρ68 213 ρ57 199 ρ51 429 ρ34 429 ρ34 0.497 ρ0.132 0.464 ρ0.119 3788 ρ1748 3102 ρ1399 Spring to harvest Cont W (N+P) Cont W (+P) 60 ρ31 48 ρ28 166 ρ67 166 ρ67 226 ρ55 215 ρ52 488 ρ34 488 ρ34 0.463 ρ0.126 0.440 ρ0.115 3463 ρ1289 2877 ρ1124 aWU = (Increase in soil water between spring and a later period) + precipitation received in the period. Figure 6. Effect of N fertilizer on the relationship between dry matter accumulation and water use. 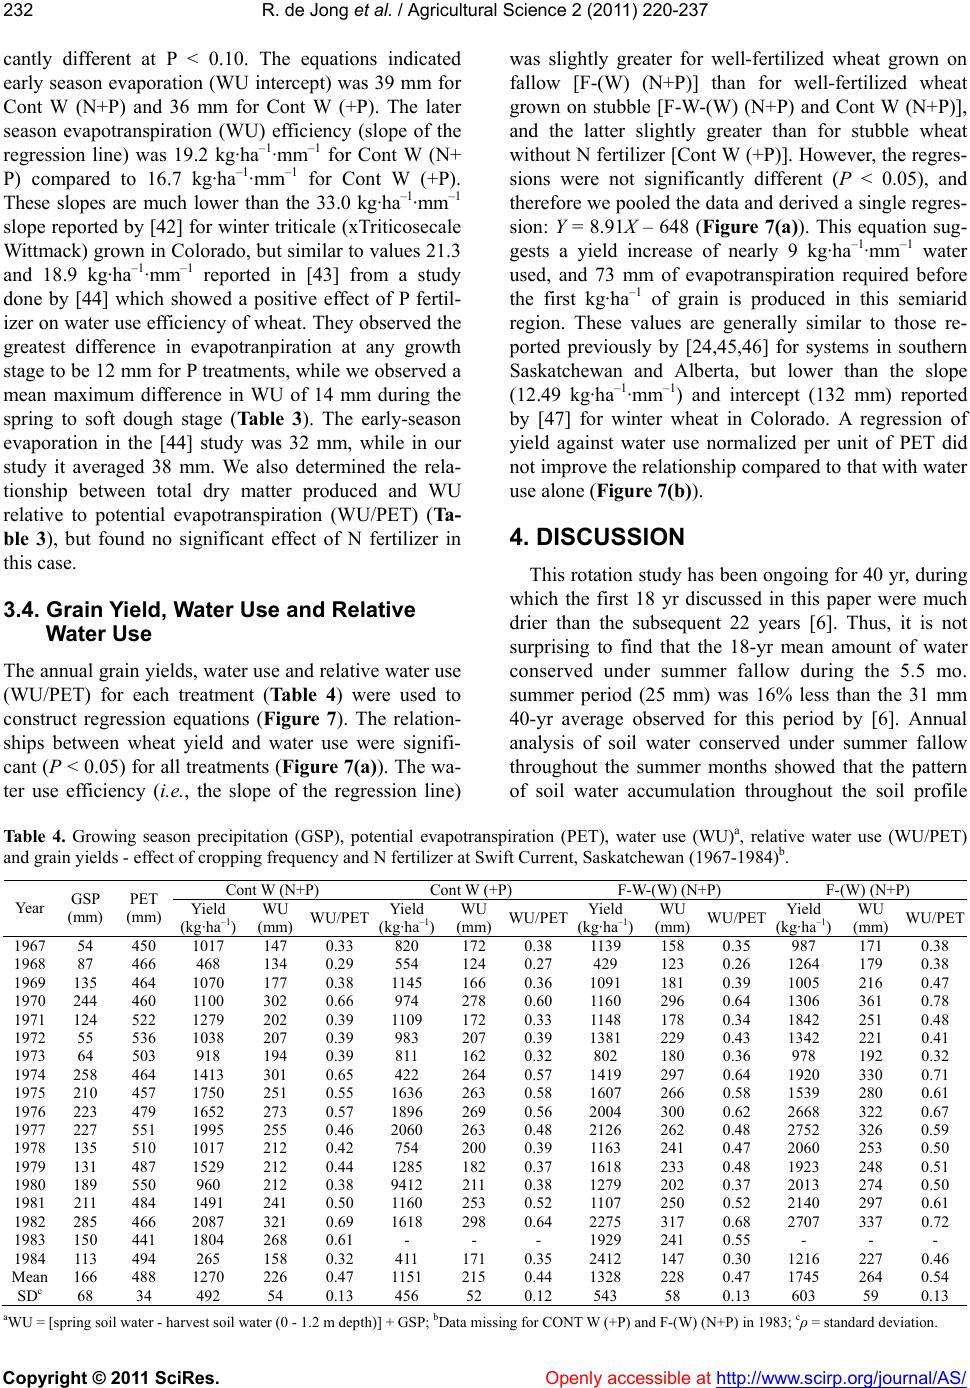 R. de Jong et al. / Agricultural Science 2 (2011) 220-237 Copyright © 2011 SciRes. Openly accessible at http://www.scirp.org/journal/AS/ 232 cantly different at P < 0.10. The equations indicated early season evaporation (WU intercept) was 39 mm for Cont W (N+P) and 36 mm for Cont W (+P). The later season evapotranspiration (WU) efficiency (slope of the regression line) was 19.2 kg·ha–1·mm–1 for Cont W (N+ P) compared to 16.7 kg·ha–1 ·mm–1 for Cont W (+P). These slopes are much lower than the 33.0 kg·ha–1·mm–1 slope reported by [42] for winter triticale (xTriticosecale Wittmack) grown in Colorado, but similar to values 21.3 and 18.9 kg·ha–1·mm–1 reported in [43] from a study done by [44] which showed a positive effect of P fertil- izer on water use efficiency of wheat. They observed the greatest difference in evapotranpiration at any growth stage to be 12 mm for P treatments, while we observed a mean maximum difference in WU of 14 mm during the spring to soft dough stage (Table 3). The early-season evaporation in the [44] study was 32 mm, while in our study it averaged 38 mm. We also determined the rela- tionship between total dry matter produced and WU relative to potential evapotranspiration (WU/PET) (Ta- ble 3), but found no significant effect of N fertilizer in this case. 3.4. Grain Yield, Water Use and Relative Water Use The annual grain yields, water use and relative water use (WU/PET) for each treatment (Table 4) were used to construct regression equations (Figure 7). The relation- ships between wheat yield and water use were signifi- cant (P < 0.05) for all treatments (Figure 7(a)). The wa- ter use efficiency (i.e., the slope of the regression line) was slightly greater for well-fertilized wheat grown on fallow [F-(W) (N+P)] than for well-fertilized wheat grown on stubble [F-W-(W) (N+P) and Cont W (N+P)], and the latter slightly greater than for stubble wheat without N fertilizer [Cont W (+P)]. However, the regres- sions were not significantly different (P < 0.05), and therefore we pooled the data and derived a single regres- sion: Y = 8.91X – 648 (Figure 7(a)). This equation sug- gests a yield increase of nearly 9 kg·ha–1·mm–1 water used, and 73 mm of evapotranspiration required before the first kg·ha–1 of grain is produced in this semiarid region. These values are generally similar to those re- ported previously by [24,45,46] for systems in southern Saskatchewan and Alberta, but lower than the slope (12.49 kg·ha–1·mm–1) and intercept (132 mm) reported by [47] for winter wheat in Colorado. A regression of yield against water use normalized per unit of PET did not improve the relationship compared to that with water use alone (Figure 7(b)). 4. DISCUSSION This rotation study has been ongoing for 40 yr, during which the first 18 yr discussed in this paper were much drier than the subsequent 22 years [6]. Thus, it is not surprising to find that the 18-yr mean amount of water conserved under summer fallow during the 5.5 mo. summer period (25 mm) was 16% less than the 31 mm 40-yr average observed for this period by [6]. Annual analysis of soil water conserved under summer fallow throughout the summer months showed that the pattern of soil water accumulation throughout the soil profile Ta bl e 4 . Growing season precipitation (GSP), potential evapotranspiration (PET), water use (WU)a, relative water use (WU/PET) and grain yields - effect of cropping frequency and N fertilizer at Swift Current, Saskatchewan (1967-1984)b. Cont W (N+P) Cont W (+P) F-W-(W) (N+P) F-(W) (N+P) Year GSP (mm) PET (mm) Yield (kg·ha–1) WU (mm) WU/PET Yield (kg·ha–1) WU (mm) WU/PET Yield (kg·ha–1) WU (mm)WU/PET Yield (kg·ha–1) WU (mm) WU/PET 1967 54 450 1017 147 0.33 820 172 0.38 1139 158 0.35 987 171 0.38 1968 87 466 468 134 0.29 554 124 0.27 429 123 0.26 1264 179 0.38 1969 135 464 1070 177 0.38 1145 166 0.36 1091 181 0.39 1005 216 0.47 1970 244 460 1100 302 0.66 974 278 0.60 1160 296 0.64 1306 361 0.78 1971 124 522 1279 202 0.39 1109 172 0.33 1148 178 0.34 1842 251 0.48 1972 55 536 1038 207 0.39 983 207 0.39 1381 229 0.43 1342 221 0.41 1973 64 503 918 194 0.39 811 162 0.32 802 180 0.36 978 192 0.32 1974 258 464 1413 301 0.65 422 264 0.57 1419 297 0.64 1920 330 0.71 1975 210 457 1750 251 0.55 1636 263 0.58 1607 266 0.58 1539 280 0.61 1976 223 479 1652 273 0.57 1896 269 0.56 2004 300 0.62 2668 322 0.67 1977 227 551 1995 255 0.46 2060 263 0.48 2126 262 0.48 2752 326 0.59 1978 135 510 1017 212 0.42 754 200 0.39 1163 241 0.47 2060 253 0.50 1979 131 487 1529 212 0.44 1285 182 0.37 1618 233 0.48 1923 248 0.51 1980 189 550 960 212 0.38 9412 211 0.38 1279 202 0.37 2013 274 0.50 1981 211 484 1491 241 0.50 1160 253 0.52 1107 250 0.52 2140 297 0.61 1982 285 466 2087 321 0.69 1618 298 0.64 2275 317 0.68 2707 337 0.72 1983 150 441 1804 268 0.61 - - - 1929 241 0.55 - - - 1984 113 494 265 158 0.32 411 171 0.35 2412 147 0.30 1216 227 0.46 Mean SDc 166 68 488 34 1270 492 226 54 0.47 0.13 1151 456 215 52 0.44 0.12 1328 543 228 58 0.47 0.13 1745 603 264 59 0.54 0.13 aWU = [spring soil water - harvest soil water (0 - 1.2 m depth)] + GSP; bData missing for CONT W (+P) and F-(W) (N+P) in 1983; cρ = standard deviation. 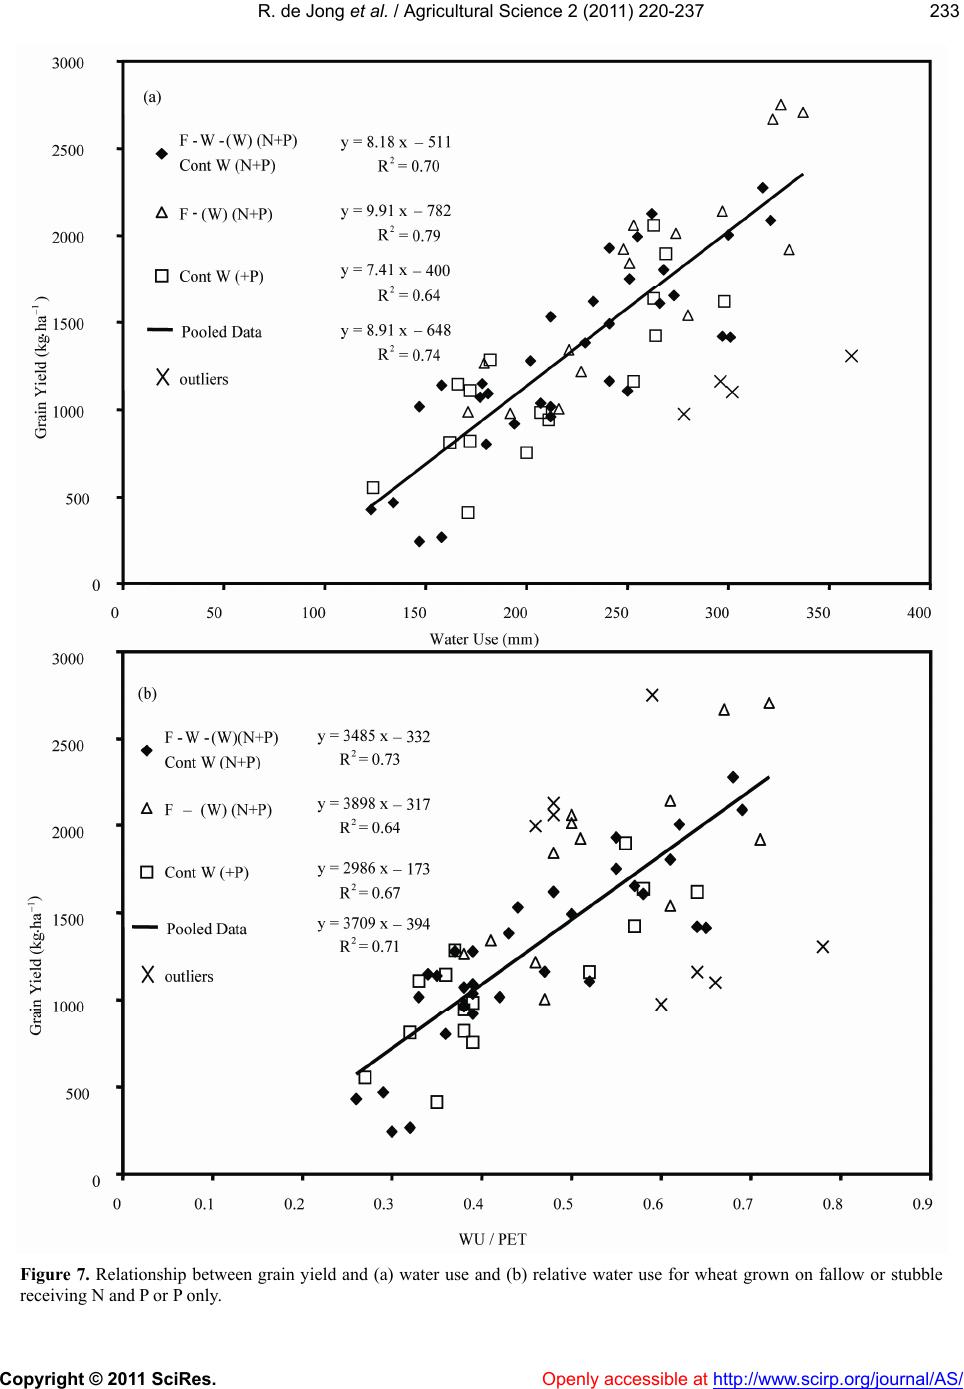 R. de Jong et al. / Agricultural Science 2 (2011) 220-237 Copyright © 2011 SciRes. Openly accessible at http://www.scirp.org/journal/AS/ 233233 Figure 7. Relationship between grain yield and (a) water use and (b) relative water use for wheat grown on fallow or stubble receiving N and P or P only.  R. de Jong et al. / Agricultural Science 2 (2011) 220-237 Copyright © 2011 SciRes. http://www.scirp.org/journal/AS/Openly accessible at 234 was related to the initial water content of the soil and the balance between the amount of precipitation received, its distribution over time, and the strength of the evapora- tive demands. The patterns of soil water accumulation and drying occur first in the uppermost depth and gradu- ally moved later to lower depths, as is assumed in soil water simulation models [41,48,49]. Spring soil water contents under wheat grown on fal- low were 40 mm higher than under stubble crops, and while water remained constant till the five-leaf stage for the former, the stubble crop, with lower soil water re- serves in spring, gained a small amount of water till about the three-leaf stage due to low transpiration rates (caused by minimal crop growth) and low evaporation rates (as a result of low temperatures). Soil water changes under cropped systems mainly showed the influence of precipitation during the periods prior to and after the expansive growth of the crop had occurred (five-leaf to soft dough stages). During the lat- ter period soil water was rapidly lost in all cropped sys- tems despite precipitation. The rate of water loss in this period was greater for F-(W) (N + P) (1.87 mm·day–1) than for Cont W (N + P) (1.23 mm·day–1) which was greater than for Cont W (+P) (1.17 mm·day–1). Under a crop, soil water is used progressively from the uppermost depths, but rarely from the 0.09 - 1.2 m depth, which suggests that deeper rooting crops like winter wheat and/or safflower may be needed in the ro- tation to extract more plant available water. Water re- charge between harvest and fall primarily occurs in the 0 - 0.3 m depth. On one rare occurrence when 142 mm of precipitation was received in early June, 1970, there was evidence that drainage beyond 1.2 m may have occurred under a cropped situation. This supports our findings that there has been little NO3-N leaching from Cont W after 37 yr in this study [50]. Regression analysis showed that withholding N from Cont W was reflected in a reduced rate of above-ground plant biomass production. This supports similar findings by [44] regarding the influence of P on wheat production. Regression analysis also showed that grain yields were directly related to water use, with rates not significantly influenced by cropping frequency nor fertilizer applica- tions, although there was a tendency for a greater water use efficiency for wheat grown on fallow than on stubble, and for well-fertilized Cont W than for Cont W receiving only P fertilizer. In addition to the soil and plant parameters described in this paper, measurements and analyses are available for soil NO3-N [50,51] and bicarbonate extractable P [52, 53] at the same depths and with the same frequency as the soil water content measurements. Analysis of total organic N and C in the upper two soil depths were made at irregular time intervals [54]. N and P concentrations in the above-ground biomass (grain and straw) were meas- ured at different phenological growth stages, for both combine- and hand-harvested data [31,55]. The meas- ured daily meteorological parameters include precipita- tion, maximum and minimum temperatures, global ra- diation and class A pan evaporation. Windspeed and relative humidity data may be obtained from a nearby weather station, located approximately 5 km NE of the experimental plots. Soil and crop management informa- tion on seedbed preparation, seeding, fertilizer and her- bicide application, tillage operations and harvesting are also available [28,56]. While several investigators [40,41,57-60] have used these long term rotation data for testing and validating their models, there is a wealth of information left to be explored. For example, the measured P data have not been used in any modelling exercise. We know of no similar data sets where such detailed measurements have been made for such a lengthy period. Soil and crop mod- ellers are therefore invited to have a look at these in- valuable data sets, and start using them. 5. SUMMARY The effects of cropping frequency and N fertilization on trends in soil water content and water use were quantified using a long-term (18-yr) field experiment in which multiple samplings were made each year. The main findings of this study were: 1) In most years precipitation increased stored soil water during non-cropping periods, (i.e. overwinter and during summer fallow), wetting surface soil layers first and then the lower layers. However, in very dry years summer fallow treatments actually lost soil water. 2) A growing spring wheat crop used stored soil water first from the surface layers and then gradually over time from lower depths. Rarely was water extracted from below 90 cm. 3) Soil water distribution with depth and over time was different in dry years compared to wet ones. 4) Nitrogen fertilization improved (i.e., increased) the slope of the water use/dry matter function. 5) The water use/grain production function was similar to those previously reported for spring wheat in Saska- tchewan and Alberta; it did not vary with cropping intensity, nor with N fertilization. 6) The 18 years of detailed measurements of soil and plant parameters under various cropping systems provide researchers with a unique and invaluable source of information for developing and testing soil-crop-mana- gement simulation models. A copy of the data, including daily weather data, can be obtained from Dr. R. P. Zentner, Semiarid Prairie Agricultural Research Centre,  R. de Jong et al. / Agricultural Science 2 (2011) 220-237 Copyright © 2011 SciRes. Openly accessible at http://www.scirp.org/journal/AS/ 235235 Agriculture and Agri-Food Canada, Swift Current, SK, S9H 3X2, Canada (zentnerr@agr.gc.ca). 6. ACKNOWLEDGEMENTS The authors acknowledge the technical assistance of staff at the Semiarid Prairie Agricultural Research Centre in Swift Current for maintaining the long-term crop rotation experiment and wish to thank Valerie Kirkwood for stenographic assistance. REFERENCES [1] Campbell, C.A., Zentner, R.P., Janzen, H.H. and Bowren, K. E. (1990) Crop rotation studies on the Canadian prai- ries. Canadian Government Publishing Centre, Ottawa. [2] Campbell, C.A., Selles, F., Zentner, R.P, McConkey, B.G., Brandt, S.A. and McKenzie, R.C. (1997) Regression model for predicting yield of hard red spring wheat grown on stubble in the semiarid prairie. Canadian Jour- nal of Plant Science, 77, 43-52. doi:10.4141/P96-043 [3] Campbell, C.A., Zentner, R.P., Gameda, S., Blomert, B. and Wall, D.D. (2002) Production of annual crops on the Canadian prairies: Trends during 1976-1998. Canadian Journal of Soil Science, 82, 45-57. doi:10.4141/S01-046 [4] Bauer, A. (1972) Effect of water supply and seasonal distribution on spring wheat yields. Agricultural Experi- ment Station, North Dakota State University, Fargo, 21. [5] Nielsen, D.C. and Vigil, M.G. (2010) Precipitation stor- age efficiency during fallow in wheat-fallow systems. Agronomy Journal, 102, 537-543. doi:10.2134/agronj2009.0348 [6] De Jong, R., Campbell, C.A., Zentner, R.P., Basnyat, P., Cutforth, H. and Desjardins, R. (2008) Quantifying soil water conservation in the semiarid region of Saskatch- wan, Canada, effect of fallow frequency and N fertilizer. Canadian Journal of Soil Science, 88, 461-475. doi:10.4141/CJSS07098 [7] Hatfield, J.L., Sauer, T.J. and Prueger, J.H. (2001) Man- aging soils to achieve greater water use efficiency: A re- view. Agronomy Journal, 93, 271-280. doi:10.2134/agronj2001.932271x [8] Nielsen, D.C., Unger, P.W. and Miller, P.R. (2005) Ef- ficient water use in dryland cropping systems in the Great Plains. Agronomy Journal, 97, 364-372. doi:10.2134/agronj2005.0364 [9] Bauer, A. (1980) Responses of tall and semidwarf hard red spring wheats to fertilizer nitrogen rates and water supply in North Dakota 1969-1974. North Dakota Agri- cultural Experiment Station, Bulletin, 112. [10] Tanaka, D.L. (1990) Topsoil removal influences on spring wheat water use efficiency and nutrient concentra- tion and content. Transactions of the American Society of Agricultural Engineers, 33, 1518-1524. [11] Campbell, C.A., Zentner, R.P., Selles, F., Biederbeck, V.O. and Leyshon, A.J. (1992) Comparative effects of grain lentil-wheat and monoculture wheat on crop pro- duction, N economy and N fertility in a Brown Cher- nozemic soil. Canadian Journal of Plant Science, 72, 1091-1107. doi:10.4141/cjps92-135 [12] Deibert, E.J., French, E. and Hoag, B. (1986) Water storage and use by spring wheat under conventional till- age and no-till in continuous and alternate crop-fallow systems in the northern Great Plains. Journal of Soil and Water Conservation, 41, 53-58. [13] Azooz, R.H. and Arshad, M.A. (1998) Effect of tillage and residue management on barley and canola growth and water use efficiency. Canadian Journal of Soil Sci- ence, 78, 649-656. doi:10.4141/S97-098 [14] Norwood, C.A. (1999) Water use and yield of dryland row crops as affected by tillage. Agronomy Journal, 91, 108-115. doi:10.2134/agronj1999.00021962009100010017x [15] Campbell, C.A., VandenBygaart, A.J., Grant, B., Zent- ner, R.P., McConkey, B.G., Smith, W., Lemke, R. and Gregorich, E.G. (2007) Quantifying carbon sequestration in a conventionally tilled crop rotation study in south- western Saskatchewan. Canadian Journal of Soil Science, 87, 23-38. doi:10.4141/S06-015 [16] Lenssen, A.W., Johnson, G.D. and Carlson, G.R. (2007) Cropping sequence and tillage system influences annual crop production and water use in semiarid Montana, USA. Field Crops Research, 100, 32-43. doi:10.1016/j.fcr.2006.05.004 [17] De Jong, E. and Cameron, D.R. (1980) Efficiency of water use by agriculture for dryland crop production. Prairie Production Symposium, Soils and Land Re- sources, Advisory Comm. to Canadian Wheat Board. University of Saskatchewan, Saskatoon. 29-31 October . [18] Hupet, F.and Vanclooster, M. (2002) Intraseasonal dy- namics of soil moisture variability within a small agri- cultural maize cropped field. Journal of Hydrololy, 261, 86-101. doi:10.1016/S0022-1694(02)00016-1 [19] Kersebaum, K.C., Lorenz, K., Reuter, H.I., Wendroth, O., Giebel, A. and Schwarz, J. (2003) Site specific nitrogen fertilisation recommendations based on simulation. Pre- cision Agriculture. In: Stafford, J., Werner, A., Eds., Pro- ceeding of the 4th European Conference on Precision Agriculture, Wageningen Academic Publishers, Wagen- ingen, 309-314. [20] Heineman, A.B., Hoogenboom, G. and de Faria, R.T. (2002) Determination of spatial water requirements at county and regional levels using crop models and GIS. An example for the state Parana, Brazil. Agricultural Water Management, 52, 177-196. doi:10.1016/S0378-3774(01)00137-8 [21] Kiniry, J.R., Arnold, J.G. and Xie, Y. (2002) Applications of models with different spatial scales. In: Ahuja, L. R., Ma, L. and Howell, T. A., Eds., Agricultural System Models in Field Research and Technology Transfer, Lewis Publishers, Boca Raton, 207-227. doi:10.1201/9781420032413.ch10 [22] Kersebaum, K.C., Steidl, J., Bauer, O. and Piorr, H.P. (2003) Modelling scenarios to assess the effects of dif- ferent agricultural management and land use options to reduce diffuse nitrogen pollution into the river Elbe. Physics and Chemistry of the Earth, 28, 537-545. [23] Campbell, C.A., Zentner, R.P. and Steppuhn, H. (1987) Effect of crop rotations and fertilizers on moisture con- served and by moisture use by spring wheat in south- western Saskatchewan. Canadian Journal of Soil Science, 67, 457-472. doi:10.4141/cjss87-044 [24] Campbell, C.A., Zentner, R.P. and Johnson, P.J. (1988) Effect of crop rotation and fertilization on the quantita-  R. de Jong et al. / Agricultural Science 2 (2011) 220-237 Copyright © 2011 SciRes. Openly accessible at http://www.scirp.org/journal/AS/ 236 tive relationship between spring wheat yield and mois- ture use in southwestern Saskatchewan. Canadian Jour- nal of Soil Science, 68, 1-16. doi:10.4141/cjss88-001 [25] Ayers, K.W., Acton, D.F. and Ellis, J.G. (1985) The soils of the Swift Current Map Area 72J Saskatchewan. Ex- tension Division, University of Saskatchewan. [26] Canada Soil Survey Committee, Subcommittee on Soil Classification (1978) The Canadian system of soil classi- fication. Canada Department of Agriculture, Supply & Services Canada, Ottawa,164-166. [27] Pelton, W.L., Campbell, C.A. and Nicholaichuk, W. (1967) The influence of freezing and thawing on soil moisture. Proceedings of Hydrology Symposium, No. 6, Soil Moisture, National Research Council of Canada, Ot- tawa, 241-263. [28] Campbell, C.A., Read, D.W.L., Biederbeck, V.O. and Winkleman, G.E. (1983) The first 12 years of a long- term crop rotation study in southwestern Saskatchewan - Nitrate-N distribution in a soil and N uptake by the plant. Canadian Journal of Soil Science, 63, 563-578. doi:10.4141/cjss83-058 [29] Campbell, C. A., Read, D. W. L., Zentner, R. P., Leyshon, A.J. and Ferguson, W.S. (1983) First 12 years of a long term crop rotation study in southwestern Saskatchewan – yield and quality of grain. Canadian Journal of Plant Science, 63, 91-108. [30] Campbell, C. A., Zentner, R. P., Selles, F., Biederbeck, V. O., McConkey, B. G., Lemke, R. and Gan, Y.T. (2004) Cropping frequency effect on yields of grain, straw, plant N, N balance and annual production of spring wheat in the semiarid prairie. Canadian Journal of Plant Science, 84, 487-501. doi:10.4141/P03-078 [31] Campbell, C. A., Zentner, R. P., Selles, F., Jefferson, P. G., McConkey, B. G. Lemke, R. and Blomert, B. J. (2005) Long-term effect of cropping systems and nitrogen and phosphorus fertilizer on production and nitrogen econ- omy of grain crops in a Brown Chernozem. Canadian Journal of Plant Science, 85, 81-93. doi:10.4141/P03-215 [32] Saskatchewan Soil Testing Laboratory (1990) Nutrient requirements guidelines for field crops in Saskatchewan. University of Saskatchewan, Saskatoon, 33. [33] Saskatchewan Agriculture (1988) General recommenda- tions for fertilization in Saskatchewan. Saskatchewan Agriculture, Soils and Crops Branch, Saskatoon, Adgex 541. [34] Campbell, C.A. and Zentner, R.P. (1996) Disposition of nitrogen in the soil-plant system for flax and spring wheat-containing rotations in the Brown soil zone. Cana- dian Journal of Plant Science, 76, 407-412. doi:10.4141/cjps96-072 [35] Large, E.C. (1954) Growth stages in cereals-illustration of the feekes scale. Plant Pathology, 3, 128-129. doi:10.1111/j.1365-3059.1954.tb00716.x [36] Ritchie, J. T. (1981) Soil water availability. Plant and Soil, 50, 327-338. doi:10.1007/BF02180061 [37] Campbell, C.A., de Jong, R. and Zentner, R.P. (1984) Effect of cropping, summerfallow and fertilizer nitrogen on nitrate-nitrogen lost by leaching on a Brown Cher- nozemic loam. Canadian Journal of Soil Science, 64, 61- 74. doi:10.4141/cjss84-006 [38] Baier, W. and Robertson, G.W. (1965) Estimation of la- tent evaporation from simple weather observations. Ca- nadian Journal of Plant Science, 45, 276-284. doi:10.4141/cjps65-051 [39] Baier, W. (1971) Evaluation of latent evaporation esti- mates and their conversion to potential evaporation. Ca- nadian Journal of Plant Science, 51, 255-266. doi:10.4141/cjps71-053 [40] Akinremi, O.O., Jame, Y.W., Campbell, C.A., Zentner, R.P., Chang, C. and de Jong, R. (2005) Evaluation of LEACHMN under dryland conditions. I. Simulation of water and solute transport. Canadian Journal of Soil Sci- ence, 85, 223-232. doi:10.4141/S03-076 [41] Kersebaum, K.C., Wurbs, A., de Jong, R., Campbell, C. A., Yang, J. and Zentner, R.P. (2008) Long-term simula- tion of soil-crop interactions in semiarid southwestern Saskatchewan, Canada. European Journal of Agronomy, 28, 1-12. doi:10.1016/j.eja.2008.01.011 [42] Nielsen, D.C., Vigel, M.F. and Benjamin, J.G. (2006) Forage yield response to water use for dry land corn, mille, and triticale in the central Great Plains. Agronomy Journal, 98, 992-998. doi:10.2134/agronj2005.0356 [43] Ritchie, J.T. (1983) Efficient water use in crop produc- tion: discussion on the generality of relations between biomass production and evapotranspiration. In: Taylor, H.M., et al., Eds., Limitations to Efficient Water Use in Crop Production, American Society of Agronomy, Madison, 29-44. [44] Power, J.F., Grunes, D.L. and Reichmann, G.A. (1961) The influence of phosphorus fertilization and moisture on growth and nutrient absorption by spring wheat: I. Plant growth, N uptake and moisture use. Soil Science Society of America Proceedings, 25, 207-210. doi:10.2136/sssaj1961.03615995002500030020x [45] Staple, W.J. and Lehane, J.J. (1954) Wheat yield and use of moisture on substations in southern Saskatchewan. Canadian Journal of Agricultural Science, 34, 460-468. [46] Henry, J.L., Bole, J.B. and McKenzie, R.C. (1986) Effect of nitrogen water interactions on yield and quality of wheat in Western Canada. In: Slinkard, A. E. and Fowler, D. B., Eds., Wheat production in Canada—a review. Proceedings Canadian Wheat Production Symposium, 3-5 March 1986, Saskatoon, 165-191. [47] Nielsen, D.C., Vigel, M.F. and Benjamin, J.G. (2010) Evaluating decision rules for dryland rotation crop selec- tion. Field Crops Research, 102, 254-26. [48] Li, K.Y., de Jong, R. and Boisvert, J.B. (2001) An ex- ponential root-water-uptake model with water stress compensation. Journal of Hydrology, 252, 189-204. doi:10.1016/S0022-1694(01)00456-5 [49] De Jong Van Lier, Q., Van Dam, J.C., Metselaar, K., De Jong, R. and Duijnisveld, W.H.M. (2008) Macroscopic root water uptake distribution using a matric flux poten- tial approach. Vadose Zone Journal, 7, 1065-1078. doi:10.2136/vzj2007.0083 [50] Campbell, C.A., Selles, F., Zentner, R.P, De Jong, R., Lemke, R. and Hamel, C. (2006) Nitrate leaching in the semiarid prairie, effect of cropping frequency, crop type, and fertilizer after 37 years. Canadian Journal of Soil Science, 86, 701-710. doi:10.4141/S05-008 [51] Campbell, C.A., Zentner, R.P., Basnyat, P., de Jong, R., Lemke, R., Desjardins, R. and Reiter, M. (2008) Nitrogen mineralization under summer fallow and continuous  R. de Jong et al. / Agricultural Science 2 (2011) 220-237 Copyright © 2011 SciRes. http://www.scirp.org/journal/AS/Openly accessible at 237237 wheat in the semiarid Canadian prairie. Canadian Jour- nal of Soil Science, 88, 681-696. doi:10.4141/CJSS07115 [52] Campbell, C.A., Read, D.W., Winkleman, G.E. and McAndrew, D.W. (1984) First 12 years of a long-term crop rotation in southwestern Saskatchewan—P distribu- tion in soil and P uptake by the plant. Canadian Journal of Soil Science, 64, 125-137. doi:10.4141/cjss84-012 [53] Zentner, R.P., Campbell, C.A. and Selles, F. (1993) Build-up in soil available P and yield response of spring wheat to seed-placed P in a 24-year study in the Brown Soil zone. Canadian Journal of Soil Science, 73, 173- 181. doi:10.4141/cjss93-020 [54] Campbell, C.A., Zentner, R.P., Basnyat, P., Wang, H., Selles, F., McConkey, B.G., Gan, Y.T. and Cutforth, H.W. (2007) Water use efficiency and water and nitrate dis- tribution in soil in the semiarid prairie, effect of crop type over 21 years. Canadian Journal of Plant Science, 87, 815-827. doi:10.4141/CJPS06034 [55] Selles, F., Campbell, C.A., Zentner, R.P., James, D. and Basnyat, P. (2007) Withholding phosphorus after long- term additions—soil and responses. Better Crops with Plant Food, 91, 19-21. [56] Zentner, R.P. and Campbell, C.A. (1988) First 18 years of a long term crop rotation in southwestern Saskatch-wan- yields, grain protein, and economic performance. Cana- dian Journal of Plant Science, 68, 1-21. doi:10.4141/cjps88-001 [57] De Jong, R. (1988) Comparison of two soil-water models under semi-arid growing conditions. Canadian Journal of Soil Science, 68, 17-27. doi:10.4141/cjss88-002 [58] Roloff, G., de Jong, R., Zentner, R.P., Campbell, C.A., and Benson, V.W. (1998) Estimating spring wheat yield variability with EPIC. Canadian Journal of Soil Science, 78, 541-549. doi:10.4141/S97-063 [59] Roloff, G., de Jong, R., Campbell, C.A., Zentner, R.P. and Benson, V.M. (1998) EPIC estimates of soil water, nitro- gen and carbon under semiarid temperate conditions. Canadian Journal of Soil Science, 78, 551-562. doi:10.4141/S97-064 [60] Campbell, C.A., Zentner, R.P., Selles, F., Liang, B.C. and Blomert, B. (2001) Evaluation of a simple model to de- scribe carbon accumulation in a Brown Chernozem under varying fallow frequency. Canadian Journal of Soil Sci- ence, 81, 383-394. doi:10.4141/S00-082
|