Vol.3, No.8, 728-732 (2011) Natural Science
http://dx.doi.org/10.4236/ns.2011.38096
Copyright © 2011 SciRes. OPEN ACCESS
Nonlinear characterization and optical switching in
bromophenol blue solutions
Fryad Henari
Department of Basic Medical Sciences, Royal College of Surgeons in Ireland, Medical University of Bahrain, Bahrain;
fzhenari@rcsi-mub.com
Received 2 May 2011; revised 10 April 2011; accepted 22 April 2011.
ABSTRACT
In this paper the results from investigations of
the nonlinear refractive index and nonlinear
absorption coefficient of Bromophenol Blue
using the Z-scan technique with a continuous
wave laser beam at wavelengths 488 nm and
514 nm are presented. It was observed that the
material exhibited reverse saturation absorption
and self defocusing behavior. It was found that
the increase in solution concentration resulted
in linear increase of the nonlinear refractive in-
dex. A pump and probe technique was used to
obtain the absorption spectrum of triplet state.
Furthermore the nonlinear absorption effect
was used to demonstrate all optical switching.
Keywords: Nonlinear Refractive Index; Nonlinear
Absorption; Bromophenol Blue; Cross Phase
Modulation; Optical Switching
1. INTRODUCTION
In recent decades, there has been considerable interest
in searching for materials exhibiting nonlinear optical
effects. The application of these effects to photonic de-
vices and optical limiting is of great importance for fu-
ture technologies These effects are important for use in
applications such as photonic devices and optical limit-
ing [1-5]. The basic properties that are required for
nonlinear properties include large nonlinearity and fast
response time [6]. A large number of materials have
been investigated for example liquid crystals, fullerenes,
nanoparticles, organic materials and natural substances
such as Chinese tea, Chinese herbal medicine, and solu-
tions of chlorophyll. These materials have been used for
application such as optical limiting, optical switching,
self actions such as phase modulation, cross phase
modulation and self trapping [7,8].
In this paper, the experimental measurements of the
nonlinear refractive index n2 and nonlinear absorption
coefficient β of Bromophenol blue solutions using Z-
scan technique are reported [9]. The measurements were
performed with the continuous wave (cw) argon ion la-
ser at two different wavelengths 488 nm and 514 nm.
We also report observation of phase modulation, cross
phase modulation and optical switching. The origin of
the observed nonlinearities of the BPB is also discussed.
2. ABSORPTION SPECTRUM
Bromophenol Blue (BPB) (Tetrabromophenolsul-
fonphthalein) is a halochromic chemical that indicates,
the degree of acidity or basicity of a solution through
characteristic colour changes [10]. A general structure
and formula of the BPB are shown in Figure 1. The BPP
samples at four concentrations of 0.1, 0.15, 0.2 and 0.4
g/L were prepared in ethanol to give a solution with a
yellowish colour. The samples were placed in a 1 mm
thick quartz cuvette. The ground state S0 – S1 absorp-
tion spectra of BPB solution at concentration of 0.2 g/L
were recorded and the absorption peak is found to occur
at λ = 420 nm as shown in Figure 1(a). The absorption
spectrum of T1 excited state was obtained through the
following procedure: An argon ion cw laser beam of
wavelength 488 nm (close to resonance) was used as a
pump (excitation source) and was focused by a lens of 5
cm focal length to the beam waist of 30 μm. A Halogen
lamp was used as probe beam and focused on the sample
by the same lens.
The sample is moved to a postfocusing position
(minimum transmission in Z scan experiment (see be-
low). The intensity change of the probe beam was de-
tected by CCD spectrometer (Model BRC112E-USB-
Vis NIR) and transferred to a computer. The population
of triplet exactions achieved by population of S1 state
through excitation of the S0 – S1 transition by cw exci-
tation beam, where the S1 states undergo intersystem
crossing, producing population in T1 states. Because of
the long lifetime of T1 state, its population dominates
that of other excited states. Figure 1(b) shows the T1
absorption spectrum of BPB in ethanol. A absorption
F. Henari / Natural Science 3 (2011) 728-732
Copyright © 2011 SciRes. OPEN ACCESS
729729
300 400 500 600 700 800900
0.0
0.5
1.0
1.5
2.0
O
S
O
O
Br
OH
Br
Br
OH
Br
Absorbance (AU)
wavelength (nm)
a
(a)
500 600 700 800 90010001100
1.0
1.5
2.0
2.5
3.0
3.5
Absorbance (AU)
Wavelength (nm)
b
(b)
Figure 1. (a) Ground state absorption spectrum, (b) Triplet
state absorption spectrum (AU) of bromophenol blue.
peak occurs at 590 nm.
3. EXPERIMENTS
The nonlinear coefficients of the BPB samples were
measured by the Z-scan technique. Z-scan is a well-
known technique that allows the simultaneous measure-
ment of both nonlinear absorption coefficient (β) and the
nonlinear refractive coefficient (n2). The Z-scan tech-
nique relies on the fact that the intensity varies along the
axis of the convex lens and is maximum at the focus.
Hence, by shifting the sample through the focus, the
nonlinear absorption and the nonlinear refraction can be
measured by observing the spot size variation at the
plane of finite aperture/detector combination.
The experiment was performed with an air-cooled Ar
ion laser beam operating at 488 nm and 514 nm with an
average power of 5 - 40 mW. The beam was focused to a
beam waist of 30 μm with a lens of 5 cm focal length,
giving a typical power density of 1.42 × 10⁷ – 1.00 ×
10–8 W/m2. The sample was placed in 1 mm thick quartz
cuvette and positioned on the translation stage. The
transmission for the sample was measured with and
without an aperture in the far-field of the lens, as the
sample moved through the focal point. This enables the
nonlinear refractive index (closed aperture) to be sepa-
rated from that of the nonlinear absorption (open aper-
ture).
4. RESULTS AND DISCUSSION
Figure 2 shows the normalizing transmission for open
aperture case. The transmission is symmetric with re-
spect to the focus (z = 0), where it has minimum trans-
mission. This is an indicative that the sample exhibits
reverse saturation absorption, (RSA) (optical limiting).
The conditions required for RSA are as follows: 1) Inci-
dent photons with the same wavelength can be absorbed
by molecules in the ground state and also by excited
states. 2) The absorption of the excited states must be
larger than that of the ground state. For most organic
molecules excited by a laser wavelength of weak ground
state absorption, these conditions usally can be met.
Open aperture Z-scan was performed also with a pure
solvent. In this case, no nonlinear absorption was ob-
served within the limit of the intensity used in the ex-
periment. We conclude that the effect seen is due to BPB
The normalize transmittance for the open aperture is
given by [9].


2
11
Tz
x

(1)
-15 -10-5051015
0.75
0.80
0.85
0.90
0.95
1.00
1.05
Normalized transmission
z (mm)
Figure 2. Normalized transmittance (open aperture) of Bro-
mophenol blue for 0.2 g/l solution at an incident intensity I =
4.27 × 10⁷ W/m2 at λ = 488 nm. The solid line is a fit of the
data to Equation (1).
F. Henari / Natural Science 3 (2011) 728-732
Copyright © 2011 SciRes. OPEN ACCESS
730
where x = z/zo (with 2
π
oo
zw
) is the diffraction
length of the Gaussian beam, wo is the beam waist and
is the nonlinear phase change. The nonlinear ab-
sorption
is then related to
by [9]

22
1l
o
Ie
(2)
where α is the linear absorption coefficient at λ =488 nm
(α = 0.235/mm) and l is the thickness of the sample and
Io is the peak intensity at the focus. A fit of Equation (1)
to the experimental data is depicted in the Figure 2, and
yields the value of nonlinear absorption β = 4.28 × 10⁻³
cm/W. This value is in the same of the nonlinear absorp-
tion measured for zinc porphyrin polymer and triphenyl-
methane measured with the z-scan method [10,11] and
two orders higher than fast green FCF dye observed un-
der cw excitation at 633 nm [12].
Figure 3 shows the normalizing transmission for a
closed aperture case at λ = 514 nm for a solution with a
concentration of 0.1 g/l solution at an incident intensity
I = 1.4 × 10⁷ W/m2. The peak valley configuration indi-
cates that the sign of the nonlinear refractive index n2 is
negative (self-defocusing occurs).
The difference between normalized peak-valley trans-
mittance ΔTp – v is given by

0.25
0.4061
pv
Ts
  (3)
where
is the on axis nonlinear phase shift at focus,
s is the nonlinear transmittance of the aperture and is
given by

22
1exp 2
s
rw  here r is the radius of
the aperture and w is the radius of the beam at the en-
trance of the aperture.
The nonlinear refractive index n2 is related to
by

22π1l
o
nIe

(4)
where α is the linear absorption coefficient, l is the
thickness of the sample, Io is the peak intensity at the
focus, and l is the wavelength of the laser beam.
Equations3 and 4 were used to calculate the value of
the nonlinear refractive index and it was found to be n2 =
7.76 × 10⁻⁸ cm2·W–1. This value is three orders higher
than the nonlinear refractive index measured for C60
with z-scan method [13] and in agreement with results
measured in ref. [11,12,14].
The nonlinear refractive index dependence on con-
centration of the BPB solution was investigated. Figure
4 shows the nonlinear refractive index as a function of
concentration at an incident intensity of 2.83 × 10⁷ W/m2.
It has been found that the nonlinear refractive index is
linearly dependent on the concentration with the range of
the concentrations studied. One can conclude that the
-60 -40 -2002040
0.0
0.5
1.0
1.5
2.0
2.5
Normalized Transmission
Z (mm)
Figure 3. Normalized transmittance (closed aperture) of Bro-
mophenol Blue for 0.2 g/l solution at an incident intensity I =
4.27 × 10⁷ W/m2 at λ = 514 nm.
0.10 0.15 0.20 0.25 0.30 0.35 0.40
6
7
8
9
10
11
12
13
14
Nonlinear refractive index n2 x10-8 cm2/W
concentration (g/L)
Figure 4. Nonlinear refractive index n2 as a function of con-
centration for Bromophenol blue solution.
higher concentration of the sample gives higher nonlin-
earities. Experiments were performed to study the con-
centration dependence on the nonlinear absorption coef-
ficient and it has been found that the nonlinear absorp-
tion coefficient is linearly dependent on the concentra-
tion. In fact, the nonlinear absorption coefficient is more
easily obtained at higher concentration. The increase of
n2 and β with increase of concentration may arise from
the fact that the number of BPB molecules increases as
the concentration increases, therefore more molecules
are thermally agitated resulting in an increase of nonlin-
ear effects.
Nonlinear optical phenomena can be due to: electronic
and non-electronic processes [15]. The former refers to
those radiative interactions between the active electron
and the optical electric field. Usually, they are very fast,
of the order of ps. The latter refers to thermal processes
F. Henari / Natural Science 3 (2011) 728-732
Copyright © 2011 SciRes. OPEN ACCESS
731731
due effect of heating (due light absorption). Usually they
are slow, of the order of ms. The type of the laser used in
this experiment to probe the nonlinear effects of the ma-
terial is a cw laser. Therefore the optical nonlinearities
observed in this experiment may be of thermal origin
and arising from thermally induced refractive index
changes. The nonlinear absorption may arise according
to the Kramers-Kroing relation, which states that the
change in the refractive index at any frequency is asso-
ciated with a change of the absorption coefficient. The
time resolved Z scan method was also performed at dif-
ferent chopping frequencies all showing the maximum
transmittance (peak) followed by minimum transmission
(valley). No discrimination on the sequences of peak and
valley were observed, usually for electronic nonlineari-
ties (valley first then peak) and thermal nonlinearities
(peak followed by valley). This is another indication that
the nonlinear optical response is predominately of ther-
mal origin.
To investigate a cross phase modulation (XPM), the Z
scan experiment was performed with a pump and probe
beams. Cross-phase modulation is the change in the op-
tical phase of a light beam caused by the interaction with
another beam in a nonlinear medium. This can be de-
scribed as a change in the refractive index, 2
2o
nnI
where n2 is the nonlinear refractive index of the material
and o
I
is the intensity of pump beam which causes a
refractive index change for probe beam. In this experi-
ment, the pump beam was Argon Ion (λ = 488 nm,
power 20 mW) and the probe beam was He-Ne (λ = 633
nm, power 0.5 mW). The two beams propagate simulta-
neously at the same direction in the nonlinear medium.
The pump, which produces the effect, was blocked by
the filter and monochromater and the intensity of the
probe beam was monitored as the sample moved through
the plane of the lens. The maximum transmission (peak)
followed by the minimum transmission (valley) was
observed. The observed behaviour is due to cross-phase
modulation from pump beam to probe beam [7,16]. We
believe in this case the thermal lens (TL) effect is re-
sponsible for above observation; however, further ex-
periments are needed to investigate the mechanism in-
volved in XPM. Figure 5 shows typical z scan results
and used to determine the nonlinear refractive index for
SPM (z scan with pump beam only) and XPM (z scan
with pump and probe). The nonlinear coefficient can be
calculated using Equations (3) and (4), for pump beam
n2 = 7.7 × 10⁻⁸ cm2/W and for probe beam (with pump is
on) n2 = 3.4 × 10⁻⁸ cm2/W. Please note the value n2 for
XPM is nearly one order lower.
The pump and probe experiment was used to demon-
strate inverted optical switching. In the experiment a cw
argon ion laser beam of wavelength 488 nm and power
-60 -40 -200204060
0.0
0.2
0.4
0.6
0.8
1.0
1.2
1.4
1.6
1.8
2.0
Normalized Transmission
Z (mm)
SPM
XPM
Figure 5. Normalized transmission (closed aperture) of bro-
mophenol blue with pump beam only (SPM, diamonds) and
with pump and probe beams (XPM, squares).
20 mW was used as a pumping beam and was focused
with a lens of 5 cm to a beam waist of 30 mm. A weak
laser beam of wavelength 633 nm and power = 0.5 mW
from HeNe laser was used as a probe beam and focused
on the sample by the same lens. The pump beam was
modulated with mechanical chopper beam.
The mechanism of optical switching which is based
on nonlinear absorption and maybe explained as follows:
The absorption spectra of BPB of the ground state S0
and triplet state T1 are different. Absorption of the T1
state is much higher in the region of 600 nm than that of
the ground state S0, (see Figure 1). The cw probe beam
with a wavelength (λ = 633 nm) off absorption peak of
the ground state but close to the absorption peak of trip-
let state T1 passes through the sample; the output inten-
sity is in the switch-on states because of lower linear
absorption and higher transmittance of 633 nm. When
the sample is pumped by a strong laser beam with
wavelength of 488 nm, the population of T1 is greatly
enhanced through intersystem crossing from S state to
triplet T state. The probe beam is intensively absorbed.
The output intensity would be in the switched off state.
Figure 6 shows the oscilloscope trace (below) of tran-
sient optical inversion switching.
5. CONCLUSIONS
In conclusion, nonlinear absorption coefficient and
nonlinear refractive index have been investigated for
BPB solution using Z scan experiment at wavelengths
488 nm and 514 nm. The Z-scan measurements indicated
that the BPB exhibited large nonlinear optical properties.
We have shown that the nonlinear absorption can be
attributed to a reverse saturation absorption process (op-
F. Henari / Natural Science 3 (2011) 728-732
Copyright © 2011 SciRes. OPEN ACCESS
732
50
ms/div
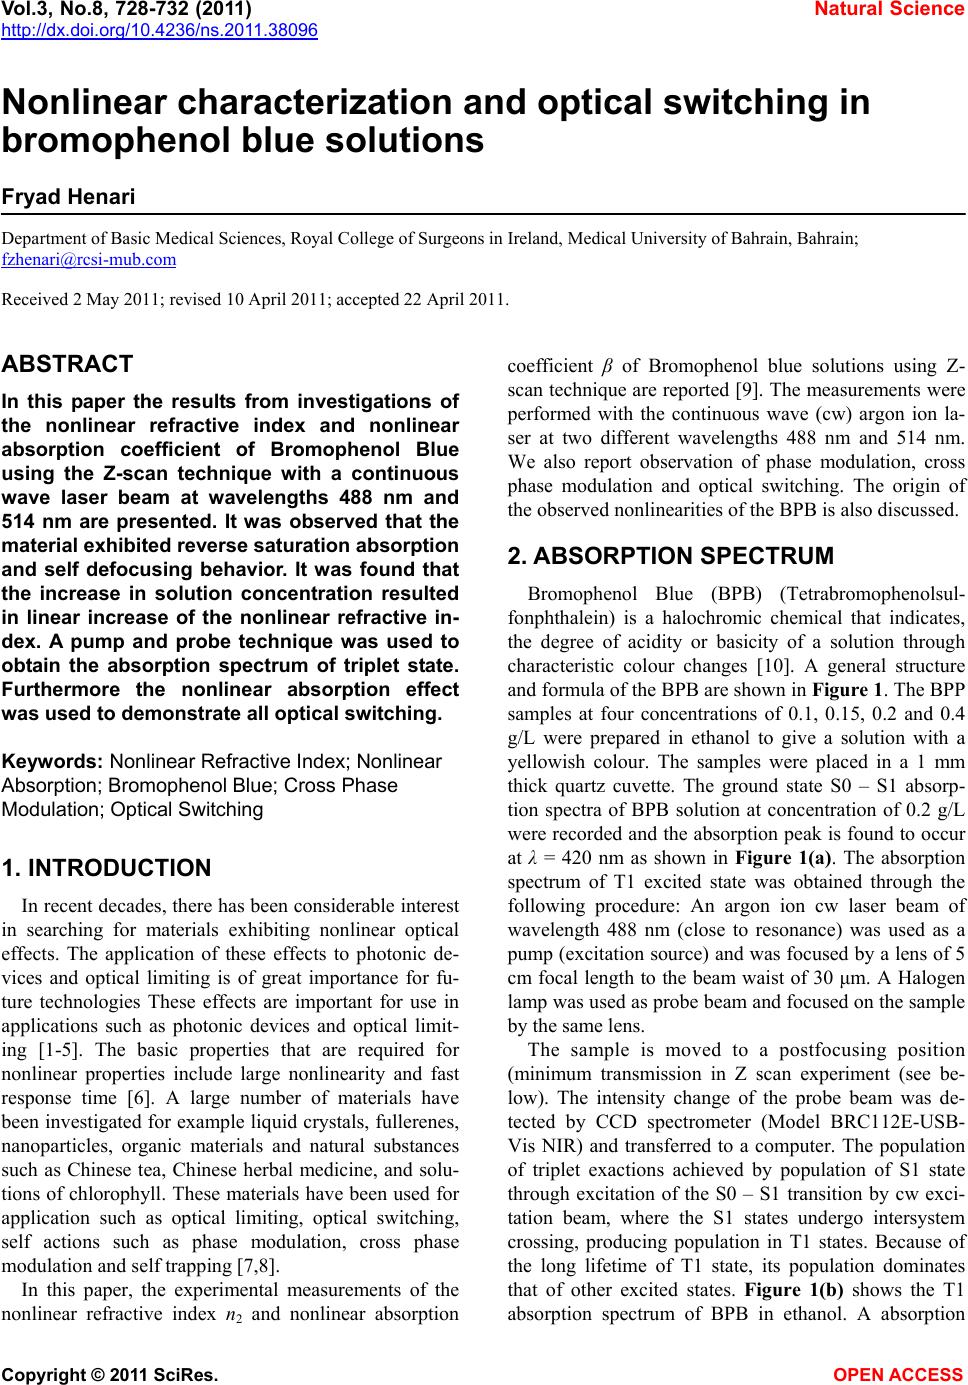
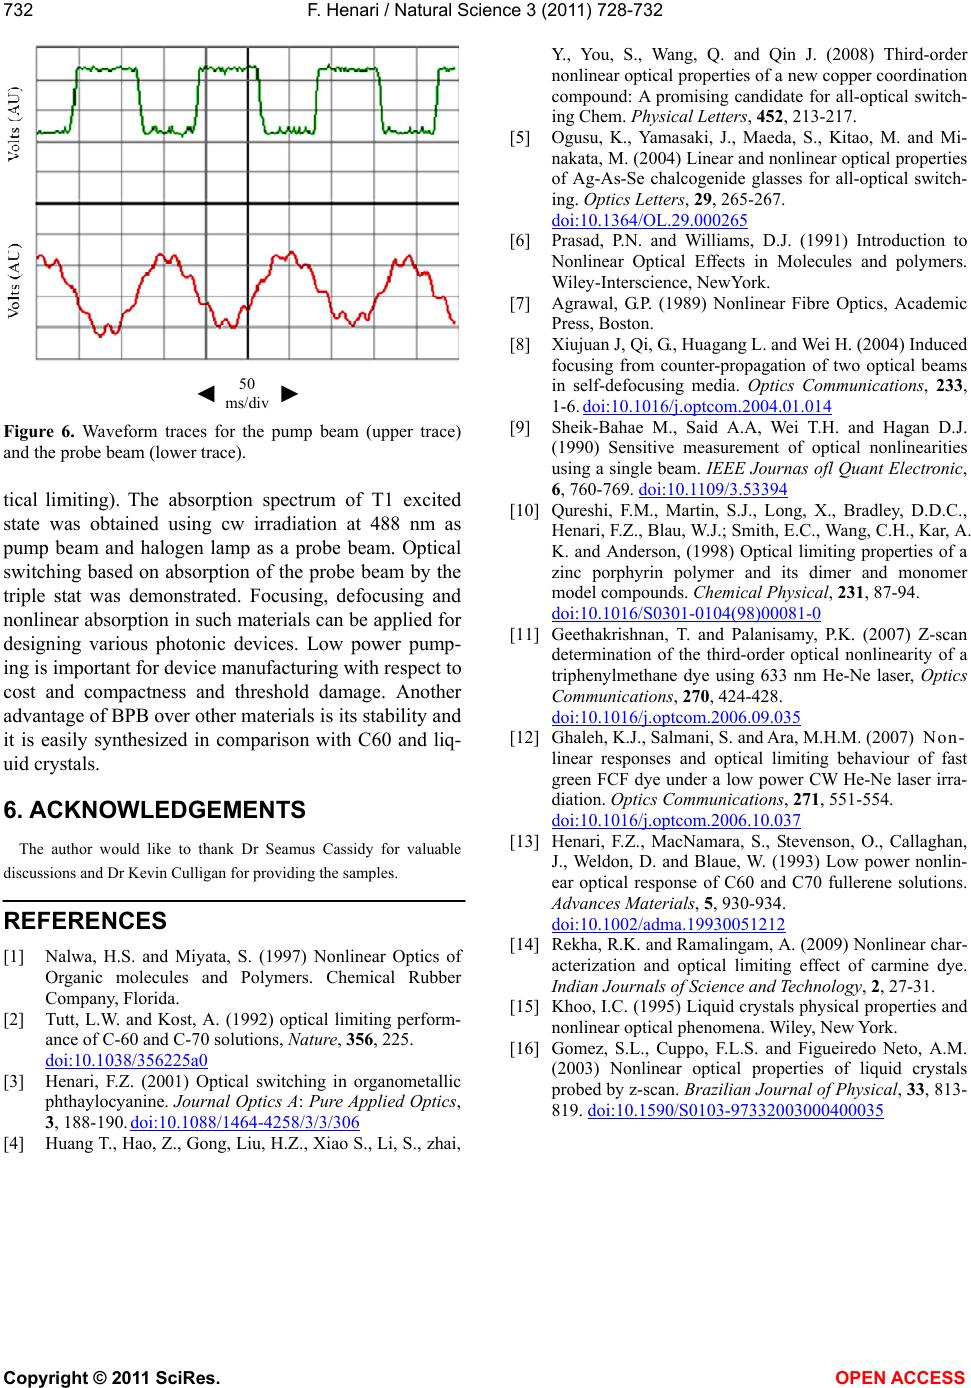
Figure 6. Waveform traces for the pump beam (upper trace)
and the probe beam (lower trace).
tical limiting). The absorption spectrum of T1 excited
state was obtained using cw irradiation at 488 nm as
pump beam and halogen lamp as a probe beam. Optical
switching based on absorption of the probe beam by the
triple stat was demonstrated. Focusing, defocusing and
nonlinear absorption in such materials can be applied for
designing various photonic devices. Low power pump-
ing is important for device manufacturing with respect to
cost and compactness and threshold damage. Another
advantage of BPB over other materials is its stability and
it is easily synthesized in comparison with C60 and liq-
uid crystals.
6. ACKNOWLEDGEMENTS
The author would like to thank Dr Seamus Cassidy for valuable
discussions and Dr Kevin Culligan for providing the samples.
REFERENCES
[1] Nalwa, H.S. and Miyata, S. (1997) Nonlinear Optics of
Organic molecules and Polymers. Chemical Rubber
Company, Florida.
[2] Tutt, L.W. and Kost, A. (1992) optical limiting perform-
ance of C-60 and C-70 solutions, Nature, 356, 225.
doi:10.1038/356225a0
[3] Henari, F.Z. (2001) Optical switching in organometallic
phthaylocyanine. Journal Optics A: Pure Applied Optics,
3, 188-190. doi:10.1088/1464-4258/3/3/306
[4] Huang T., Hao, Z., Gong, Liu, H.Z., Xiao S., Li, S., zhai,
Y., You, S., Wang, Q. and Qin J. (2008) Third-order
nonlinear optical properties of a new copper coordination
compound: A promising candidate for all-optical switch-
ing Chem. Physical Letters, 452, 213-217.
[5] Ogusu, K., Yamasaki, J., Maeda, S., Kitao, M. and Mi-
nakata, M. (2004) Linear and nonlinear optical properties
of Ag-As-Se chalcogenide glasses for all-optical switch-
ing. Optics Letters, 29, 265-267.
doi:10.1364/OL.29.000265
[6] Prasad, P.N. and Williams, D.J. (1991) Introduction to
Nonlinear Optical Effects in Molecules and polymers.
Wiley-Interscience, NewYork.
[7] Agrawal, G.P. (1989) Nonlinear Fibre Optics, Academic
Press, Boston.
[8] Xiujuan J, Qi, G., Huagang L. and Wei H. (2004) Induced
focusing from counter-propagation of two optical beams
in self-defocusing media. Optics Communications, 233,
1-6. doi:10.1016/j.optcom.2004.01.014
[9] Sheik-Bahae M., Said A.A, Wei T.H. and Hagan D.J.
(1990) Sensitive measurement of optical nonlinearities
using a single beam. IEEE Journas ofl Quant Electronic,
6, 760-769. doi:10.1109/3.53394
[10] Qureshi, F.M., Martin, S.J., Long, X., Bradley, D.D.C.,
Henari, F.Z., Blau, W.J.; Smith, E.C., Wang, C.H., Kar, A.
K. and Anderson, (1998) Optical limiting properties of a
zinc porphyrin polymer and its dimer and monomer
model compounds. Chemical Physical, 231, 87-94.
doi:10.1016/S0301-0104(98)00081-0
[11] Geethakrishnan, T. and Palanisamy, P.K. (2007) Z-scan
determination of the third-order optical nonlinearity of a
triphenylmethane dye using 633 nm He-Ne laser, Optics
Communications, 270, 424-428.
doi:10.1016/j.optcom.2006.09.035
[12] Ghaleh, K.J., Salmani, S. and Ara, M.H.M. (2007) Non-
linear responses and optical limiting behaviour of fast
green FCF dye under a low power CW He-Ne laser irra-
diation. Optics Communications, 271, 551-554.
doi:10.1016/j.optcom.2006.10.037
[13] Henari, F.Z., MacNamara, S., Stevenson, O., Callaghan,
J., Weldon, D. and Blaue, W. (1993) Low power nonlin-
ear optical response of C60 and C70 fullerene solutions.
Advances Materials, 5, 930-934.
doi:10.1002/adma.19930051212
[14] Rekha, R.K. and Ramalingam, A. (2009) Nonlinear char-
acterization and optical limiting effect of carmine dye.
Indian Journals of Science and Technology, 2, 27-31.
[15] Khoo, I.C. (1995) Liquid crystals physical properties and
nonlinear optical phenomena. Wiley, New York.
[16] Gomez, S.L., Cuppo, F.L.S. and Figueiredo Neto, A.M.
(2003) Nonlinear optical properties of liquid crystals
probed by z-scan. Brazilian Journal of Physical, 33, 813-
819. doi:10.1590/S0103-97332003000400035