Paper Menu >>
Journal Menu >>
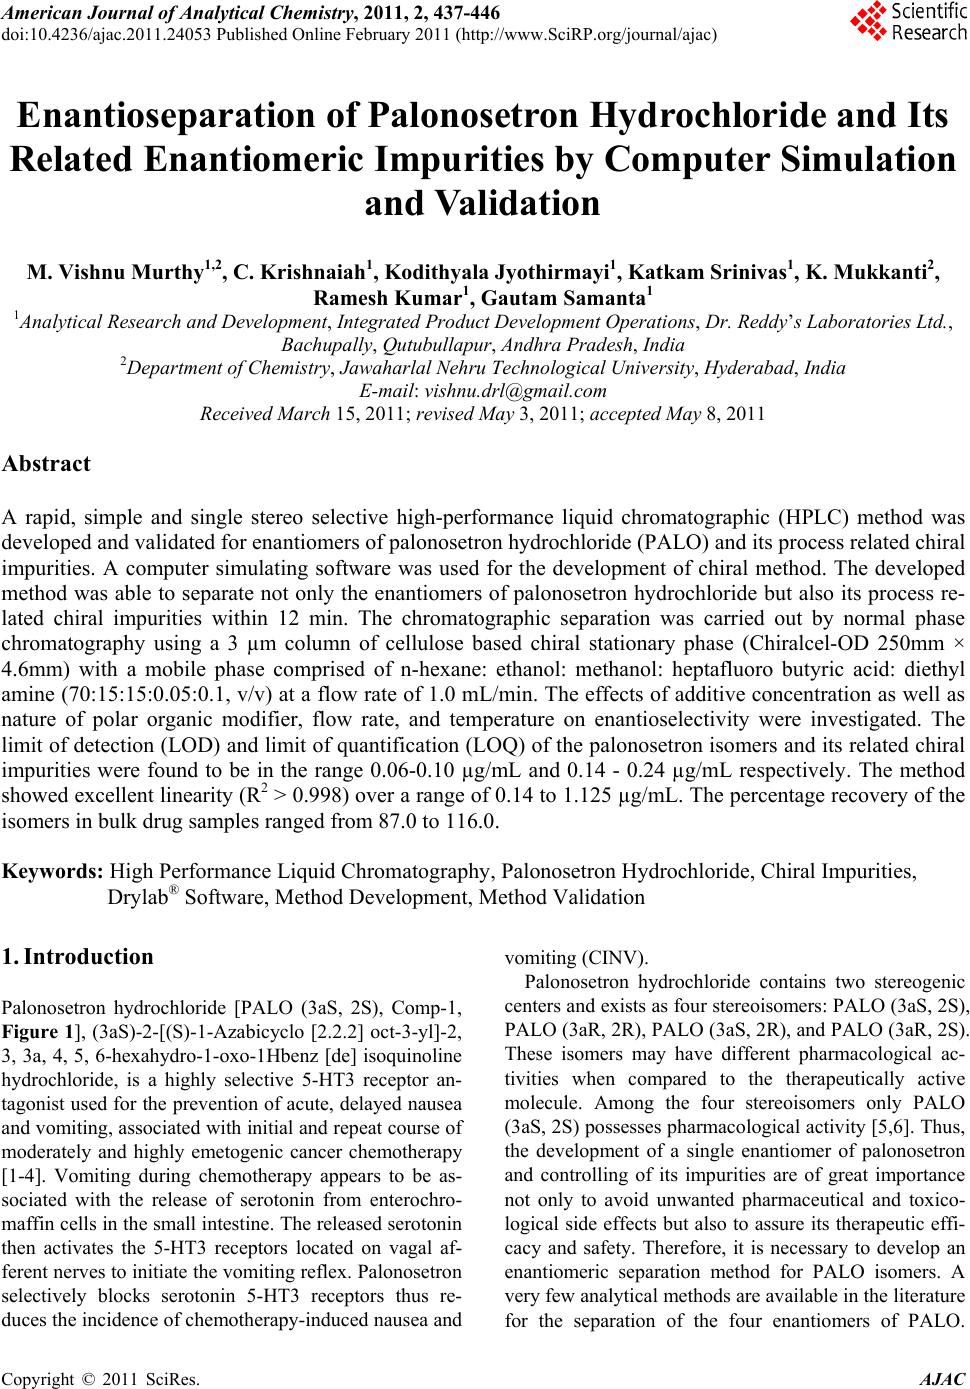 American Journal of Analyt ical Chemistry, 2011, 2, 437-446 doi:10.4236/ajac.2011.24053 Published Online February 2011 (http://www.SciRP.org/journal/ajac) Copyright © 2011 SciRes. AJAC Enantioseparation of Palonosetron Hydrochloride and Its Related Enantiomeric Impurities by Computer Simulation and Va lidation M. Vishnu Murthy1,2, C. Krishnaiah1, Kodithyala Jyothirmayi1, Katkam Srinivas1, K. Mukkanti2, Ramesh Kumar1, Gautam Samanta1 1Analytical Research and Development, Integrated Product Development Operations, Dr. Reddy’s Laboratories Ltd., Bachupally, Qutubullapur, Andhra Pradesh, India 2Department of Chemistry, Jawaharlal Nehru Technological University, Hyderabad, India E-mail: vishnu.drl@gmail.com Received March 15, 2011; revised May 3, 2011; accepted May 8, 2011 Abstract A rapid, simple and single stereo selective high-performance liquid chromatographic (HPLC) method was developed and validated for enantiomers of palonosetron hydrochloride (PALO) and its process related chiral impurities. A computer simulating software was used for the development of chiral method. The developed method was able to separate not only the enantiomers of palonosetron hydrochloride but also its process re- lated chiral impurities within 12 min. The chromatographic separation was carried out by normal phase chromatography using a 3 µm column of cellulose based chiral stationary phase (Chiralcel-OD 250mm × 4.6mm) with a mobile phase comprised of n-hexane: ethanol: methanol: heptafluoro butyric acid: diethyl amine (70:15:15:0.05:0.1, v/v) at a flow rate of 1.0 mL/min. The effects of additive concentration as well as nature of polar organic modifier, flow rate, and temperature on enantioselectivity were investigated. The limit of detection (LOD) and limit of quantification (LOQ) of the palonosetron isomers and its related chiral impurities were found to be in the range 0.06-0.10 µg/mL and 0.14 - 0.24 µg/mL respectively. The method showed excellent linearity (R2 > 0.998) over a range of 0.14 to 1.125 µg/mL. The percentage recovery of the isomers in bulk drug samples ranged from 87.0 to 116.0. Keywords: High Performance Liquid Chromatography, Palonosetron Hydrochloride, Chiral Impurities, Drylab® Software, Method Development, Method Validation 1. Introduction Palonosetron hydrochloride [PALO (3aS, 2S), Comp-1, Figure 1], (3aS)-2-[(S)-1-Azabicyclo [2.2.2] oct-3-yl]-2, 3, 3a, 4, 5, 6-hexahydro-1-oxo-1Hbenz [de] isoquinoline hydrochloride, is a highly selective 5-HT3 receptor an- tagonist used for the prevention of acute, delayed nausea and vomiting, associated with initial and repeat course of moderately and highly emetogenic cancer chemotherapy [1-4]. Vomiting during chemotherapy appears to be as- sociated with the release of serotonin from enterochro- maffin cells in the small intestine. The released serotonin then activates the 5-HT3 receptors located on vagal af- ferent nerves to initiate the vomiting reflex. Palonosetron selectively blocks serotonin 5-HT3 receptors thus re- duces the incidence of chemotherapy-induced nausea and vomiting (CINV). Palonosetron hydrochloride contains two stereogenic centers and exists as four stereoisomers: PALO (3aS, 2S), PALO (3aR, 2R), PALO (3aS, 2R), and PALO (3aR, 2S). These isomers may have different pharmacological ac- tivities when compared to the therapeutically active molecule. Among the four stereoisomers only PALO (3aS, 2S) possesses pharmacological activity [5,6]. Thus, the development of a single enantiomer of palonosetron and controlling of its impurities are of great importance not only to avoid unwanted pharmaceutical and toxico- logical side effects but also to assure its therapeutic effi- cacy and safety. Therefore, it is necessary to develop an enantiomeric separation method for PALO isomers. A very few analytical methods are available in the literature for the separation of the four enantiomers of PALO. 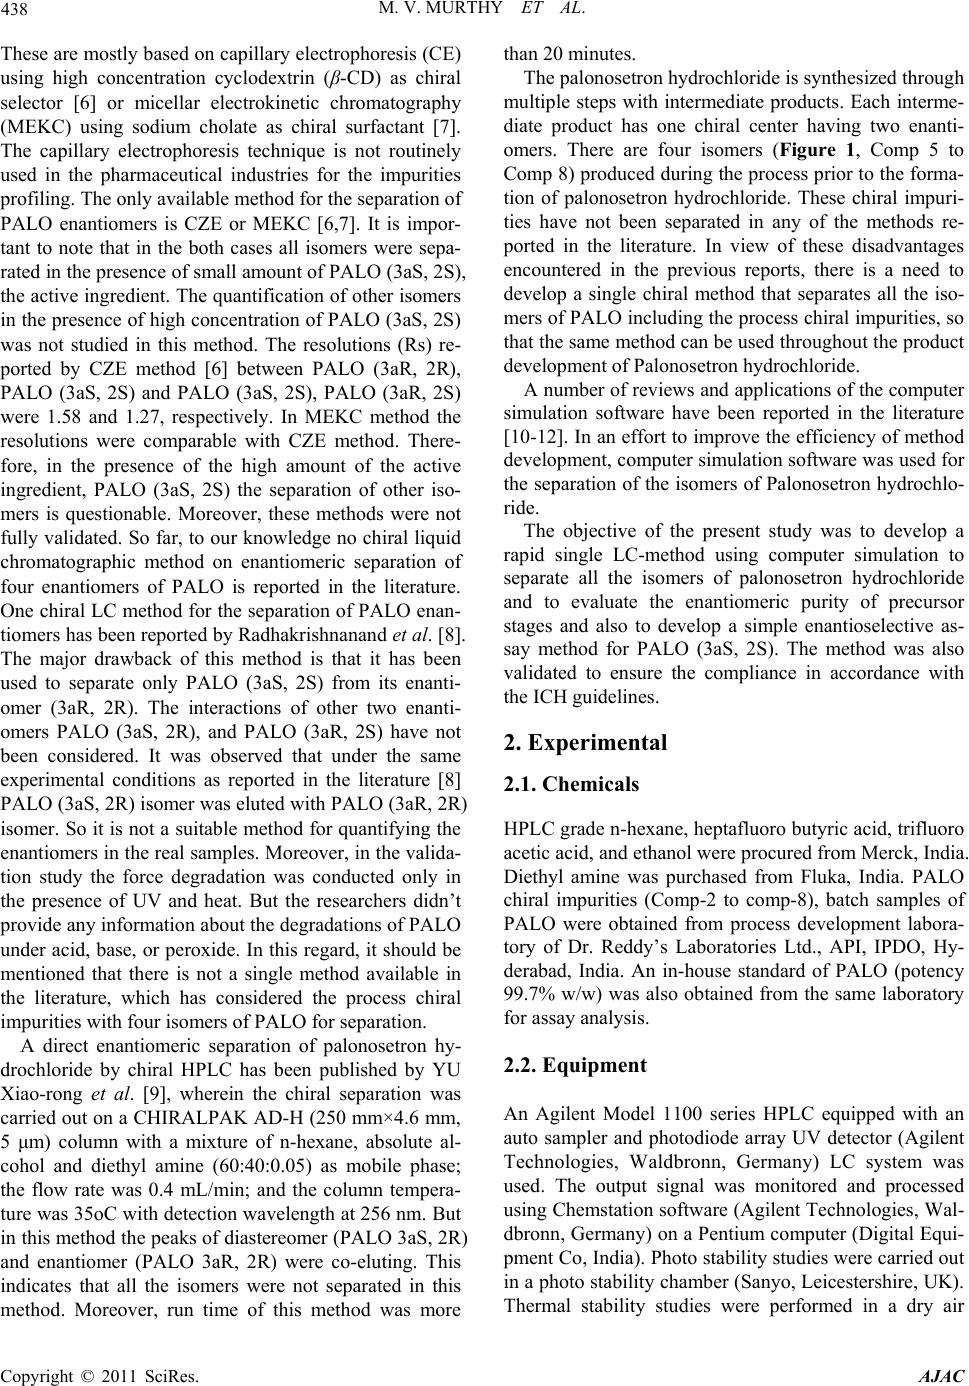 M. V. MURTHY ET AL. Copyright © 2011 SciRes. AJAC 438 These are mostly based on capillary electrophoresis (CE) using high concentration cyclodextrin (β-CD) as chiral selector [6] or micellar electrokinetic chromatography (MEKC) using sodium cholate as chiral surfactant [7]. The capillary electrophoresis technique is not routinely used in the pharmaceutical industries for the impurities profiling. The only available method for the separation of PALO enantiomers is CZE or MEKC [6,7]. It is impor- tant to note that in the both cases all isomers were sepa- rated in the presence of small amount of PALO (3aS, 2S), the active ingredient. The quantification of other isomers in the presence of high concentration of PALO (3aS, 2S) was not studied in this method. The resolutions (Rs) re- ported by CZE method [6] between PALO (3aR, 2R), PALO (3aS, 2S) and PALO (3aS, 2S), PALO (3aR, 2S) were 1.58 and 1.27, respectively. In MEKC method the resolutions were comparable with CZE method. There- fore, in the presence of the high amount of the active ingredient, PALO (3aS, 2S) the separation of other iso- mers is questionable. Moreover, these methods were not fully validated. So far, to our knowledge no chiral liquid chromatographic method on enantiomeric separation of four enantiomers of PALO is reported in the literature. One chiral LC method for the separation of PALO enan- tiomers has been reported by Radhakrishnanand et al. [8]. The major drawback of this method is that it has been used to separate only PALO (3aS, 2S) from its enanti- omer (3aR, 2R). The interactions of other two enanti- omers PALO (3aS, 2R), and PALO (3aR, 2S) have not been considered. It was observed that under the same experimental conditions as reported in the literature [8] PALO (3aS, 2R) isomer was eluted with PALO (3aR, 2R) isomer. So it is not a suitable method for quantifying the enantiomers in the real samples. Moreover, in the valida- tion study the force degradation was conducted only in the presence of UV and heat. But the researchers didn’t provide any information about the degradations of PALO under acid, base, or peroxide. In this regard, it should be mentioned that there is not a single method available in the literature, which has considered the process chiral impurities with four isomers of PALO for separation. A direct enantiomeric separation of palonosetron hy- drochloride by chiral HPLC has been published by YU Xiao-rong et al. [9], wherein the chiral separation was carried out on a CHIRALPAK AD-H (250 mm×4.6 mm, 5 μm) column with a mixture of n-hexane, absolute al- cohol and diethyl amine (60:40:0.05) as mobile phase; the flow rate was 0.4 mL/min; and the column tempera- ture was 35oC with detection wavelength at 256 nm. But in this method the peaks of diastereomer (PALO 3aS, 2R) and enantiomer (PALO 3aR, 2R) were co-eluting. This indicates that all the isomers were not separated in this method. Moreover, run time of this method was more than 20 minutes. The palonosetron hydrochloride is synthesized through multiple steps with intermediate products. Each interme- diate product has one chiral center having two enanti- omers. There are four isomers (Figure 1, Comp 5 to Comp 8) produced during the process prior to the forma- tion of palonosetron hydrochloride. These chiral impuri- ties have not been separated in any of the methods re- ported in the literature. In view of these disadvantages encountered in the previous reports, there is a need to develop a single chiral method that separates all the iso- mers of PALO including the process chiral impurities, so that the same method can be used throughout the product development of Palonosetron hydrochloride. A number of reviews and applications of the computer simulation software have been reported in the literature [10-12]. In an effort to improve the efficiency of method development, computer simulation software was used for the separation of the isomers of Palonosetron hydrochlo- ride. The objective of the present study was to develop a rapid single LC-method using computer simulation to separate all the isomers of palonosetron hydrochloride and to evaluate the enantiomeric purity of precursor stages and also to develop a simple enantioselective as- say method for PALO (3aS, 2S). The method was also validated to ensure the compliance in accordance with the ICH guidelines. 2. Experimental 2.1. Chemicals HPLC grade n-hexane, heptafluoro butyric acid, trifluoro acetic acid, and ethanol were procured from Merck, India. Diethyl amine was purchased from Fluka, India. PALO chiral impurities (Comp-2 to comp-8), batch samples of PALO were obtained from process development labora- tory of Dr. Reddy’s Laboratories Ltd., API, IPDO, Hy- derabad, India. An in-house standard of PALO (potency 99.7% w/w) was also obtained from the same laboratory for assay analysis. 2.2. Equipment An Agilent Model 1100 series HPLC equipped with an auto sampler and photodiode array UV detector (Agilent Technologies, Waldbronn, Germany) LC system was used. The output signal was monitored and processed using Chemstation software (Agilent Technologies, Wal- dbronn, Germany) on a Pentium computer (Digital Equi- pment Co, India). Photo stability studies were carried out in a photo stability chamber (Sanyo, Leicestershire, UK). Thermal stability studies were performed in a dry air 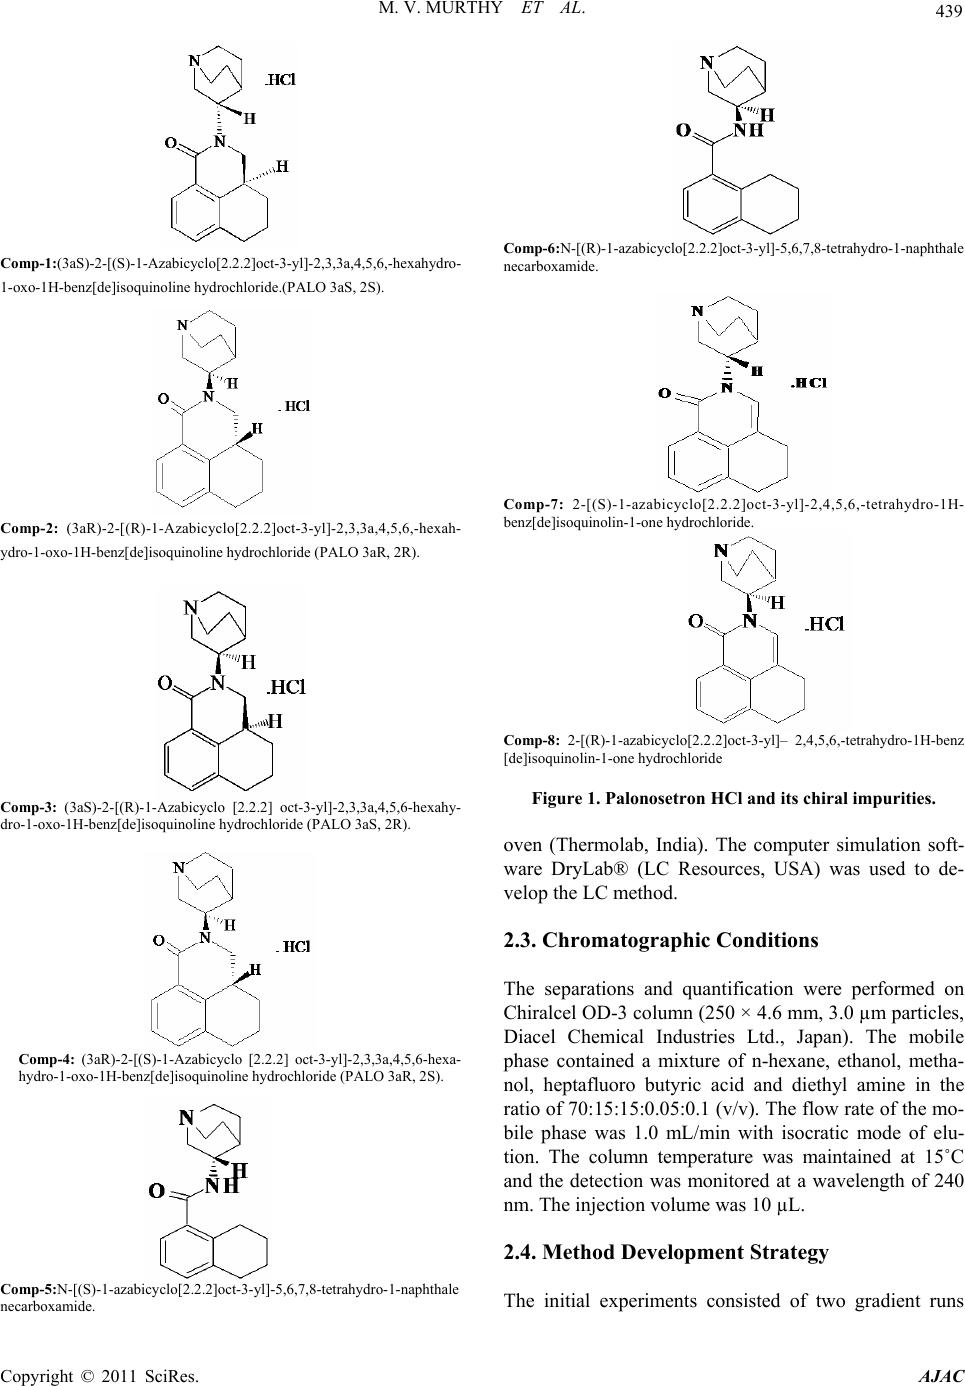 M. V. MURTHY ET AL. Copyright © 2011 SciRes. AJAC 439 Comp-1:(3aS)-2-[(S)-1-Azabicyclo[2.2.2]oct-3-yl]-2,3,3a,4,5,6,-hexahydro- 1-oxo-1H-benz[de]isoquinoline hydrochloride.(PALO 3aS, 2S). Comp-2: (3aR)-2-[(R)-1-Azabicyclo[2.2.2]oct-3-yl]-2,3,3a,4,5,6,-hexah- ydro-1-oxo-1H-benz[de]isoquinoline hydrochloride (PALO 3aR, 2R). Comp-3: (3aS)-2-[(R)-1-Azabicyclo [2.2.2] oct-3-yl]-2,3,3a,4,5,6-hexahy- dro-1-oxo-1H-benz[de]isoquinoline hydrochloride (PALO 3aS, 2R). Comp-4: (3aR)-2-[(S)-1-Azabicyclo [2.2.2] oct-3-yl]-2,3,3a,4,5,6-hexa- hydro-1-oxo-1H-benz[de]isoquinoline hydrochloride (PALO 3aR, 2S). Comp-5:N-[( S)-1-azabi cyclo[ 2.2.2]oct -3-yl]-5 ,6,7,8-t etrahydro- 1-naphth ale necarboxamide. Comp-6:N-[(R)-1-azabicyclo[2.2.2]oct-3-yl]-5,6,7,8-tetrahydro-1-naphthale necarboxamide. Comp-7: 2-[(S)-1-azabicyclo[2.2.2]oct-3-yl]-2,4,5,6,-tetrahydro-1H- benz[de]isoquinolin-1-one hydrochloride. Comp-8: 2-[(R)-1-azabicyclo[2.2.2]oct-3-yl]– 2,4,5,6,-tetrahydro-1H-benz [de]isoquinolin-1-one hydrochloride Figure 1. Palonosetron HCl and its chiral impurities. oven (Thermolab, India). The computer simulation soft- ware DryLab® (LC Resources, USA) was used to de- velop the LC method. 2.3. Chromatographic Conditions The separations and quantification were performed on Chiralcel OD-3 column (250 × 4.6 mm, 3.0 µm particles, Diacel Chemical Industries Ltd., Japan). The mobile phase contained a mixture of n-hexane, ethanol, metha- nol, heptafluoro butyric acid and diethyl amine in the ratio of 70:15:15:0.05:0.1 (v/v). The flow rate of the mo- bile phase was 1.0 mL/min with isocratic mode of elu- tion. The column temperature was maintained at 15˚C and the detection was monitored at a wavelength of 240 nm. The injection volume was 10 µL. 2.4. Method Development Strategy The initial experiments consisted of two gradient runs 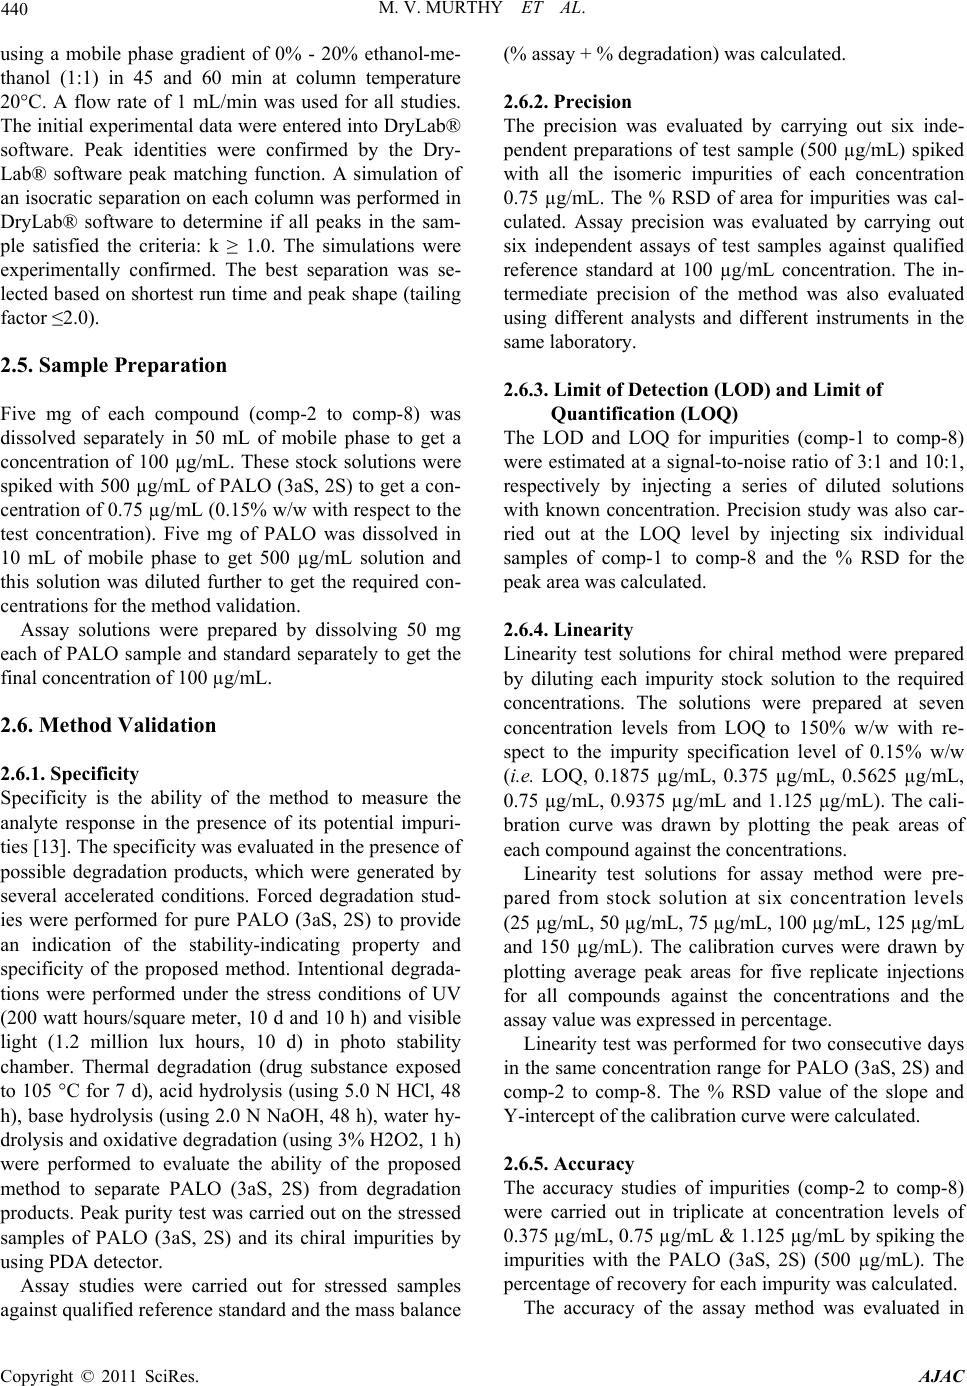 M. V. MURTHY ET AL. Copyright © 2011 SciRes. AJAC 440 using a mobile phase gradient of 0% - 20% ethanol-me- thanol (1:1) in 45 and 60 min at column temperature 20°C. A flow rate of 1 mL/min was used for all studies. The initial experimental data were entered into DryLab® software. Peak identities were confirmed by the Dry- Lab® software peak matching function. A simulation of an isocratic separation on each column was performed in DryLab® software to determine if all peaks in the sam- ple satisfied the criteria: k ≥ 1.0. The simulations were experimentally confirmed. The best separation was se- lected based on shortest run time and peak shape (tailing factor ≤2.0). 2.5. Sample Preparation Five mg of each compound (comp-2 to comp-8) was dissolved separately in 50 mL of mobile phase to get a concentration of 100 µg/mL. These stock solutions were spiked with 500 µg/mL of PALO (3aS, 2S) to get a con- centration of 0.75 µg/mL (0.15% w/w with respect to the test concentration). Five mg of PALO was dissolved in 10 mL of mobile phase to get 500 µg/mL solution and this solution was diluted further to get the required con- centrations for the method validation. Assay solutions were prepared by dissolving 50 mg each of PALO sample and standard separately to get the final concentration of 100 µg/mL. 2.6. Method Validation 2.6.1. Specificity Specificity is the ability of the method to measure the analyte response in the presence of its potential impuri- ties [13]. The specificity was evaluated in the presence of possible degradation products, which were generated by several accelerated conditions. Forced degradation stud- ies were performed for pure PALO (3aS, 2S) to provide an indication of the stability-indicating property and specificity of the proposed method. Intentional degrada- tions were performed under the stress conditions of UV (200 watt hours/square meter, 10 d and 10 h) and visible light (1.2 million lux hours, 10 d) in photo stability chamber. Thermal degradation (drug substance exposed to 105 C for 7 d), acid hydrolysis (using 5.0 N HCl, 48 h), base hydrolysis (using 2.0 N NaOH, 48 h), water hy- drolysis and oxidative degradation (using 3% H2O2, 1 h) were performed to evaluate the ability of the proposed method to separate PALO (3aS, 2S) from degradation products. Peak purity test was carried out on the stressed samples of PALO (3aS, 2S) and its chiral impurities by using PDA detector. Assay studies were carried out for stressed samples against qualified reference standard and the mass balance (% assay + % degradation) was calculated. 2.6.2. Precision The precision was evaluated by carrying out six inde- pendent preparations of test sample (500 µg/mL) spiked with all the isomeric impurities of each concentration 0.75 µg/mL. The % RSD of area for impurities was cal- culated. Assay precision was evaluated by carrying out six independent assays of test samples against qualified reference standard at 100 µg/mL concentration. The in- termediate precision of the method was also evaluated using different analysts and different instruments in the same laboratory. 2.6.3. Limit of Detection (LOD) and Limit of Quantification (LOQ) The LOD and LOQ for impurities (comp-1 to comp-8) were estimated at a signal-to-noise ratio of 3:1 and 10:1, respectively by injecting a series of diluted solutions with known concentration. Precision study was also car- ried out at the LOQ level by injecting six individual samples of comp-1 to comp-8 and the % RSD for the peak area was calculated. 2.6.4. Linearity Linearity test solutions for chiral method were prepared by diluting each impurity stock solution to the required concentrations. The solutions were prepared at seven concentration levels from LOQ to 150% w/w with re- spect to the impurity specification level of 0.15% w/w (i.e. LOQ, 0.1875 µg/mL, 0.375 µg/mL, 0.5625 µg/mL, 0.75 µg/mL, 0.9375 µg/mL and 1.125 µg/mL). The cali- bration curve was drawn by plotting the peak areas of each compound against the concentrations. Linearity test solutions for assay method were pre- pared from stock solution at six concentration levels (25 µg/mL, 50 µg/mL, 75 µg/mL, 100 µg/mL, 125 µg/mL and 150 µg/mL). The calibration curves were drawn by plotting average peak areas for five replicate injections for all compounds against the concentrations and the assay value was expressed in percentage. Linearity test was performed for two consecutive days in the same concentration range for PALO (3aS, 2S) and comp-2 to comp-8. The % RSD value of the slope and Y-intercept of the calibration curve were calculated. 2.6.5. Accu racy The accuracy studies of impurities (comp-2 to comp-8) were carried out in triplicate at concentration levels of 0.375 µg/mL, 0.75 µg/mL & 1.125 µg/mL by spiking the impurities with the PALO (3aS, 2S) (500 µg/mL). The percentage of recovery for each impurity was calculated. The accuracy of the assay method was evaluated in  M. V. MURTHY ET AL. Copyright © 2011 SciRes. AJAC 441 triplicate at three concentration levels i.e. 50 µg/mL, 100 µg/mL and 200 µg/mL in the bulk drug sample. The % recoveries were calculated. 2.6.6. Robustness To determine the robustness of the developed method, experimental conditions were deliberately altered and the resolution among the compounds and peak tailing of PALO (3aS, 2S) were evaluated. To study the effect of flow rate on the resolution, it was changed by 0.2 units from 0.8 mL/min to 1.2 mL/min. The effect of column temperature on resolution was stud- ied at 10˚C and 20˚C keeping the other conditions same. 2.6.7. Solution Stability and Mobile Phase Stability The solution stabilities of drug and impurities were car- ried out by keeping the sample solutions in tightly capped volumetric flasks at room temperature for 48 h. The concentrations of the impurities (comp-2 to comp-8) were determined at every 6 h interval up to the study performed. The mobile phase stability study was also carried out for 48 h by injecting the freshly prepared sample solutions for every 6 h interval. The concentra- tions of impurities (comp-2 to comp-8) were checked in test solutions. The % RSD of assay of PALO (3aS, 2S) was calcu- lated for the study period during mobile phase and solu- tion stability experiments. 2.6.8. Batch Analysis Three batches of palonosetron hydrochloride samples were prepared in the concentration of 500 µg/mL and analyzed for enantiomeric purity. The same solutions were diluted to get a concentration of 100 µg/mL and analyzed for assay of palonosetron hydrochloride. 3. Results and Discussion 3.1. Method Development and Optimization of Chromatographic Conditions Due to the presence of carbonyl(-C=O), phenyl group and quaternary nitrogen on PALO, polysaccharide col- umns were employed during the method development namely Chiralpak IC, Chiralcel OJ-H, Chiralpak AD-H, Chiralcel OD-H, and Chiralcel OD-3 from Diacel, Japan. All the columns chosen were of 250 mm length and 4.6 mm internal diameter. The particle size of all columns was 5 µm except Chiralcel OD-3 (Particle size 3 µm). Due to free solubility of PALO in polar solvent, the first experiment was conducted with a mobile phase composition of hexane: ethanol: trifluoroacetic acid: di- ethyl amine (90:10:0.5:2, v/v) with Chiralcel OD-H column. The trifluoroacetic acid and diethyl amine were used as additive with mobile phase as reported in the literature [8]. But three impurities (comp 2, 3, and 4) were eluted at the same retention time. The introduction of methanol in the above mobile phase improved the resolution for a pair of impurities (comp-2 and comp-3). For further study the mixture of ethanol and methanol (1:1) was considered for method development. The method development strategy using DryLab® software was applied for the separation of all isomers of palonosetron hydrochloride and intermediate isomers. In this study, the initial two input experiments were per- formed on a series of columns using a gradient (0% - 20% ethanol-methanol in 45 min and 60 min, respectively at 15˚C) mobile phase of n-hehane/ethanol-methanol mix- ture. The data was incorporated into DryLab® software and an isocratic separation was predicted for all columns. Based on the gradient run and predicted isocratic separa- tion, it was observed that in comparison with other col- umns, only Chiralcel OD-3 column gave good separation for all compounds listed in Figure 1. The chiral station- ary phase (CSP) in Chiralcel-OD-3 is tris (3,5-dime- thylphenyl carbamate) cellose derivative coated on sil- ica-gel. The separation of enantiomers and diastereomers on Chiralcel-OD-3 column could be due to the interac- tion between the solute and polar carbamate group on the stationary phase. The carbamate group on the CSP can interact with solute enantiomers through hydrogen bonding using the –C=O, which is present in both CSP and palonosetron. In addition, the dipole–dipole interac- tions can occur between the –C=O group on the CSP and the –C=O group on the palonosetron. The aromatic func- tionality present in PALO could provide additional stabi- lizing effect to the solute-CSP complex by insertion of the aromatic portion of the solute into the chiral cavity. Three micron particles of CSP in the Chiralcel-OD-3 column improved the resolution between the impurities. The DryLab® software simulation suggested the use of 32.5% ethanol-methanol (1:1) (%B) with additives TFA and DEA (0.05:0.1) for a good separation of all compounds under isocratic separation using Chiralcel OD-3 column. The suggested percentage of B was far above the value of B used for the preliminary experi- ments. To optimize the %B, another three isocratic ex- periments were conducted by varying the %B (25, 32.5, and 40% v/v) added with the same concentrations of TFA and DEA additives. All data were incorporated into the DryLab® software. The simulation suggested a good separation with 30%B (Figure 2) and the data was ex- perimentally verified with 30% B keeping other condi- tions same (Figure 3). The actual (texp) and simulated (tsim) retention times for each component in the mixture, together with their  442 M. V. MURTHY ET AL. Copyright © 2011 SciRes. AJAC Figure 2. Predicted chromatogram using DryLab® software. Figure 3. HPLC chromatogram for PALO enantiomers and the process related chiral impurities (Column: Chiralcel OD-3 column, 250mm × 4.6mm, 3 µm; Mobile phase: n-hexane: ethanol/methanol: trifluoroacetic acid: diethylamine (70:30:0.05: 0.1, v/v); Flow rate: 1.0 mL/min; Temp: 15˚C). ratio (r = texp/tsim), are given in Table 1. The ratio is a quantitative measure of the agreement between the experimentally determined separation and that predicted by DryLab® software. All ratios ranged in value from 1.06 to 1.10, thus indicating good agreement between the experimental and simulated results. The chromatogram with 30 % B with TFA and DEA is shown in Figure 3, which shows poor resolution be- tween Comp-8 and Comp-1 (Rs = 1.2). Experiments were conducted using different additives (Triethyl amine, n-Butyl amine, acetic acid and heptafluro butyric acid,) and it was observed that heptafluoro butyric with diethyl amine gave good separation (Figure 4) between Comp-8 and Comp-1 (Rs = 1.5). To optimize the temperature, two more experiments were performed at two different column oven tempera- tures (15˚C and 25˚C) keeping the other conditions same. The experimental data was introduced into the DryLab® software. Figure 5 shows the resolution map, which shows that good separation can be achieved between 0˚C to 20˚C and above 20˚C. The resolution decreases stead- ily with the increase of temperature. Based on the resolu- tion map, the temperature was optimized to 15˚C. The mobile phase flow rate was also changed (0.8 to 1.2 mL/min) to study the effect on the chromatogram. At low flow rate, no significant improvement in resolu- tion was observed. On the other hand, with the increase of flow rate the resolution decreased between the critical pairs. Based on the observation, the flow rate was opti- mized to 1.0 mL/min. Under the optimized conditions all the eight chiral compounds were separated within 12 min. The retention times of Comp-1 to comp-8 were 6.23, 5.35, 5.65, 11.49, 7.77, 3.84, 7.24 and 5.89 min, respectively (Figure 4), and the resolution between the critical pairs was greater than 1.5. The USP tailing factor for PALO and its chiral impurities was less than 1.2 in the developed method. 3.2. Method Validation 3.2.1. Specificity and Mass Balance Study Specificity of the method was tested with the forced  M. V. MURTHY ET AL. 443 Copyright © 2011 SciRes. AJAC Table 1. Comparison of retention time for simulated [tsim] using DryL ab (Figur e 2) and experimentally [texp] verified (Figure 3) for all isomers related to palonosetron. S.No Peak Name DryLab tsim (min) Experimental texp (min) r ( texp / tsim ) 1 2 3 4 5 6 7 8 Comp-1 Comp-2 Comp-3 Comp-4 Comp-5 Comp-6 Comp-7 Comp-8 6.0 5.25 5.55 10.9 7.45 3.74 7.05 5.75 6.52 5.70 6.045 11.59 8.04 4.18 7.64 6.27 1.08 1.08 1.08 1.06 1.08 1.11 1.08 1.09 Figure 4. Chromatogram for PALO enantiomers and the process related chiral impurities (Column: Chiralcel OD-3 column, 250 mm × 4.6 mm, 3 µm; Mobile phase: n-hexane: ethanol/methanol: heptafluoro butyric acid: diethylamine (70:30:0.05:0.1, v/v); Flow rate: 1.0 mL/min, Temp: 15˚C). Figure 5. Computer simulated resolution map for the optimization of temperature. degradation samples. The results of the forced degrada- tion studies are given in Table 2, which indicates that degradation has not been observed in palonosetron hy- drochloride samples during stress conditions with UV light and thermal studies. The same observation was reported by Radhakrish- nanand et al. [8]. But the researchers didn’t provide any information about the degradations of PALO under acid,  444 M. V. MURTHY ET AL. Copyright © 2011 SciRes. AJAC Table 2. Percentage assay and mass balance for PALO under various stressed conditions. Stress condition Time % Assay of PALO Mass balance (%Assay +%impurities + % Degradation products) Acid hydrolysis (5 N HCl, reflux at 100˚C) 48 h 97.5% w/w 99.5% Base hydrolysis (2 N NaOH, reflux at 100˚C) 48 h 93.0% w/w 99.6% Oxidation (3% H202 at 30˚C ) 1 h 97.9% w/w 99.8% Water hydrolysis (reflux at 100˚C) 48 h 98.7% w/w 99.2% Thermal (at 105˚C) 7 days 99.6% w/w 99.7% Visible Light (1.2 million lux hours) 10 days 99.8% w/w 99.9% UV Light (200 watt hr/sq.meter) 10 days and 10 h 99.5% w/w 99.6% base, or peroxide. Reasonably good degradation occurred when the compound was exposed only to very harsher conditions (high strength of acid/base and reflux up to 48 h). In contrast, the molecule was degraded in oxidative stress within one hour at room temperature. All the deg- radation products formed during the stress conditions were not interfered with either PALO or its potential impurities. It was observed that one of the degraded peaks was partially interfered with comp-6, which was considered to be a non potential impurity in finished product, because it was an impurity of n-2 stage. How- ever, in confirmatory studies, long term and accelerated stability samples were analyzed and found that no deg- radation impurity was formed at that retention time of 3.8 min. Peak purity of the PALO and impurity peaks in stressed samples was verified using the PDA in the wavelength range of 200 - 400 nm. It was observed that the palonosetron hydrochloride peak was spectrally pure and no degradation peak was eluted with PALO (3aS, 2S). Assay of the PALO was unaffected in the presence of impurities and degradation products. It confirmed the stability indicating nature of the method. The mass bal- ance (%Assay +%impurities + degradation products) was achieved >99% (Table 2). 3.2.2. Limit of Detection and Quantification LOD and LOQ values were calculated for all compounds. The calculated values are given in Table 3. LOQ Precisions (in % RSD) for comp-1 to Comp-8 at LOQ level were ranged from 1.9 to 8.6 (n = 6). The per- cent recovery values at LOQ level were obtained (90% to 103%, n = 6) in acceptable range as per the ICH guide- lines. 3.2.3. Linearity Linearity test solutions of comp-1 to comp-8 ranging from 0.18 and 1.125 µg/mL were prepared by diluting the stock solutions. Table 3 shows the slope, intercept and correlation coefficient derived from linear least- square regression analysis. The results revealed that an excellent correlation existed between the peak area and concentration of the analytes. The standard errors for the slopes and intercepts are given in the Table 3. The %RSD values for the slope values of comp-1 to comp-8 obtained in two consecutive days were less than 2.0%. 3.2.4. Precision The precision was evaluated by calculating the RSD of six replicates using the same solution (0.75 µg·mL–1) containing comp-2 to comp-8 (Table 4). The % RSD values of injection repeatability for comp-1 to comp-8 were found as less than 5.8, indicating the good precision of the method. In the intermediate precision (different analyst and different system) study, the values for %RSD for peak areas were within the range of 0.45 to 2.79. 3.2.5. Accu racy The accuracy of method was evaluated by assaying freshly prepared solutions in triplicate at three concentration lev- els of 0.075, 0.15 and 0.225% (w/w). The percent recovery values were in between 87 to 116 (Table 4). The percentage recovery of PALO in bulk drug sam- ples was ranged from 99.0% to 99.5% (w/w). 3.2.6. Robustness In the varied chromatographic conditions viz. flow rate and column temperature, the resolutions between the critical pairs among the comp-1 to comp-8 were found not less than 1.5 and the peak tailing was ≤1.2, illustrat- ing the robustness of the method. However, the resolu- tion between comp-4 and comp-5 was reduced to 1.35 at 20˚C column oven temperature. The DryLab® also pre-  M. V. MURTHY ET AL. 445 Copyright © 2011 SciRes. AJAC Table 3. LOD, LOQ, and linearity data for comp-1 to comp-8. S.No Name R2 Slope ± S.E Intercept ± S.E LOD µg/mL LOQ µg/mL 1 2 3 4 5 6 7 8 Comp-1 Comp-2 Comp-3 Comp-4 Comp-5 Comp-6 Comp-7 Comp-8 0.9987 0.9997 0.9983 0.9981 0.9980 0.9983 0.9994 0.9981 39.48 ± 1.078 56.00 ± 0.469 47.96 ± 1.429 84.60 ± 2.218 43.96 ± 1.129 65.44 ± 1.543 109.40 ± 1.537 128.16 ± 3.181 0.854 ± 0.179 0.168 ± 0.777 0.050 ± 0.237 0.438 ± 0.368 0.234 ± 0.187 –1.276 ± 0.256 0.228 ± 0.255 –0.056 ± 0.528 0.06 0.06 0.06 0.07 0.10 0.09 0.06 0.06 0.16 0.14 0.15 0.17 0.24 0.23 0.15 0.14 S.E = Standard error Table 4. Precision and accuracy of PALO and its chiral related impurities. Precision(n = 9) Accuracy % recovery S.No Name Area ± SD % RSD 1 2 3 4 5 6 7 8 Comp-1(PALO) Comp-2 Comp-3 Comp-4 Comp-5 Comp-6 Comp-7 Comp-8 8001 ± 48.82 9.0 ± 0.56 10.2 ± 0.58 12.8 ± 0.47 7.0 ± 0.27 7.2 ± 0.41 16.1 ± 0.41 10.8 ± 0.14 0.61 6.24 5.72 3.71 3.89 5.70 2.57 1.31 - 114.06 115.61 91.32 91.07 90.14 97.95 87.37 dicted the same. 3.2.7. Solution Stability and Mobile Phase Stability The similarity factor was found as 1.0 for comp-1 to comp-8 during solution stability and mobile phase stabil- ity experiments when performed using chiral method. The experimental data of the solution stability and mo- bile phase stability confirmed that the sample solutions and mobile phase used during the determination of comp-1 to comp-8 were stable up to 48 hours. The RSD of assay of PALO during solution stability and mobile phase stability experiments was within 0.5%. Batch analysis: Results of three batch samples reveal that comp-2, comp-5 and comp-6 are not detected in all the three sam- ples. Comp-3, 8, 4 and 7are less than 0.05% in the tested samples and hence the compounds are well within the specification limit. The assay results for the three sam- ples were ranged in between 99.5% to 99.8%. 4. Conclusions An isocratic, stability indicating, stereo selective and rapid chiral liquid chromatographic method was devel- oped for the enantiomeric separation and quantitative determination of PALO, its chiral impurities and precur- sor process enantiomeric impurities. The method was found to be precise, accurate and specific in bulk active substances. The method was fully validated as per ICH guidelines, showing satisfactory results for all method validation parameters tested. Hence, the method was stability indicating and could be used for the routine analysis of plant batches of Palonosetron hydrochloride in quality control laboratories and also to check the sta- bility of bulk samples of palonosetron hydrochloride. 5. Acknowledgements The authors wish to thank Dr. Reddy’s Laboratories Ltd., IPDO, Hyderabad for all kind of supports for this work. We would also like to thank our colleagues in product delivery team, Mr.S.Rajeswar Reddy (Research and De- velopment) and Mr.B.Hariram for their co-operation in carrying out this work. 6. References [1] R. D. Wit, M. Aapro and P.R. Blower, “Is There a Phar- macological Basis for Differences in 5-HT3-Receptor Antagonist Efficacy in Refractory Patients?” Cancer Chemotherapy and Pharmacology, Vol. 56, No. 3, 2005, pp. 231-238. doi:10.1007/s00280-005-1033-0 [2] M. Aapro and P. Blower, “5-Hydroxytryptamine Type-3 Receptor Antagonists for Chemotherapy-Induced and Radiotherapy-Induced Nausea and Emesis: Can We Safely Reduce the Dose of Administered Agents?” Can- cer, Vol. 104, No. 1, 2005, pp. 1-13. doi:10.1002/cncr.21141 [3] J. T. Hickok, J. A. Roscoe, G. R. Morrow, C. W. Bole, H. W. Zhao, K. L. Hoelzer, S. R. Dakhil, T. Moore and T. R. Fitch, “5-Hydroxytryptamine-Receptor Antagonists ver- sus Prochlorperazine for Control of Delayed Nausea Caused by Doxorubicin: A URCC CCOP Randomised  M. V. MURTHY ET AL. Copyright © 2011 SciRes. AJAC 446 Controlled Trial,” The Lancet Oncology, Vol. 6, No. 10, 2005, pp. 765-772. doi:10.1016/S1470-2045(05)70325-9 [4] P. Eisenberg, J. F.Vadillo, R. Zamora, V. Charu, J. Ha- jdenberg, A. Cartmell, A. Macciocchi and S. Grunberg, “Improved Prevention of Moderately Emetogenic Che- motherapy-Induced Nausea and Vomiting with Palonose- tron, a Pharmacologically Novel 5-HT3 Receptor An- tagonist. Results of a Phase III, Single-Dose Trial versus Dolasetron,” Cancer, Vol. 98, No. 11, 2003, pp. 2473- 2482. doi:10.1002/cncr.11817 [5] http://www.rxlist.com/aloxi-drug.htm accessed January 2009. [6] M. Wang, X. Ding, H. Chen and X. Chen, “Enantiosepa- ration of Palonosetron Hydrochloride by Capillary Zone Electrophoresis with High-Concentration β-CD as Chiral Selector,” Analytical Sciences, Vol. 25, No. 10, 2009, pp. 1217-1220. doi:10.2116/analsci.25.1217 [7] K. Tian, H. Chen, J. Tang, X. Chen and Z. Hu, “Enantio- separation of Palonosetron Hydrochloride by Micellar Electrokinetic Chromatography with Sodium Cholate as Chiral Selector,” Journal of Chromatography A, Vol. 1132, No. 325, 2006, pp. 333-336. doi:10.1016/j.chroma.2006.08.090 [8] P. Radhakrishnanand, D. V. Subba Rao and V. Himabindu, “Validated Chiral LC Method for the Enan- tiomeric Separation of Palonosetron Hydrochloride,” Chromatographia, Vol. 69, No. 3-4, 2009, pp. 369-373. doi:10.1365/s10337-008-0887-9 [9] X.-R. Yu, M. Song and T.-J. Hang, “Direct Enantiomeric Separation of Palonosetron Hydrochloride by Chiral HPLC,” Chinese Journal of New Drugs, Vol. 10, 2008, p. 16. [10] J. W. Dolan, L. R. Snyder, N. M. Djordjevic, D. W. Hill and T. J. Waeghe, “Reversed-Phase Liquid Chroma- tographic Separation of Complex Samples by Optimizing Temperature and Gradient Time: I. Peak Capacity Limi- tations,” Journal of Chromatography A, Vol. 857, 1999, pp. 1-20. doi:10.1016/S0021-9673(99)00765-7 [11] J. W. Dolan, L. R. Snyder, N. M. Djordjevic, D. W. Hill, D. L. Saunders, L. Van Heuhelem and T. J. Waeghe, “Simultaneous Variation of Temperature and Gradient Steepness for Reversed-Phase High-Performance Liquid Chromatography Method Development: I. Application to 14 Different Samples Using Computer Simulation,” Journal of Chromatography A, Vol. 803, 1998, pp. 1-31. [12] R. G. Wolcott, J. W. Dolan and L. R. Snyder, “Computer Simulation for the Convenient Optimization of Isocratic Reversed-Phase Liquid Chromatographic Separations by Varying Temperature and Mobile Phase Strength,” Jour- nal of Chromatography A, Vol. 869, No. 1-2, 2000, pp. 3-25. doi:10.1016/S0021-9673(99)00876-6 [13] ICH, “Stability Testing of New Drug Substances and Products (Q1AR2),” ICH Harmonized Tripartite Guide- line. |