 American Journal of Anal yt ical Chemistry, 2011, 2, 429-436 doi:10.4236/ajac.2011.24052 Published Online August 2011 (http://www.SciRP.org/journal/ajac) Copyright © 2011 SciRes. AJAC Trace Determination of Tamoxi fen in Biological Fluids Using Hollow Fiber Liquid-Phase Microextraction Followed by High-Performance Liquid Chromatography-Ultraviolet Detection Amir Kashtiaray1, Hadi Farahani2, Sharareh Farhadi1, Bertrand Rochat3, Hamid Reza Sobhi1,3* 1Department o f Chemistry, Tehran Payamenoor University, Tehran, Iran 2Industrial and Enviro nmental Protection Division, Research Institute of Petroleum Industry (RIPI), Tehran, Iran 3Quantitative Mass Spectrometry Facility, Centre Hospitalier Universitaire Vaudois, Lausanne, Switzerland E-mail: hrsobhi@gmail.com Received February 27, 2011; revised May 1, 2011; accepted June 17, 2011 Abstract The applicability of hollow fiber liquid-phase microextraction (HF-LPME) combined with high-performance liquid chromatography-ultraviolet detection (HPLC-UV) was evaluated for the extraction and determination of tamoxifen (TAM) in biological fluids including human urine and plasma. The drug was extracted from a 15 mL aqueous sample (source phase; SP) into an organic phase impregnated in the pores of the hollow fiber (membrane phase; MP) followed by the back-extraction into a second aqueous solution (receiving phase; RP) located in the lumen of the hollow fiber. The effects of several factors such as the nature of organic solvent, compositions of SP and RP solutions, extraction time, ionic strength and stirring rate on the extraction effi- ciency were examined and optimized. An enrichment factor of 360 along with substantial sample clean up was obtained under the optimized conditions. The calibration curve showed linearity in the range of 1 - 500 ng·mL–1 and the limit of detection was found to be 0.5 ng·mL–1 in aqueous medium. A reasonable rela- tive recovery (≥89%) and satisfactory intra-assay (3.7% - 4.2%, n = 3) and inter-assay (7.5% - 7.8%, n = 3) precision illustrated good performance of the analytical procedure in spiked human urine and plasma sam- ples. Keywords: High-Performance Liquid Chromatography-Ultraviolet Detection, Hollow Fiber Liquid-Phase Microextraction, Human Urine and Plasma Samples, Tamoxifen 1. Introduction Sample preparation has a direct impact on accuracy, pre- cision, limits of detection and is a determining step of the analytical process, especially when traces have to be de- termined [1-6]. The invention of solid phase microextraction (SPME) by Pawliszyn and co-workers [7], basically initiated the interest for microextraction techniques in analytical che- mistry. SPME satisfies most of the requirements of a good sample preparation technique, including simplicity of use, automation, and low consumption of materials [8]. Thus, it has been applied to determine a broad range of organic compounds in numerous types of samples [9]. An alternative solvent-minimized sample preparation approach to complement SPME appeared in the middle- -to-late 1990s [10-12]; liquid-phase microextraction (LP- ME) utilizes only a small amount of solvent (low micro- liter range) for concentrating analytes from aqueous sam- ples. It is simply a miniaturized format of liquid-liquid extraction (LLE) and overcomes many of its disadvan- tages as well as some of those of SPME (e.g. non-de- pendence on a commercial supplier and sample carry- over). LPME is simple to implement and use, generally fast, and is characterized by its affordability and reliance on widely-available apparatus or materials [13]. The ap- plications of LPME in environmental and biological analysis have been described in several papers [14-18]. LPME can be classified as two- [12,19,20] and three- -phase [21-24] categories. Two-phase microextraction is usually performed by suspending a drop (a few microli-  A. KASHTIARAY ET AL. 430 ters) of organic solvent on the tip of either a Teflon rod or the needle tip of a microsyringe immersed in the stirred aqueous sample solution. Analytes are extracted into the organic solvent and then directly injected into a gas chromatograph (GC) or high-performance liquid chromatography (HPLC) for analysis. Hollow fiber (HF) two-phase microextraction has also been developed to enhance the extraction efficiency and to stabilize the extracted solvent microdrop. In three-phase microextrac- tion, the ionizable analytes in the aqueous sample are extracted through a thin phase of organic solvent inside the pores of a polypropylene HF or an organic solvent layer held within a Teflon ring and then back extracted into another aqueous acceptor solution. Following this procedure the acceptor solution could be analyzed by HPLC or capillary electrophoresis (CE), without further treatment. It has been proven that HF-LPME is very useful for extraction of drugs and metabolites from bio- logical matrices and pollutants from environmental sam- ples with simultaneous clean-up of the matrices [25-28]. Tamoxifen (TAM) is an oral non-steroidal anti- estrogen drug used in the treatment and prevention of breast cancer [29]. TAM’s primary mechanism of action is competitive inhibition of the estrogen α-receptor, the- reby inhibiting growth of malignant breast cells. TAM administration for 5 years reduces the risk of recurrence of breast cancer both locally and systemically and im- proves overall survival rates. Moreover, with the signifi- cant grow in the use of TAM, the drug monitoring at trace level is of great importance. Analytical techniques applied in the determination of TAM has been well documented, including TLC [30], GC [31,32], HPLC [33-35], CE [36-38], GC-MS [39], LC-MS [40,41] and CE-MS [42]. Additionally, some electrochemical methods such as voltammetry [43] have also been reported for TAM analysis. Nonetheless, the drug was determined in complex matrices by these tech- niques, usually after laborious manipulation of the sam- ple before the instrumental analysis. The aim of the present study is to assess the suitability of HF-LPME technique for the determination of TAM in biological fluids. The factors affecting the microextrac- tion efficiency were studied in details and the optimal conditions were established. The resulting method was validated for quantitative purposes and then was applied to spiked real sample analysis in combination with high-performance liquid chromatography-ultraviolet de- tection (HPLC-UV). 2. Experimental 2.1. Chemicals and Reagents All the reagents were of analytical grade. TAM citrate was kindly donated by Iran Hormone pharmaceutical company (Tehran, Iran). HPLC-grade methanol, acetoni- trile, dihexylether, n-octanol, n-dodecane, HCl, NaCl, and NaOH were purchased from Merck (Darmstadt, Germany). Phosphate and ammonium acetate buffers were prepared from phosphoric and glacial acetic acid and their corresponding salts, respectively (Merck). The used reagent water was purified with a Milli-Q system from Millipore (Bedford, MA, USA). 2.2. Preparation of Standard Solutions and Real Samples A proper amount of TAM citrate was dissolved in me- thanol to obtain stock solution with a concentration of 1000 mg·L–1. Working standard solutions were freshly prepared by diluting the standard solutions of the analyte with the reagent water to the required concentrations. Both stock and working standard solutions were stored at 4°C in a refrigerator. The concentration of the drug in the preliminary experiments was 50 ng·mL–1. Human urine sample was obtained from a healthy female and Iranian Blood Transfusion Organization (Tehran, Iran) was the supplier of the plasma sample as well. These samples were filtered through a 0.45 µm pore-size cellulose ace- tate membrane filters prior to the extraction. 2.3. Instrumentation The HPLC system consisted of a Shimadzu (Tokyo, Ja- pan) LC-10 AV pump, a Rheodyne 7725 injector equ- ipped with 20 µL sample loop combined with a SPD-10 AV UV-Vis detector. Chromatographic separation was made on a Phenomenex CLC-C18 (150 mm × 4.6 mm; 5 µm) column under isocratic elution condition. The mobile phase was a mixture of acetonitrile and ammo- nium acetate (pH 6.9; 0.05 M) (70/30, v/v) with a flow rate of 1.0 mL·min–1. UV detection at 254 nm was used for quantification. 2.4. Extraction Procedure All the HF-LPME experiments were performed using Accurel Q 3/2 polypropylene hollow fiber membrane (600 µm I.D., 200 µm wall thickness, 0.2 µm pore size) from Membrana (Wuppertal, Germany). The whole fiber was cut into small segments with the length of 9.0 cm. One end of each resulting hollow fiber was heat-sealed using a soldering iron. A 25 µL syringe model 702 NR from Hamilton (Bonaduz, Switzerland) was employed to introduce the receiving phase (RP) solution into the lu- men of the hollow fiber, to suspend the hollow fiber and also to inject the extracted analyte at the end of the ex- Copyright © 2011 SciRes. AJAC  A. KASHTIARAY ET AL. Copyright © 2011 SciRes. AJAC 431 traction into the HPLC loop. Extraction and injection processes were performed in the following steps: 1) 15 mL of the aqueous sample solution (source phase; SP) was transferred into a 16 mL glass vial containing a 10 mm × 4 mm magnetic stirring bar; 2) the vial was placed on a magnetic stirrer model ZMS 74 from ZAG Chimi Com- pany (Tehran, Iran); 3) a carefully measured portion of 25 µL of the receiving phase was injected into the hollow fiber; 4) the fiber was submerged in the organic solution (membrane phase; MP) for 5 s and then into the reagent water for 5 s for washing the extra organic solution from the surface of the fiber; 5) the fiber was bent into a U-shape and together with a small part of the supporting syringe needle was submerged in the sample solution; 6) the vial was covered with Para Film and stirred for a prescribed time period; 7) at the end of the extraction time, the hollow fiber was removed from the sample so- lution, and its closed end was cut and the receiving phase was withdrawn into the syringe; 8) finally 24 µL of the receiving phase was injected into the HPLC. In initial experiments, the volumes of SP and RP solutions were 15 mL and 25 µL, respectively. Also, to obtain suitable signals in the optimization experiments, relatively high concentration of aqueous solution of TAM (50 ng·mL–1) was used. All the experiments were done at room tem- perature and the SP was stirred at a rate of 1000 rpm for 60 min. 2.5. Calculations The enrichment factor (EF) and percent extraction of the drug were calculated by the following equations: EF = C RP, final / C SP, initial (1) Extraction (%) = EF × VRP / VSP × 100 (2) where C RP, final and C SP, initial are the final and initial con- centrations of the drug in RP and SP, respectively. C RP,final of the extracted drug was calculated from the cali- bration curve. V SP and V RP are the volumes of SP and RP, respectively. 3. Results and Discussion 3.1. Basic Principle of the Extraction In three-phase LPME, the analyte is extracted from the aqueous sample solution (SP) into the organic phase immobilized within the pores of the hollow fiber known as membrane phase (MP) and then it is back-extracted into RP located inside the hollow fiber. For an analyte such as A, the extraction process can be written as: A SP ↔ A MP ↔ A RP (3) The initial amount of analyte, ni, is equal to the sum of individual amounts of analyte present in all the phases during the whole extraction process: n i = n SP + n MP + n RP (4) where n SP is the amount of analyte in the SP solution, n MP the amount of analyte in the MP solution and n RP is the amount of analyte in the RP solution. At the equilib- rium condition, Equation (3) can be written as: C i V SP = C eq.SP V SP + C eq.MP V MP + C eq.RP V RP (5) where C i is the initial concentration of analyte, C eq.SP, C eq.MP and C eq.RP are analyte concentrations in the SP, MP and RP solutions at equilibrium condition, respectively. V SP, V MP and V RP are the volumes of the source, mem- brane and receiving phases, respectively. It is worth not- ing that in all cases, the analytical signal was recorded as the function of extraction percent (%) versus each pa- rameter regarding the optimization process. 3.2. Organic Solvent Selection Selection of the solvent should be based on comparison of selectivity, extraction efficiency and the level of tox- icity. In addition, the polarity of the organic phase should be similar to that of the polypropylene fiber so that it can be easily immobilized within the pores of the fiber. This function greatly affects the performance of HF-LPME, since extraction occurs on the surface of the immobilized solvent. Three different organic solvents (i.e. dihexy- lether, n-octanol and n-dodecane) were used in the pre- sent work as organic membrane solvents. Based on the results, the best solvent proved to be dihexylether. Thus, dihexylether was chosen as the membrane solvent in the subsequent studies. 3.3. Effect of Compositions of SP and RP Solutions The effect of the concentration of NaOH in the SP solu- tion on EF at the range of 0.0 - 0.1 M was studied. As can be seen in Figure 1, the EF had its maximum value in the presence of 0.01 M NaOH (pH 11.8). In subsequent experiments, the pH of SP solution was adjusted at 11.8 using 4 M of NaOH solution. At this pH, TAM is mostly in its free form. The dependence of the EF of TAM on HCl concentration in the RP solution at the concentration range of 0.0 - 0.1M was also investigated. Based on Figure 1, it proved that EF had its maximum value in the presence of 0.01 M HCl (pH 2). It is noteworthy that degradation of C18 column can be accelerated in the presence of Cl- ions, thus in further experiments, the pH of the RP solution was adjusted at 2 using phos- phate buffer. At this pH, TAM is mostly ionized. Thus, in the present study, gradient of the pH between the SP  A. KASHTIARAY ET AL. 432 0 15 30 45 60 75 0123456 pH Extraction % 0 15 30 45 60 75 678910 1112 13 14 pH Extraction % Receiving phaseSource phase Figure 1. The effect of pH of source and receiving phase on the extraction efficiency. Extraction conditions: C TAM, 50 ng·mL–1; SP, 15 mL; RP, 25 µL; stirring rate, 1000 rpm; extraction time, 60 min. and the RP solutions is a driving force for the drug transport which was in accordance with the already ex- pectations. 3.4. Agitation Speed Like other microextraction techniques, the extraction in HF-LPME can be enhanced by agitation of the sample solution. Thereby, reducing the “time” required to attain thermodynamic equilibrium especially for the higher molecular mass analytes [20]. In HF-LPME, the organic solvent is sealed and protected by the hydrophobic hol- low fiber membrane, so it is easier to handle and it can tolerate higher stirring speeds. In our experiments, parti- tioning of the analytes into the organic solvent was en- hanced by increasing the stirring speed from 250 to 1000 rpm (Figure 2). Thus, the stirring speed with the maxi- mum value (1000 rpm) was chosen for the rest of the experiments. 3.5. Salt Effect The effect of salt addition on EF was examined by add- ing sodium chloride to aqueous samples at the concentra- tion levels of 0% - 3% w/v (Figure 2). The EF of TAM was decreased by increasing of the salt concentration. This effect may be due to increased interactions between the analyte and salt in solution with increasing salt con- centration. Such interactions would tend to restrict movement of the analyte from the SP to the membrane solvent. So, all the subsequent experiments were per- formed in the absence of salt. It is worth noting that in the biological samples due to existence of salts, lower extractions in comparison with the aqueous sample may be expected. 3.6. Extraction Time LPME is not an exhaustive extraction technique, thus maximum sensitivity is attained at equilibrium condition. On the other hand, complete equilibrium need not be attained for accurate and precise analysis. However, choosing an exact extraction time is essential to obtain good precision [44]. Therefore, extraction time is one of the most important factors influencing the extraction efficiency. In this study, EF of the drug was investigated as a function of time in the range of 15 - 75 min. Then, EF of the drug was increased by increasing of the extrac- tion time. As shown in Figure 3, the optimal extraction time was 60 min. Thus, 60 min was chosen as the extrac- tion time in the subsequent experiments. It is noteworthy that the optimum extraction time is dependent on sample composition and may be re-evaluated for real samples to obtain suitable EFs. 3.7. Evaluation of the Method Performance The calibration curves of TAM were plotted in three dif- ferent sample solutions. For each level, three replicate extractions were performed under the optimal conditions. Dynamic linear ranges (DLRs) and limits of detection (LODs), defined as the analytical signal which is larger than the blank by multiple three of the variation in the blank, all were calculated and tabulated in Table 1 . Fur- thermore, based on Equation (1) the highest attainable EF was found to be 360 in aqueous medium (at the Copyright © 2011 SciRes. AJAC 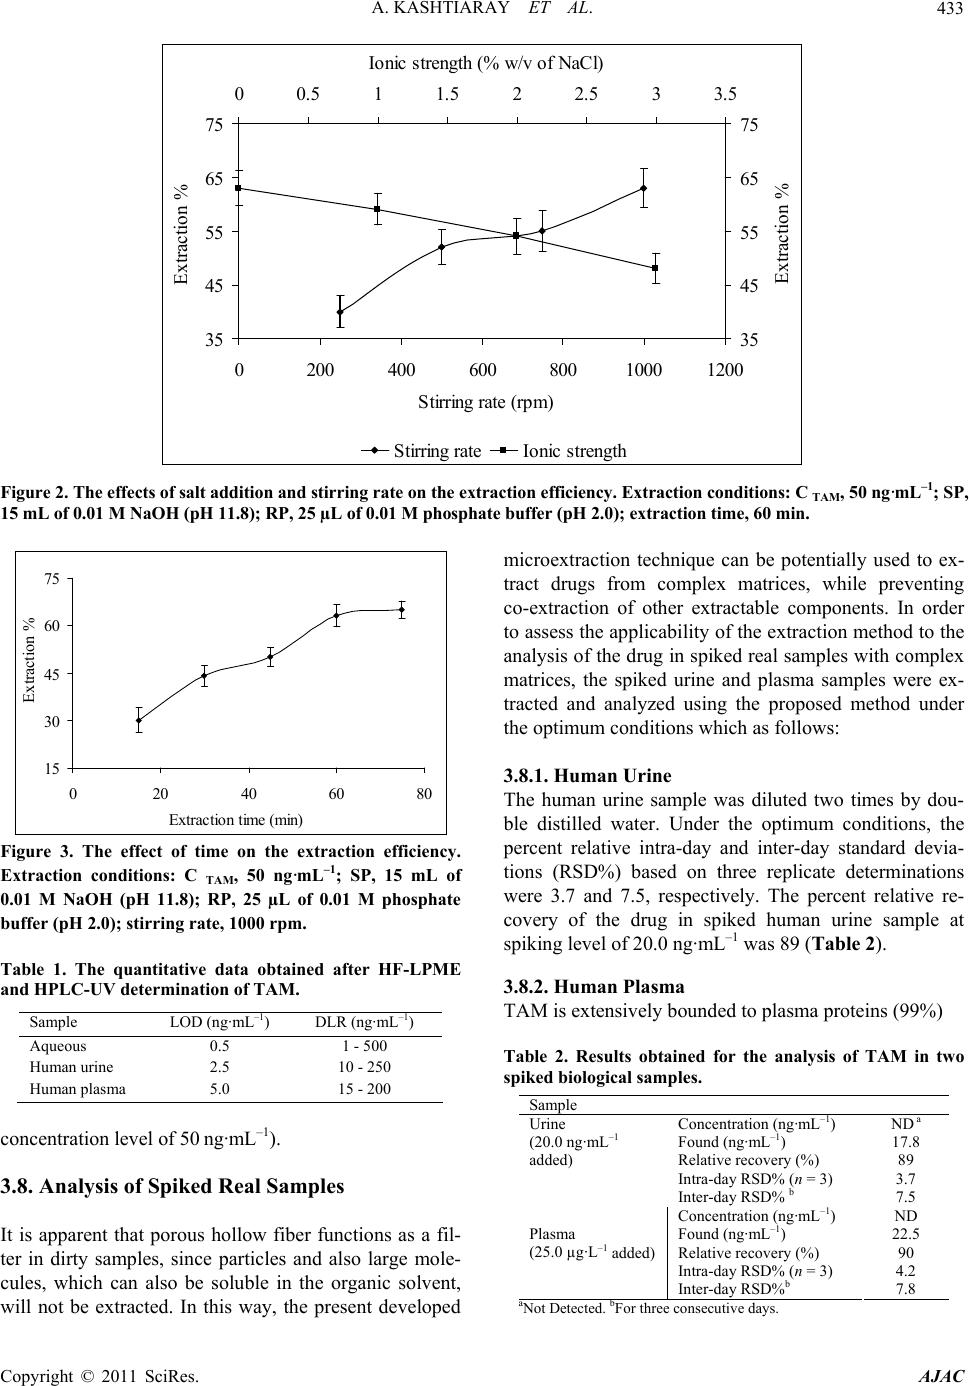 A. KASHTIARAY ET AL.433 35 45 55 65 75 0200 400 60080010001200 Stirring rate (rpm) Extraction % 35 45 55 65 75 00.511.522.533.5 Ionic strength (% w/v of NaCl) Extraction % Stirrin rateIonic stren th Figure 2. The effects of salt addition and stirring rate on the extraction efficiency. Extraction conditions: C TAM, 50 ng·mL–1; SP, 15 mL of 0.01 M NaOH (pH 11.8); RP, 25 µL of 0.01 M phosphate buffer (pH 2.0); extraction time, 60 min. 15 30 45 60 75 0204060 Extraction time (min) Extraction % 80 Figure 3. The effect of time on the extraction efficiency. Extraction conditions: C TAM, 50 ng·mL–1; SP, 15 mL of 0.01 M NaOH (pH 11.8); RP, 25 µL of 0.01 M phosphate buffer (pH 2.0); stirring rate, 1000 rpm. Table 1. The quantitative data obtained after HF-LPME and HPLC-UV determination of TAM. Sample LOD (ng·mL–1) DLR (ng·mL–1) Aqueous 0.5 1 - 500 Human urine 2.5 10 - 250 Human plasma 5.0 15 - 200 concentration level of 50 ng·mL–1). 3.8. Analysis of Spiked Real Samples It is apparent that porous hollow fiber functions as a fil- ter in dirty samples, since particles and also large mole- cules, which can also be soluble in the organic solvent, will not be extracted. In this way, the present developed microextraction technique can be potentially used to ex- tract drugs from complex matrices, while preventing co-extraction of other extractable components. In order to assess the applicability of the extraction method to the analysis of the drug in spiked real samples with complex matrices, the spiked urine and plasma samples were ex- tracted and analyzed using the proposed method under the optimum conditions which as follows: 3.8.1. Hum an U ri ne The human urine sample was diluted two times by dou- ble distilled water. Under the optimum conditions, the percent relative intra-day and inter-day standard devia- tions (RSD%) based on three replicate determinations were 3.7 and 7.5, respectively. The percent relative re- covery of the drug in spiked human urine sample at spiking level of 20.0 ng·mL–1 was 89 (Table 2). 3.8.2. Human Plasma TAM is extensively bounded to plasma proteins (99%) Table 2. Results obtained for the analysis of TAM in two spiked biological samples. Sample Concentration (ng·mL–1) Found (ng·mL–1) Relative recovery (%) Intra-day RSD% (n = 3) Inter-day RSD% b ND a 17.8 89 3.7 7.5 Urine (20.0 ng·mL–1 added) Plasma (25.0 µg·L–1 added) Concentration (ng·mL–1) Found (ng·mL–1) Relative recovery (%) Intra-day RSD% (n = 3) Inter-day RSD%b ND 22.5 90 4.2 7.8 aNot Detected. bFor three consecutive days. Copyright © 2011 SciRes. AJAC 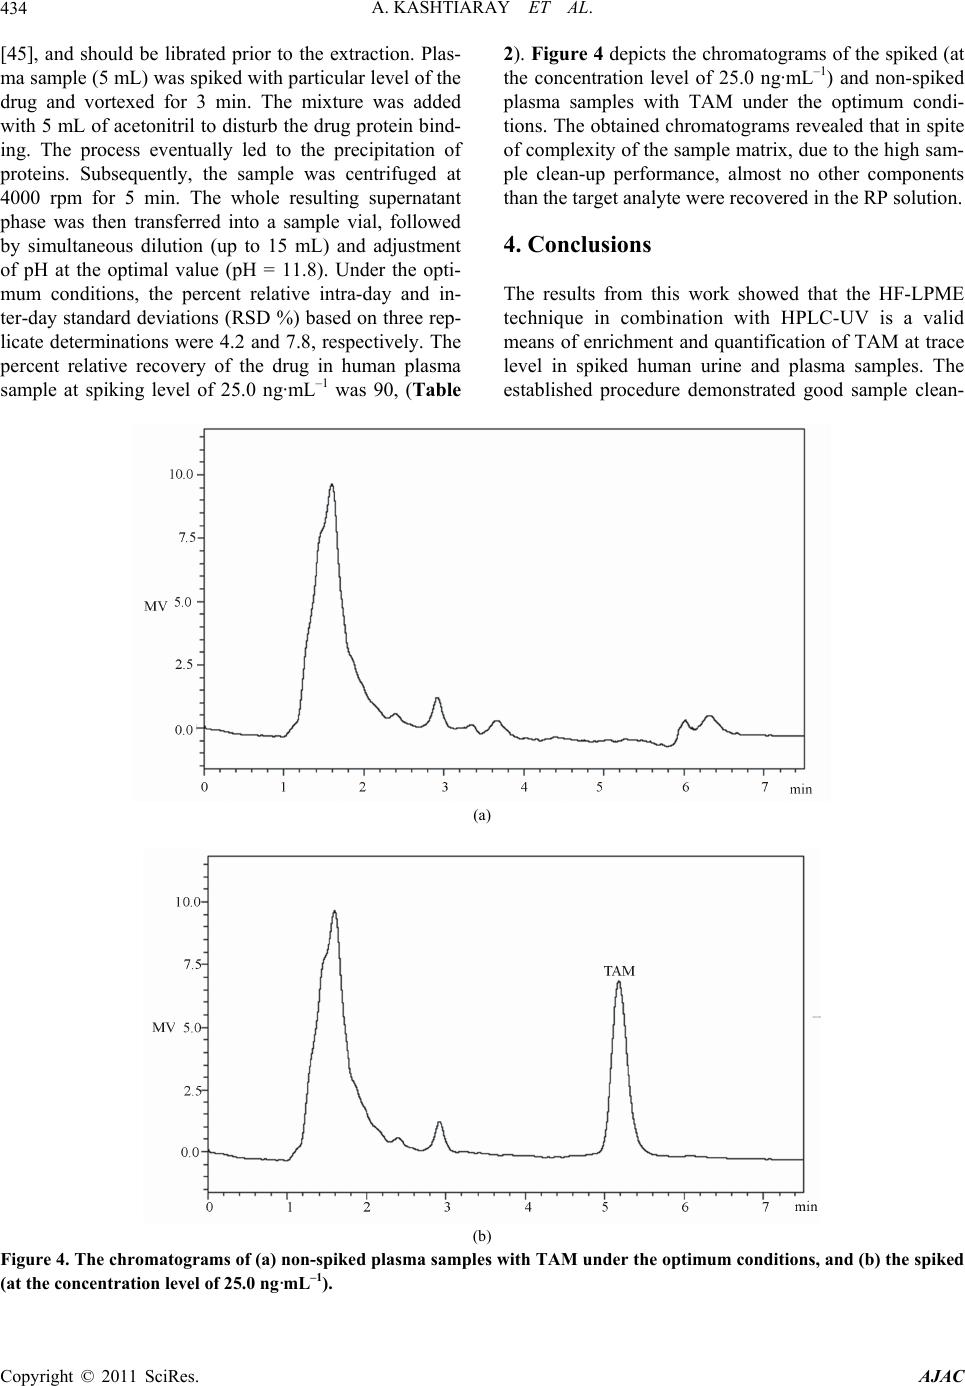 A. KASHTIARAY ET AL. 434 [45], and should be librated prior to the extraction. Plas- ma sample (5 mL) was spiked with particular level of the drug and vortexed for 3 min. The mixture was added with 5 mL of acetonitril to disturb the drug protein bind- ing. The process eventually led to the precipitation of proteins. Subsequently, the sample was centrifuged at 4000 rpm for 5 min. The whole resulting supernatant phase was then transferred into a sample vial, followed by simultaneous dilution (up to 15 mL) and adjustment of pH at the optimal value (pH = 11.8). Under the opti- mum conditions, the percent relative intra-day and in- ter-day standard deviations (RSD %) based on three rep- licate determinations were 4.2 and 7.8, respectively. The percent relative recovery of the drug in human plasma sample at spiking level of 25.0 ng·mL–1 was 90, (Table 2). Figure 4 depicts the chromatograms of the spiked (at the concentration level of 25.0 ng·mL–1) and non-spiked plasma samples with TAM under the optimum condi- tions. The obtained chromatograms revealed that in spite of complexity of the sample matrix, due to the high sam- ple clean-up performance, almost no other components than the target analyte were recovered in the RP solution. 4. Conclusions The results from this work showed that the HF-LPME technique in combination with HPLC-UV is a valid means of enrichment and quantification of TAM at trace level in spiked human urine and plasma samples. The established procedure demonstrated good sample clean- (a) (b) Figure 4. The chromatograms of (a) non-spiked plasma samples with TAM under the optimum conditions, and (b) the spiked (at the concentration level of 25.0 ng·mL–1). Copyright © 2011 SciRes. AJAC 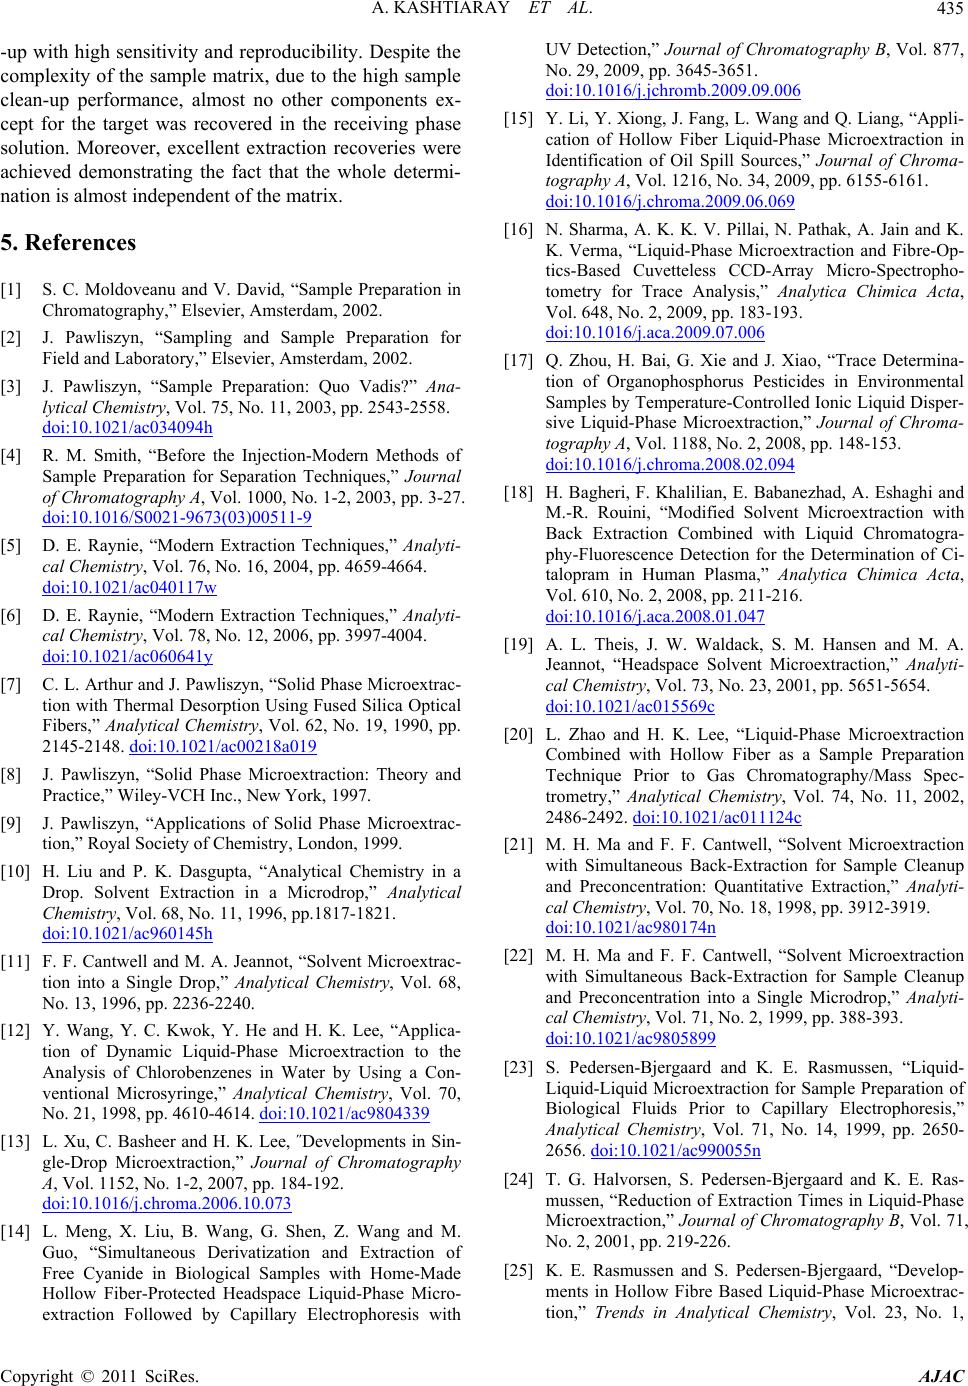 A. KASHTIARAY ET AL.435 -up with high sensitivity and reproducibility. Despite the complexity of the sample matrix, due to the high sample clean-up performance, almost no other components ex- cept for the target was recovered in the receiving phase solution. Moreover, excellent extraction recoveries were achieved demonstrating the fact that the whole determi- nation is almost independent of the matrix. 5. References [1] S. C. Moldoveanu and V. David, “Sample Preparation in Chromatography,” Elsevier, Amsterdam, 2002. [2] J. Pawliszyn, “Sampling and Sample Preparation for Field and Laboratory,” Elsevier, Amsterdam, 2002. [3] J. Pawliszyn, “Sample Preparation: Quo Vadis?” Ana- lytical Chemistry, Vol. 75, No. 11, 2003, pp. 2543-2558. doi:10.1021/ac034094h [4] R. M. Smith, “Before the Injection-Modern Methods of Sample Preparation for Separation Techniques,” Journal of Chromatography A, Vol. 1000, No. 1-2, 2003, pp. 3-27. doi:10.1016/S0021-9673(03)00511-9 [5] D. E. Raynie, “Modern Extraction Techniques,” Analyti- cal Chemistry, Vol. 76, No. 16, 2004, pp. 4659-4664. doi:10.1021/ac040117w [6] D. E. Raynie, “Modern Extraction Techniques,” Analyti- cal Chemistry, Vol. 78, No. 12, 2006, pp. 3997-4004. doi:10.1021/ac060641y [7] C. L. Arthur and J. Pawliszyn, “Solid Phase Microextrac- tion with Thermal Desorption Using Fused Silica Optical Fibers,” Analytical Chemistry, Vol. 62, No. 19, 1990, pp. 2145-2148. doi:10.1021/ac00218a019 [8] J. Pawliszyn, “Solid Phase Microextraction: Theory and Practice,” Wiley-VCH Inc., New York, 1997. [9] J. Pawliszyn, “Applications of Solid Phase Microextrac- tion,” Royal Society of Chemistry, London, 1999. [10] H. Liu and P. K. Dasgupta, “Analytical Chemistry in a Drop. Solvent Extraction in a Microdrop,” Analytical Chemistry, Vol. 68, No. 11, 1996, pp.1817-1821. doi:10.1021/ac960145h [11] F. F. Cantwell and M. A. Jeannot, “Solvent Microextrac- tion into a Single Drop,” Analytical Chemistry, Vol. 68, No. 13, 1996, pp. 2236-2240. [12] Y. Wang, Y. C. Kwok, Y. He and H. K. Lee, “Applica- tion of Dynamic Liquid-Phase Microextraction to the Analysis of Chlorobenzenes in Water by Using a Con- ventional Microsyringe,” Analytical Chemistry, Vol. 70, No. 21, 1998, pp. 4610-4614. doi:10.1021/ac9804339 [13] L. Xu, C. Basheer and H. K. Lee, ˝Developments in Sin- gle-Drop Microextraction,” Journal of Chromatography A, Vol. 1152, No. 1-2, 2007, pp. 184-192. doi:10.1016/j.chroma.2006.10.073 [14] L. Meng, X. Liu, B. Wang, G. Shen, Z. Wang and M. Guo, “Simultaneous Derivatization and Extraction of Free Cyanide in Biological Samples with Home-Made Hollow Fiber-Protected Headspace Liquid-Phase Micro- extraction Followed by Capillary Electrophoresis with UV Detection,” Journal of Chromatography B, Vol. 877, No. 29, 2009, pp. 3645-3651. doi:10.1016/j.jchromb.2009.09.006 [15] Y. Li, Y. Xiong, J. Fang, L. Wang and Q. Liang, “Appli- cation of Hollow Fiber Liquid-Phase Microextraction in Identification of Oil Spill Sources,” Journal of Chroma- tography A, Vol. 1216, No. 34, 2009, pp. 6155-6161. doi:10.1016/j.chroma.2009.06.069 [16] N. Sharma, A. K. K. V. Pillai, N. Pathak, A. Jain and K. K. Verma, “Liquid-Phase Microextraction and Fibre-Op- tics-Based Cuvetteless CCD-Array Micro-Spectropho- tometry for Trace Analysis,” Analytica Chimica Acta, Vol. 648, No. 2, 2009, pp. 183-193. doi:10.1016/j.aca.2009.07.006 [17] Q. Zhou, H. Bai, G. Xie and J. Xiao, “Trace Determina- tion of Organophosphorus Pesticides in Environmental Samples by Temperature-Controlled Ionic Liquid Disper- sive Liquid-Phase Microextraction,” Journal of Chroma- tography A, Vol. 1188, No. 2, 2008, pp. 148-153. doi:10.1016/j.chroma.2008.02.094 [18] H. Bagheri, F. Khalilian, E. Babanezhad, A. Eshaghi and M.-R. Rouini, “Modified Solvent Microextraction with Back Extraction Combined with Liquid Chromatogra- phy-Fluorescence Detection for the Determination of Ci- talopram in Human Plasma,” Analytica Chimica Acta, Vol. 610, No. 2, 2008, pp. 211-216. doi:10.1016/j.aca.2008.01.047 [19] A. L. Theis, J. W. Waldack, S. M. Hansen and M. A. Jeannot, “Headspace Solvent Microextraction,” Analyti- cal Chemistry, Vol. 73, No. 23, 2001, pp. 5651-5654. doi:10.1021/ac015569c [20] L. Zhao and H. K. Lee, “Liquid-Phase Microextraction Combined with Hollow Fiber as a Sample Preparation Technique Prior to Gas Chromatography/Mass Spec- trometry,” Analytical Chemistry, Vol. 74, No. 11, 2002, 2486-2492. doi:10.1021/ac011124c [21] M. H. Ma and F. F. Cantwell, “Solvent Microextraction with Simultaneous Back-Extraction for Sample Cleanup and Preconcentration: Quantitative Extraction,” Analyti- cal Chemistry, Vol. 70, No. 18, 1998, pp. 3912-3919. doi:10.1021/ac980174n [22] M. H. Ma and F. F. Cantwell, “Solvent Microextraction with Simultaneous Back-Extraction for Sample Cleanup and Preconcentration into a Single Microdrop,” Analyti- cal Chemistry, Vol. 71, No. 2, 1999, pp. 388-393. doi:10.1021/ac9805899 [23] S. Pedersen-Bjergaard and K. E. Rasmussen, “Liquid- Liquid-Liquid Microextraction for Sample Preparation of Biological Fluids Prior to Capillary Electrophoresis,” Analytical Chemistry, Vol. 71, No. 14, 1999, pp. 2650- 2656. doi:10.1021/ac990055n [24] T. G. Halvorsen, S. Pedersen-Bjergaard and K. E. Ras- mussen, “Reduction of Extraction Times in Liquid-Phase Microextraction,” Journal of Chromatography B, Vol. 71, No. 2, 2001, pp. 219-226. [25] K. E. Rasmussen and S. Pedersen-Bjergaard, “Develop- ments in Hollow Fibre Based Liquid-Phase Microextrac- tion,” Trends in Analytical Chemistry, Vol. 23, No. 1, Copyright © 2011 SciRes. AJAC  A. KASHTIARAY ET AL. Copyright © 2011 SciRes. AJAC 436 2004, pp. 1-10. doi:10.1016/S0165-9936(04)00105-0 [26] H. G. Ugland, M. Krogh and K. E. Rasmussen, “Liquid- Phase Microextraction as a Sample Preparation Tech- nique Prior to Capillary Gas Chromatographic-Deter- mination Ofbenzodiazepines in Biological Matrices,” Journal of Chromatography B, Vol. 749, No. 1, 2000, pp. 85-92. doi:10.1016/S0378-4347(00)00382-0 [27] K. E. Rasmussen, S. Pedersen-Bjergaard, M. Krogh, H. Ugland and T. Grønhaug, “Development of a Simple in-Vial Liquid-Phase Microextraction Device for Drug Analysis Compatible with Capillary Gas Chromatography, Capillary Electrophoresis and High-Performance Liquid Chromatography,” Journal of Chromatography A, Vol. 873, No. 1, 2000, pp. 3-11. doi:10.1016/S0021-9673(99)01163-2 [28] T. G. Halvorsen, S. Pedersen-Bjergaard and K. E. Ras- mussen, “Liquid-Phase Microextraction and Capillary Electrophoresis of Citalopram, an Antidepressant Drug,” Journal of Chromatography A, Vol. 909, No. 1, 2001, pp. 87-93. doi:10.1016/S0021-9673(00)00868-2 [29] E. Robinson, G. G. Kimmick and H. B. Muss, “Ta- moxifen in Postmenopausal Women: A Safety Perspec- tive,” Drugs & Aging, Vol. 8, No. 5, 1996, pp. 329-337. doi:10.2165/00002512-199608050-00002 [30] J. V. Kemp, H. K. Adam, A. E. Wakeling and R. Slater, “Identification and Biological Activity of Tamoxifen Me- tabolites in Human Serum,” Biochemical Pharmacology, Vol. 32, No. 13, 1983, pp. 2045-2052. doi:10.1016/0006-2952(83)90425-2 [31] R. Mihailescu, H. Y. Aboul-Enein and M. D. Efstatide, “Identification of Tamoxifen and Metabolites in Human Male Urine by GC/MS,” Biomedical Chromatography, Vol. 14, No. 3, 2000, pp.180-183. doi:10.1002/1099-0801(200005)14:3<180::AID-BMC95 8>3.0.CO;2-T [32] R. T. Sane, S. V. Desai, K. K. Sonawne and V. G. Nayak, “Quantitative Gas Chromatographic Determination of Ta- moxifen Citrate in Pharmaceuticals,” Journal of Chroma- tography A, Vol. 331, No. 2, 1985, pp. 432-436. doi:10.1016/0021-9673(85)80052-2 [33] R. R. Brown, R. Bain and V. C. Jordan, “Determination of Tamoxifen and Metabolites in Human Serum by High- -Performance Liquid Chromatography with Post-Column Fluorescence Activation,” Journal of Chromatography B, Vol. 272, 1983, pp. 351-358. doi:10.1016/S0378-4347(00)86138-1 [34] J. E. Manns, S. Hanks and J. E. Brown, “Optimised Se- paration of E- and Z-Isomers of Tamoxifen, and Its Prin- cipal Metabolites Using Reversed-Phase High Perform- ance Liquid Chromatography,” Journal of Pharmaceuti- cal and Biomedical Analysis, Vol. 16 , No. 5, 1998, pp. 847-852. doi:10.1016/S0731-7085(97)00116-7 [35] Y.-B. Zhu, Q. Zhang, J.-J. Zou, C.-X. Yu and D.-W. Xiao, “Optimizing High-Performance Liquid Chromatography Method with Fluorescence Detection for Quantification of Tamoxifen and Two Metabolites in Human Plasma: Application to a Clinical Study,” Journal of Pharmaceu- tical and Biomedical Analysis, Vol. 46, No. 2, 2008, pp. 349-355. doi:10.1016/j.jpba.2007.10.012 [36] J. M. Sanders, L. T. Burka, M. D. Shelby, R. R. Newbold and M. L. Cunningham, “Determination of Tamoxifen and Metabolites in Serum by Capillary Electrophoresis Using a Nonaqueous Buffer System,” Journal of Chro- matography B, Vol. 695, No. 1, 1997, pp. 181-185. doi:10.1016/S0378-4347(97)00099-6 [37] X. F. Li, S. J. Carter and N. J. Dovichi, “Non-Aqueous Capillary Electrophoresis of Tamoxifen and Its Acid Hy- drolysis Products,” Journal of Chromatography A, Vol. 895, No. 1-2, 2000, pp. 81-85. doi:10.1016/S0021-9673(00)00661-0 [38] J. Rodríguez Flores, J. J. Berzas Nevado, A. M. Contento Salcedo and M. P. Cabello Díaz, “Nonaqueous Capillary Electrophoresis Method for the Analysis of Tamoxifen, Imipramine and Their Main Metabolites in Urine,” Ta- lanta, Vol. 65, No. 1, 2005, pp. 155-162. [39] C. Murphy, T. Fotsis, P. Pantzar, H. Adlercreutz and F. Martin, “Analysis of Tamoxifen, N-Desmethyltamoxifen and 4-Hydroxytamoxifen Levels in Cytosol and KCl- -Nuclear Extracts of Breast Tumours from Tamoxifen Treated Patients by Gas Chromatoraphy-Mass Spec- trometry (GC-MS) Using Selected Ion Monitoring (SIM),” Journal of Steroid Biochemistry, Vol. 28, No. 6, 1987, pp. 609-618. doi:10.1016/0022-4731(87)90387-6 [40] H. K. Lim, S. Stellingweif, S. Sisenwine and K. W. Chan, “Rapid Drug Metabolite Profiling Using Fast Liquid Chromatography, Automated Multiple-Stage Mass Spec- trometry and Receptor-Binding,” Journal of Chromatog- raphy A, Vol. 83, No. 2, 1999, pp. 227-241. doi:10.1016/S0021-9673(98)00956-X [41] Z. L. Zhang and J. L. Zhou, “Simultaneous Determination of Various Pharmaceutical Compounds in Water by Sol- id-Phase Extraction-Liquid Chromatography-Tandem Mass Spectrometry,” Journal of Chromatography A, Vol. 1154, No. 1-2, 2007, pp. 205-213. doi:10.1016/j.chroma.2007.03.105 [42] W. Lu, G. K. Poon, P. L. Carmichael and R. B. Cole, “Analysis of Tamoxifen and Its Metabolites by on-Line Capillary Electrophoresis-Electrospray Ionization Mass Spectrometry Employing Nonaqueous Media Containing Surfactants,” Analytical Chemistry, Vol. 68, No. 4, 1996, pp. 668-674. doi:10.1021/ac950786x [43] P. Daneshgar, P. Norouzi, M. R. Ganjali and H. A. Za- mani, “Ultrasensitive Flow-Injection Electrochemical Method for Detection of Anticancer Drug Tamoxifen,” Talanta, Vol. 77, No. 3, 2009, pp. 1075-1080. doi:10.1016/j.talanta.2008.08.027 [44] S. Palmarsdottir, E. Thordarson, L. E. Edholm, J. A. Jonsson and L. Mathiasson, “Miniaturized Supported Li- quid Membrane Device for Selective on-Line Enrichment of Basic Drugs in Plasma Combined with Capillary Zone Electrophoresis,” Analytical Chemistry, Vol. 69, No. 9, 1997, pp. 1732-1737. [45] S. C. Paterson, C. K. Lim and K. D. Smith, “Analysis of the Interaction between Alpha-1-Acid Glycoprotein and Tamoxifen and Its Metabolites,” Biomedical Chroma- tography, Vol. 17, No. 2-3, 2003, pp. 143-148. doi:10.1002/bmc.230
|