 American Journal of Analyt ical Chemistry, 2011, 2, 401-410 doi:10.4236/ajac.2011.24049 Published Online August 2011 (http://www.SciRP.org/journal/ajac) Copyright © 2011 SciRes. AJAC Stress Degradation Behavior of a Polypill and Development of Stability Indicating UHPLC Method for the Simultaneous Estimation of Aspirin, Atorvastatin, Ramipril and Metoprolol Succinate Satheesh Kumar Shetty1,5 , K. V. Surendranath1, P. Radhakrishnanand1, Roshan M. Borkar2, Prashant S. Devrukhakar2, Johnson J o gul 3, Upendra Mani Tripathi4 1United States Pharmacopeia-India Private Limited, Research and Development Laboratory, ICICI Knowledge Park, Turkapally, S h ameerpet, Hyderabad, India 2NIPER Instititute of Pharmaceutical sciences, Hyderabad, India 3Department of Che mistry, St. Kittel Science College, Dharwad, Karnataka, India 4Startech Labs privat e Li mi te d, SMR Chambers Madinaguda, Hyderabad, India 5Department of Che mistry, Jawaharlal Nehru Technological University, Kukatpally, Hyderabad, India E-mail: Skshetty69@rediffmail.com, sks@usp.org. Received October 6, 2010; revised November 25, 2010; accepted December 5, 2010 Abstract A novel, sensitive and precise UHPLC method has been developed and validated for the simultaneous de- termination of the all the active components of a Polypill viz Zycad, i.e., Aspirin (ASP) Atorvastatin (ATV), Ramipril (RMP) and Metoprolol (MTP) in Zycad tablet dosage form in the presence of degradation products. Forced degradation of individual as well as combination of all the drug substances components of Polypill was conducted in accordance with ICH guidelines. Acidic, basic, neutral, and oxidative hydrolysis, thermal stress, and photolytic degradation were used to assess the stability-indicating power of the method. Use of 100 × 2.1 mm, 1.7 µm stationary phases with simple mobile phase combination buffer consisting of 0.1% Perchloric acid (adjusted to pH 2.5) and Acetonitrile, delivered in a gradient mode and quantitation was car- ried out using ultraviolet detection at 215 nm with a flow rate of 0.6 mL·min–1. The method was optimized using samples generated by forced degradation studies. The method was validated for linearity, accuracy (recovery), precision, Specificity and robustness. The method was linear in the range of 37.5 to 150.0 µg·mL–1 for ASP, 5.0 to 20.0 µg·mL–1 for ATV and 2.5 to 10.0 µg·mL–1 for RMP and 25.0 to 100.0 µg·mL–1 for MTP. Keywords: Liquid Chromatography; UHPLC, Polypill, Aspirin, Atorvastatin, Ramipril and Metoprolol Succinate, Forced Degradation, Validation, Stability Indicating 1. Introduction Ultra-high performance liquid chromatography is a new category of separation technique based upon well- established principles of liquid chromatography, which utilizes sub-2 μm particles for stationary phase. These particles operate at elevated mobile phase linear veloci- ties to affect dramatic increase in resolution, sensitivity & speed of analysis. Polypill is a fixed dose combination, used as a single daily pill to achieve a large effect in preventing cardiovascular disease with minimal adverse effects. The concept has been applied to pharmaceutical formulations in recent days [1-6]. In the present work, the UHPLC technology has been applied for the fast es- timation of the four main components of Polypill viz, Zycad in a single method. Zycad is a fixed dose combination of Aspirin (ASP), Atorvastatin (ATV), Ramipril (RMP) and Metoprolol Succinate (MTP). Each Zycad Polypill kit contains Aspi- rin 75 mg, Atorvastatin 10 mg, and Ramipril 5 mg in a single Capsule form and Metoprolol Succinate 50 mg as separate tablet. Aspirin (ASP), 2-acetoxybenzoic acid 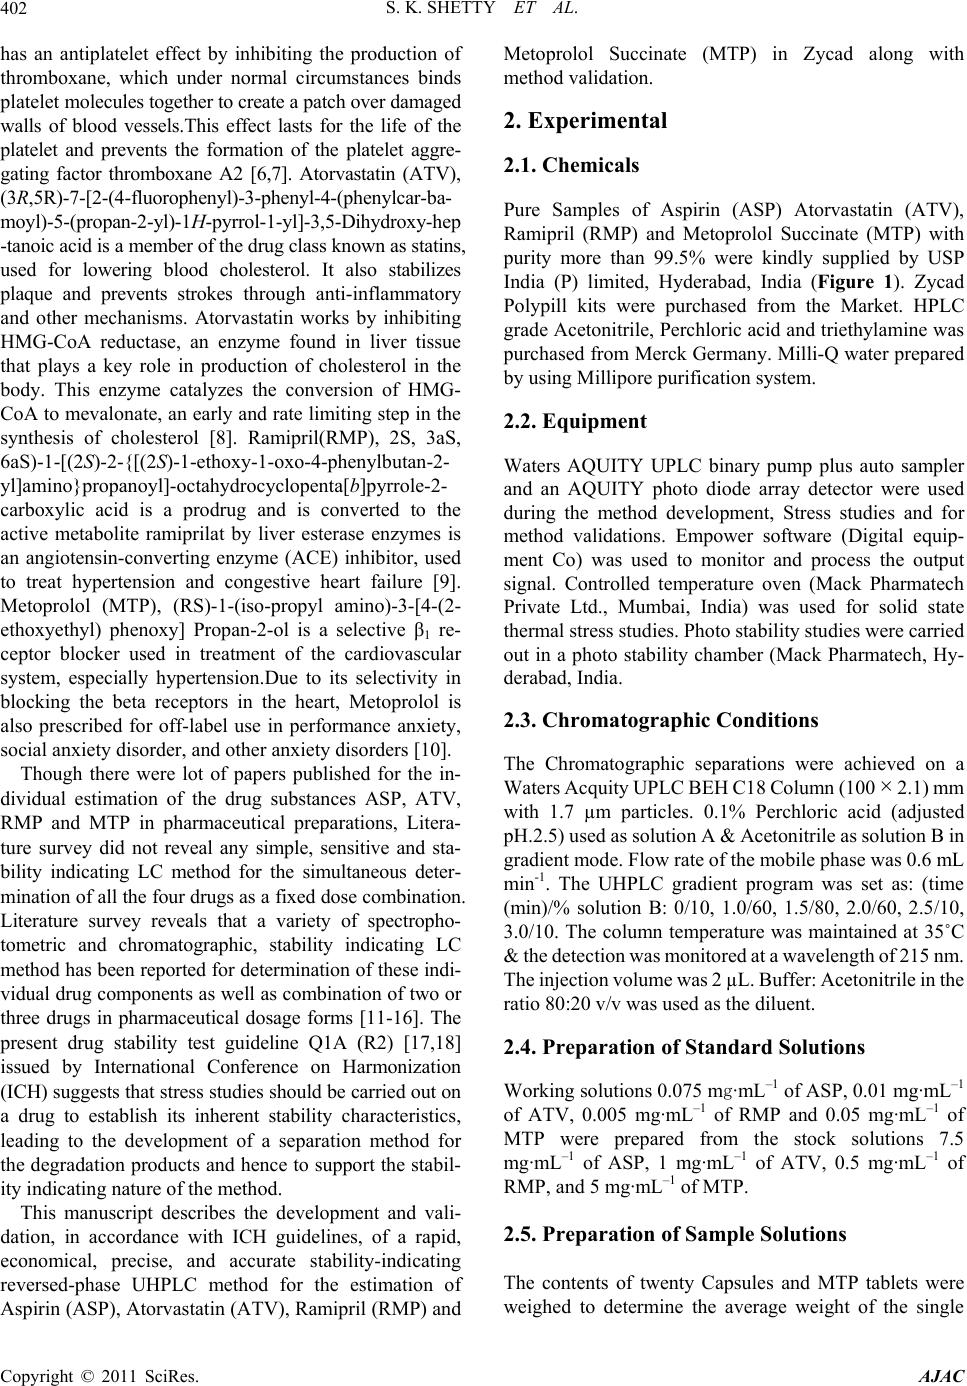 S. K. SHETTY ET AL. 402 has an antiplatelet effect by inhibiting the production of thromboxane, which under normal circumstances binds platelet molecules together to create a patch over damaged walls of blood vessels.This effect lasts for the life of the platelet and prevents the formation of the platelet aggre- gating factor thromboxane A2 [6,7]. Atorvastatin (ATV), (3R,5R)-7-[2-(4-fluorophenyl)-3-phenyl-4-(phenylcar-ba- moyl)-5-(propan-2-yl)-1H-pyrrol-1-yl]-3,5-Dihydroxy-hep -tanoic acid is a member of the drug class known as statins, used for lowering blood cholesterol. It also stabilizes plaque and prevents strokes through anti-inflammatory and other mechanisms. Atorvastatin works by inhibiting HMG-CoA reductase, an enzyme found in liver tissue that plays a key role in production of cholesterol in the body. This enzyme catalyzes the conversion of HMG- CoA to mevalonate, an early and rate limiting step in the synthesis of cholesterol [8]. Ramipril(RMP), 2S, 3aS, 6aS)-1-[ (2 S)- 2-{[( 2S)-1-ethoxy-1-oxo-4-phenylbutan-2- yl]amino}propanoyl]-octahydrocyclopenta[b]pyrrole-2- carboxylic acid is a prodrug and is converted to the active metabolite ramiprilat by liver esterase enzymes is an angiotensin-converting enzyme (ACE) inhibitor, used to treat hypertension and congestive heart failure [9]. Metoprolol (MTP), (RS)-1-(iso-propyl amino)-3-[4-(2- ethoxyethyl) phenoxy] Propan-2-ol is a selective β1 re- ceptor blocker used in treatment of the cardiovascular system, especially hypertension.Due to its selectivity in blocking the beta receptors in the heart, Metoprolol is also prescribed for off-label use in performance anxiety, social anxiety disorder, and other anxiety disorders [10]. Though there were lot of papers published for the in- dividual estimation of the drug substances ASP, ATV, RMP and MTP in pharmaceutical preparations, Litera- ture survey did not reveal any simple, sensitive and sta- bility indicating LC method for the simultaneous deter- mination of all the four drugs as a fixed dose combination. Literature survey reveals that a variety of spectropho- tometric and chromatographic, stability indicating LC method has been reported for determination of these indi- vidual drug components as well as combination of two or three drugs in pharmaceutical dosage forms [11-16]. The present drug stability test guideline Q1A (R2) [17,18] issued by International Conference on Harmonization (ICH) suggests that stress studies should be carried out on a drug to establish its inherent stability characteristics, leading to the development of a separation method for the degradation products and hence to support the stabil- ity indicating nature of the method. This manuscript describes the development and vali- dation, in accordance with ICH guidelines, of a rapid, economical, precise, and accurate stability-indicating reversed-phase UHPLC method for the estimation of Aspirin (ASP), Atorvastatin (ATV), Ramipril (RMP) and Metoprolol Succinate (MTP) in Zycad along with method validation. 2. Experimental 2.1. Chemicals Pure Samples of Aspirin (ASP) Atorvastatin (ATV), Ramipril (RMP) and Metoprolol Succinate (MTP) with purity more than 99.5% were kindly supplied by USP India (P) limited, Hyderabad, India (Figure 1). Zycad Polypill kits were purchased from the Market. HPLC grade Acetonitrile, Perchloric acid and triethylamine was purchased from Merck Germany. Milli-Q water prepared by using Millipore purification system. 2.2. Equipment Waters AQUITY UPLC binary pump plus auto sampler and an AQUITY photo diode array detector were used during the method development, Stress studies and for method validations. Empower software (Digital equip- ment Co) was used to monitor and process the output signal. Controlled temperature oven (Mack Pharmatech Private Ltd., Mumbai, India) was used for solid state thermal stress studies. Photo stability studies were carried out in a photo stability chamber (Mack Pharmatech, Hy- derabad, India. 2.3. Chromatographic Conditions The Chromatographic separations were achieved on a Waters Acquity UPLC BEH C18 Column (100 × 2.1) mm with 1.7 µm particles. 0.1% Perchloric acid (adjusted pH.2.5) used as solution A & Acetonitrile as solution B in gradient mode. Flow rate of the mobile phase was 0.6 mL min-1. The UHPLC gradient program was set as: (time (min)/% solution B: 0/10, 1.0/60, 1.5/80, 2.0/60, 2.5/10, 3.0/10. The column temperature was maintained at 35˚C & the detection was monitored at a wavelength of 215 nm. The injection volume was 2 µL. Buffer: Acetonitrile in the ratio 80:20 v/v was used as the diluent. 2.4. Preparation of Standard Solutions Working solutions 0.075 mg·mL–1 of ASP, 0.01 mg·mL–1 of ATV, 0.005 mg·mL–1 of RMP and 0.05 mg·mL–1 of MTP were prepared from the stock solutions 7.5 mg·mL–1 of ASP, 1 mg·mL–1 of ATV, 0.5 mg·mL–1 of RMP, and 5 mg·mL–1 of MTP. 2.5. Preparation of Sample Solutions The contents of twenty Capsules and MTP tablets were weighed to determine the average weight of the single Copyright © 2011 SciRes. AJAC  S. K. SHETTY ET AL.403 O HO O O (a) O HO HO HO N HN O F (b) N O OH O N H O O H H (c) OH O O NH (d) Figure 1. Chemical structures and labels of all the drug substances: ASP, ATV, RMP and MTP (a) Aspirin (ASP): 2-acetoxybenzoic acidM.F: C9H8O4 M.W: 180.16 g·mol–1; (b) Atorvastatin (ATV): (3R, 5R)-7-[2-(4-fluorophenyl)- 3-phenyl-4-(phenylcarbamoyl)-5-(propan-2-yl)-1H-pyrrol-1 -yl]-3,5-dihydroxyheptanoic acid. M.F:C33H35 F N2O5 M.W: 558.64 g·mol–1; (c) Ramipril (RMP): (2S,3aS,6aS)-1- [(2S)-2-{[(2S)-1-ethoxy-1-oxo-4-Phenylbutan-2-yl]amino} propanoyl]-octahydrocyclopenta[b] pyrrole-2-carboxylic acid M.F: C23H32N2O5 M. W: 416.51 g·mol–1; 9d) Meto- prolol (MTP): (RS)-1-(isopropyl amino)-3-[4-(2-ethoxyethyl) phenoxy] Propan-2-ol C15H25NO3.W: 267.34 g·mol–1. dosage unit. The contents of the Capsules and tablets were crushed to a homogeneous powder and a quantity equivalent to one dosage form (i.e. Equivalent to 75 mg ASP, 10 mg ATV, 5 mg RMP and 50 mg MTP) was weighed in to a 100-mL volumetric flask, extracted in diluents by sonicating for 10 mins, and filtered through Whatman no. 41 filter paper. The 1 ml of the clear fil- trate) was quantitatively transferred to a 10-mL volumet- ric flask, and solution was diluted to volume with the diluent. 2.6. Analytical Method Validation The method was validated for specificity, precision, sen- sitivity, linearity, accuracy, robustness, and system suit- ability. Forced degradation studies were performed on indi- vidual as well as mixture of all the four drugs, to provide an indication of stability indicating property and speci- ficity of the proposed method [19,20]. Acid hydrolysis was performed in 0.1 N HCl at reflux condition for 1 h. Basic hydrolysis was performed in 0.1N NaOH at reflux condition for 0.5 h. For studies in oxidation condition, the drug combina- tions were exposed to 5% H2O2. RT for 8 h. Photolytic degradation studies were performed carried out as per ICH Q1B.The dug samples was exposed to light for overall illumination of 1.2 × 10⁶ lux h and an integrated near ultraviolet energy of 200 W h m2. To study the thermal degradation the drug combinations were exposed to dry heat at 60˚C. Peak purity of stressed samples was checked by using a Acquity photo diode array detector (PDA). All stressed samples were analyzed for extended run time (30 min) to check for late-eluting degradation products. Initially, system suitability was prepared, by dissolv- ing appropriate amounts of all the four standard drug sub- stances in the diluents to get a final concentration of 75 µg·mL–1 ASP, 10 µg·mL–1 ATV, 5 µg·mL–1 RMP, and 50 µg·mL–1 MTP, and injecting into the LC system and evaluating the criteria like Resolution, USP Tailing fac- tor and No. of theoretical plates for each drug component. The optimized method was validated with respect to various parameters summarized in the ICH guideline Q2 (R1). The precision of the assay method was checked by in- jecting the 6 replicates of the sample preparations of the commercial tablet (Zycad).Repeatability (Intra-Day pre- cision) of the assay method was evaluated by carrying out six independent assays of the commercial tablets with concentrations 0.075 mg·mL–1 of ASP, 0.01 mg·mL–1 of ATV, 0.005 mg·mL–1 of RMP and 0.05 mg·mL–1 of MTP, against qualified reference standard Copyright © 2011 SciRes. AJAC  S. K. SHETTY ET AL. 404 3. Results and Discussions and calculating the % RSD of the assay results. Interme- diate precision (ruggedness) was evaluated by conduct- ing precision studies using different analysts and differ- ent columns in the same laboratory. LOD and LOQ for ASP, ATV, RMP, and MTP were estimated by injecting a series of dilute solutions with known concentrations. The precision study was also car- ried out at the LOQ level by injecting six individual preparations and calculating the RSD (%) of peak area for each drug components. To establish linearity and range, a stock solution con- taining 150 µg·mL–1 ASP, 20 µg·mL–1 ATV, 10 µg·mL–1 RMP, 100 µg·mL–1 MTP in methanol was diluted to yield solutions in the concentration range of 37.5 to 150.0 µg·mL–1 for ASP, 5.0 to 20.0 µg·mL–1 for ATV and 2.5 to 10.0 µg·mL–1 for RMP and 25.0 to 100.0 µg·mL–1 for MTP (i.e. 50 to 200% of analyte concentra- tions). The solutions were prepared and analyzed in trip- licate. Peak-area and concentration data were used to plot the calibration graph and by least squares linear regres- sion analysis, the correlation coefficients, slope and in- tercept values were calculated. For determination of accuracy, recovery studies were carried out by spiking analysis. Known amounts of each drug corresponding to 50%, 100%, and 150% of the tar- get test concentrations i.e. 75 µg·mL–1 ASP, 10 µg·mL–1 ATV, 5 µg·mL–1 RMP, and 50 µg·mL–1 MTP were added to a placebo mixture the sample was extracted, and the assay was evaluated against the standard and percentage recovery was calculated. Robustness was tested using the so-called “one factor at a time” method. The factors evaluated were flow rate, column temperature and pH. The experimental condi- tions were deliberately changed and the relative standard deviation for replicate injections of ATL, ASP, RMP and MTP peaks and the USP resolution factor between MTP and ASP peaks were evaluated. The mobile phase flow rate was 0.6 mL·min–1. This was changed by 0.05 units to 0.55 and 0.65 mL·min–1. The effect of column temperature was studied at 40˚C and 30˚C instead of 35˚C. The effect of buffer pH was studied at pH 2.4 and 2.6. The solution stability of ASP, ATV, RMP and MTP was carried out by leaving the test solution in tightly capped volumetric flasks at room temperature for 48 h and assayed at 6 h interval, against the freshly prepared standard solution. The mobile phase stability was car- ried out by assaying the freshly prepared sample solu- tion against the freshly prepared standard at 6 h interval up to 48 h. The percentage of RSD of assay of ASP, ATV, RMP and MTP was calculated for the study pe- riod during mobile phase and solution stability experi- men ts. 3.1. Method Development and Optimization A detection wavelength of 215 nm was used for method development work. This was established by preparing 100 µg·mL–1 solutions of each individual drug compo- nents of the formulation and scanning in UV-Visible spectrometer. Initial experiments during the analytical method de- velopment reveals that the critical challenge is to obtain adequate retention for the polar parent compound, MTP and ASP, while maintaining a reasonable elution time for the less-polar Atorvastatin (ATV) and to separate one of the degradation impurity Salicylic acid (SA) from the ASP peak. The ACQUTY UPLC BEH C18 (50 × 2.1) mm 1.7 um Column was chosen for initial trial with 0.1% Formic acid and Acetonitrile as the mobile phase. Different mo- bile phase compositions containing Formic acid and Acetonitrile (50:50–20:80 v/v) were tried. But was not successful in getting the good peak shapes for the Rami- pril (RMP). There were no improvements in the peak shape of the RMP even under different pH of the buffer. Using of 0.1% Orthophosphoric acid as buffer also un- successful in obtaining good peak shape for RMP. Al- though good separation was achieved with 25 mM So- dium perchlorate: Acetonitrile in the gradient mode, Atorvastatin and Ramipril peak symmetry was found to be greater than 2.0. The asymmetries of the peaks were improved by addition of Triethylamine (TEA) and ad- justing the mobile phase pH to 2.5 in the aqueous phase. The chromatographic separation with better peak shape was achieved using a mixture of aqueous 0.1% Perchloric acid and Acetonitrile in the ratio of 40:60 (v/v). However to improve the resolution between the closely eluting peaks, the method was changed to gradi- ent mode and optimized the gradient conditions. But when stressed samples injected with this optimized con- ditions, it was found that some of the degradants, co eluted with the principal peaks. So the length of the column is increased to 100 mm and the method was op- timized to separate all the degradants from the main peaks by changing to Gradient mode. Several gradient conditions were tried before optimizing the final gradient programme as: time (min)/% solution B: 0/10, 1.0/60, 1.5/80, 2.0/60, 2.5/10, 3.0/10. As peak shape of Atenolol (ATL) was one of the issue even after optimizing the LC parameters, effect of the diluent on the peak shapes was studied by changing so many combinations of the diluents. The ATL peak was observed as split in most of the compositions of the buffer Copyright © 2011 SciRes. AJAC  S. K. SHETTY ET AL. Copyright © 2011 SciRes. AJAC 405 3.3. Results of Forced Degradation Study and Acetonitrile. Finally Buffer: Acetonitrile in the ratio 80:20, v/v, was optimized as the diluent to obtain good peak shapes. Specificity/Application of Stress (Forced Degradation Study) 3.2. Optimization of Chromatographic Singh and Bakshi suggested target degradation of 20% - 30% when establishing the stability-indicating properties of analytical methods, because even intermediate degra- dation products should not interfere with any stage of drug analysis. Stress studies on combination of all the four drugs under different stress conditions suggested the following degradation behavior. The combination of the drugs showed considerable stability under thermal condi- tions. Conditions for UHPLC The satisfactory chromatographic separation, with good peak shapes were achieved on ACQUTY UPLC BEH C18 ( 100 × 2.1) mm with 1.7 µm particles, using 0.1% Perchloric acid (adjusted to pH 2.5 with Triethylamine) as solution A and Acetonitrile as solution B with a flow rate of 0.6 mL·min–1. The UHPLC gradient program was optimized as: (time (min)/% solution B: 0/10, 1.0/60, 1.5/80, 2.0/60, 2.5/10, 3.0/10. The Column temperature as maintained at 35˚C and the detection was monitored at a wavelength of 215 nm. The injection volume was 2 µL. Buffer: Acetonitrile (80:20, v/v) was used as diluent. The method was found to be high degree of specificity to the drugs viz ASP, ATV, RMP, and MTP. All drugs were well separated from one another as well as resolved from degraded impurities. The specificity of the method was confirmed by the separation of all the peaks in the degraded samples obtained under different conditions. In the optimized gradient conditions MTP, ASP, SA, RMP and ATV were well separated with a resolution (Rs) of greater than 2 and the typical retention times of MTP, ASP, SA, RMP and ATV 1.12, 1.16, 1.27, 1.42 and 1.78 respectively .Peak purity of stressed samples of all the four drug substances were checked by using Acquity Photo diode array detector. All stressed samples of the drug product (heat (100˚C), acid hydrolysis (0.1 N HCl), base hydrolysis (0.1 N NaOH), water hydrolysis and oxidation (5% H2O2) were analyzed for extended run time of 60 min to check the late eluting degradants. The mixture of all the four drug components was ex- posed to 0.1 N HCl at 100˚C for 1 h. ASP and ATV Showed considerable degradation with time in 0.1 N HCl with the formation of Salicylic acid (SA) as the major degradant Figure 2. When treated under basic conditions, ASP and RMP has shown significant degradation immediately in 0.1 N NaOH with ASP is converted into salicylic acid (SA) (Figure 3). Under oxidation conditions, ASP and ATV has 0. 38 8 0. 49 2 A spirin - 1. 14 6 1.205 S alicylic acid - 1.253 Ramipril - 1. 400 A torvas tatin - 1. 7 55 1. 865 1. 963 AU 0.00 0.10 0.20 0.30 0.40 0.50 0.60 0.70 Time min 0.00 0.20 0.40 0.600.80 1.00 1.201.40 1.60 1.80 2.002.20 2.40 2.60 2.80 3. 0 Figure 2. Typical chromatogram of acid degradation, 0.1 N HCl (100˚C, 1 h).  S. K. SHETTY ET AL. 406 0. 422 1. 082 A spi ri n - 1.146 1.205 S al icyl i c acid - 1.253 Rami pri l - 1. 404 A t o rv astati n - 1.753 1. 891 1. 963 2. 116 AU 0.00 0.10 0.20 0.30 0.40 0.50 0.60 0.70 0.80 0.90 Time min 0.00 0.200.40 0.60 0.80 1.00 1.201.40 1.601.80 2.00 2.20 2.402.602.803.0 Figure 3. Typical chromatogram of base degradation, 0.1 N NaOH (under reflux, 0.5 h). showed considerable degradation by the treatment of 5 hydrogen peroxide. Typical chromatogram is as shown in Figure 4. All the four drug combinations were exposed to light for an overall illumination of 1.2 million lux hours and an integrated near ultraviolet energy of 200-watt hours/ square meter (w/m hr) (in photo stability chamber. Major degradation observed with ATV (Figure 5). The proposed method is applied for the assay analysis of 3 different batches of the Zycad. The assay results obtained were within the specification limit. The assay of Polypill is unaffected in the presence of degradation im- purities confirming the stability indicating power of the developed method. The stability indicating nature of the method was further confirmed by injecting three month accelerated stability sample and observed that all the degradants were well separated from the main compo- nents. For all the stressed sample injections, peak purity was checked by using a Acquity photo diode array detector (PDA). Peak purity test results derived from PDA detector, confirmed that the all the four drug components were homogeneous and pure in all the analyzed stress samples. 3.4. Analytical Method Validation: The developed chromatographic method was validated for selectivity, linearity, range, precision, accuracy, sen- sitivity, robustness and system suitability. The typical chromatogram of System suitability shown in Figure 6. The results of system suitability were depicted in Table 1. 3.4.1. Precision The percentage RSD values for the assays in precision study were 0.4%, 0.8%, 0.4%, 0.5% (inter-day precision) and 0.5%, 0.8%, 0.6%, 0.7% (intra-day precision) for ASP, ATV, RMP, and MTP confirming a good precision and the ruggedness of the method. 3.4.2. Sensiti vity The limits of detection (LOD) and quantitation (LOQ) were established at signal-to-noise ratios of 3:1 and 10:1, respectively. The LOD and LOQ of ASP, ATV, RMP and MTP were determined experimentally by injecting each drug six times. The LOD for ASP, ATV, RMP and MTP were 0.1, 0.2, 0.25 and 0.12 µg·mL–1 respectively. The LOQ for ASP, ATV, RMP and MTP were 0.3, 0.7, 0.8 and 0.4 µg·mL–1, respectively. 3.4.3. Linearity The linear ranges were from ((37.5 to 150.0 µg·mL–1 for ASP, 5.0 to 20.0 µg·mL–1 for ATV and 2.5 to 10.0 µg·mL–1 for RMP and 25.0 to 100.0 µg·mL–1for MTP). The correlation coefficient Obtained was greater than 0.999. The Slope and the Intercept value obtained from the linear regression graph is as shown in (Table 2). The result shows an excellent correlation existed between the peak area and concentration of the analyte in the range 50% - 200% of analyte concentration 3.4.4. Accu racy The percentage recovery obtained was in the range of 99.02% to 100.8%. The results indicate the method en- ables highly accurate simultaneous determination of the Copyright © 2011 SciRes. AJAC  S. K. SHETTY ET AL. 407 P eroxide - 0.409 0. 670 0. 942 0. 96 7 A spi ri n - 1.15 0 1.197 S ali cylic acid - 1.258 Ramipril - 1. 404 1.451 1. 479 1. 520 1. 56 4 1. 58 7 1. 613 1. 636 1. 65 3 1. 79 0 1. 96 6 2. 09 3 2. 218 2. 796 AU 0.00 0.50 1.00 1.50 2.00 2.50 3.00 Time min 0.00 0.20 0.40 0.60 0.80 1.00 1.20 1.40 1.60 1.80 2.002.20 2.40 2.60 2.803.0 Figure 4. Typical chromatogram of Peroxide degradation, 5% hydrogen peroxide (RT, 8 h). Aspirin - 1. 155 1. 198 S al i cylic aci d - 1.264 Ram i p ril - 1. 411 1. 564 1. 619 A torvastatin - 1.761 1. 820 1. 871 1. 897 1. 970 2. 040 2. 098 AU 0.00 0.10 0.20 0.30 0.40 0.50 0.60 0.70 0.80 Time min 0.00 0.200.40 0.60 0.80 1.00 1.20 1.40 1.60 1.80 2.00 2.20 2.40 2.60 2.80 3.0 Figure 5. Typical chromatogram of photo stability degradation. all the four drugs in the Polypill combination. 3.4.5. Robustness The results obtained by deliberate variation in method parameters and data are summarized in Table 3. The data revealed that the resolution between closely eluting peaks, namely ASP and MTP was always greater than 2.0 and also there was not much effect on the peak shapes, illustrating the robustness of the method 3.4.6. Solution Stability and Mobile Phase Stability The % RSD of assay of Polypill during solution stability and mobile phase stability experiments was less than 1.0. No significant changes were observed in the content of ASP, ATV, RMP, and MTP during the study. The solu- tion stability and mobile phase stability experiments data confirms that sample solutions and mobile phase used during assay determination were stable up to the study period of 48 h. Assay analysis was performed for different batches of the drug product in tablets (n = 3), with the targeted ana- lyte concentration. The assay results obtained for the three Zycad Polypill tablets were, ZYD/001 (99.7% ASP, 99.8% ATV, 100.2% RMP and 99.6% MTP), ZYD/002 (99.6% ASP, 100.3% ATV, 99.4% RMP and 99.8% MTP) and ZYD/003 (100.1% ASP, 99.9% ATV, 99.7%. C opyright © 2011 SciRes. AJAC  S. K. SHETTY ET AL. 408 Met oprol ol - 1. 105 A spirin - 1.14 2 Salicylic acid - 1.250 Ramipri l - 1. 397 Atorvastatin - 1.749 AU 0.00 0.10 0.20 0.30 0.40 0.50 0.60 Time min 0.000.200.40 0.600.80 1.00 1.201.40 1.60 1.802.002.20 2.402.60 2.80 3.0 Figure 6. Typical chromatogram of System suitability. Table 1. System suitability results. Compound Retention time USP Resolution (RS ) USP Tailing factor (T) USP Plate count(N) MTP 1.12 1.14 58245 ASP 1.16 2.08 1.11 60939 SA 1.27 5.42 1.14 64823 RMP 1.42 6.68 1.15 60868 ATV 1.78 16.86 1.05 137740 Table 2. Result of Linearity study. ASP ATV RMP MTP Calibration Equn. Y = 4690X + 3976 Y = 907X – 6273.8 Y = 292X – 4881.7 Y = 200X – 710.3 Linearity Range 50% - 200% 50% - 200% 50% - 200% 50% - 200% R2 0.999 0.999 0.997 0.999 Slope 4689.9 907 292.4 1909.9 Intercept 3976 –6273.8 –4881.7 –710.3 Table 3. Result of Robustness study. S.No Parameter Variation Resolution (Rs) between MTP and ASP 1 Temperature (± 5˚C of set temperature) (a) At 30˚C (b) At 40˚C 2.1 1.9 2 Flow rate (± 20% of the set flow) (a) At 0.55 mL·min–1 (b) At 0.65 mL·min–1 2.0 1.9 3 pH Buffer (a) pH 2.4 (b) pH 2.6 1.9 2.0 Table 4. Batch analysis for Zycad drug product. Batch No: ASP (%assay) ATV (%assay) RMP (%assay) MTP (%assay) ZYD/001 99.7 99.8 100.2 99.6 ZYD/002 99.6 100.3 99.4 99.8 ZYD/003 100.1 99.9 99.7 100.3 C opyright © 2011 SciRes. AJAC  S. K. SHETTY ET AL. 409 RMP and 100.3% MTP) depicted in Table 4. 3.5. Application of the Method to Stability Study Accelerated conditions stability studies are performed to establish the stability indicating nature of the method. Accelerated conditions (temperature 40 ± 2˚C, relative humidity 75 ± 5%) stored sample of the four drug com- binations were analyzed by use of the developed UHPLC method after the period of 3 months. The results obtained clearly indicates that the method is able to separate all the drug-drug interaction impurities or any other degra- dation impurities formed during the storage conditions, indicating the method was stability-indicating and highly suitable for drug stability studies and for monitoring the quality of the Polypill. 4. Acknowledgements The authors wish to thank the management of United States Pharmacopeia laboratory- India for supporting this work 5. References [1] G. Sanz and V. Fuster, “Fixed-Dose Combination Ther- apy and Secondary Cardiovascular Prevention: Rationale, Selection of Drugs and Target Population,” Nature Clinical Practice Cardiovascular Medicine, Vol. 6, No. 2, 2009), pp. 101-110. doi:10.1038/ncpcardio1419 [2] “Global Burden of Disease 2004 Update,” World Health Organization, 2008. [3] C. D. Mathers and D. Loncar, “Projections of Global Mortality and Burden of Disease from 2002 to 2030,” PLoS Medicine, Vol. 3, No. 11, 2006, p. e442. doi:10.1371/journal.pmed.0030442 [4] M. R. Law and N. J. Wald, “Risk Factor Thresholds: Their Existence under Scrutiny,” British Medical Journal, Vol. 324, No. 7353, 2002, pp. 570-576. doi:10.1136/bmj.324.7353.1570 [5] V. Kumar, R. P. Shah and S. Singh, “LC and LC–MS Methods for the Investigation of Polypills for the Treat- ment of Cardiovascular Diseases: Part.1 Separation of Active Compo,” Journal of Pharmaceutical and Bio- medical Analysis, Vol. 47, 2008, pp. 508-515. doi:10.1016/j.jpba.2008.01.041 [6] S. P. Clissold, “Aspirin and Related Derivatives of Sali- cylic Acid,” Drugs, Vol. 32, 1986, pp. 8-26. doi:10.2165/00003495-198600324-00003 [7] D. G. Julian, D. A. Chamberlain and S. J. Pocock, “A Comparison of Aspirin and Anticoagulation Following Thrombolysis for Myocardial Infarction (the AFTER Study): A Multicentre Unblinded Randomized Clinical Trial,” BMJ (British Medical Journal), Vol. 313, No. 7070, 1996, pp. 1429-1431. [8] J. W. Nawrocki, S. R. Weiss, M. H. Davidson, D. L. Sprecher, S. L. Schwartz, P. J. Lupien, P. H. Jones, H. E. Haber, et al., “Reduction of LDL Cholesterol by 25% to 60% in Patients with Primary Hypercholesterolemia by Atorvastatin, a New HMG-CoA Reductase Inhibitor,” Arteriosclerosis, Thrombosis, and Vascular Biology, Vol. 15, No. 5, May 1995, pp. 678-682. doi:10.1161/01.ATV.15.5.678 [9] L. Pilot, M. Abrahamowicz, M. Eisenberg, K. Humphries, H. Behlouli and J. V. Tu, “Effect of Different Angio- tensin-Converting-Enzyme Inhibitors on Mortality among Elderly Patients with Congestive Heart Failure,” Cana- dian Medical Association Journal, Vol. 178, No. 10, 2008, pp. 1303-1311. doi:10.1503/cmaj.060068 [10] Q. Zhang, H. Jin, L. Wang, J. Chen, C. Tang and J. Du, “Randomized Comparison of Metoprolol Versus Con- ventional Treatment in Preventing Recurrence of Vas- ovagal Syncope in Children and Adolescents,” Interna- tional Medical Journal of Experimental and Clinical Re- search, Vol. 14, No. 4, pp. 199-203. [11] E. R. Montgomery, S. Taylor, J. Segretario, et al., “De- velopment and Validation of a Reversed-Phase Liquid Chromatographic Method for Analysis of Aspirin and Warfarin in a Combination Tablet Formulation,” Journal of Pharmaceutical and Biomedical Analysis, Vol. 15, No. 1, 1996, pp. 73-82. [12] S. Erturk, A. E. Sevinc, L. Ersoy and S. Ficicioglu, “HPLC Method for the Determination of Atorvastatin and Its Impurities in Bulk Drug and Tablets,” Journal of Pharmaceutical and Biomedical Analysis, Vol. 33, No. 5, 2003, pp. 1017-1023. doi:10.1016/S0731-7085(03)00408-4 [13] A. Puratchikody, R. Valarmathy and P. Shiju, “RP-HPLC Determination of Atorvastatin Calcium in Solid Dosage Forms,” Journal of Pharmacological Reviews, 2003, pp. 79-80. [14] H. J. Panchal, B. N. Suhagia, N. J. Patel, I. S. Rathod, B. H. Patel, “Development and Validation of a HPTLC Method for the Simultaneous Estimation of Atorvastatin Calcium and Ezetimibe,” Chromatographia, Vol. 69, No. 1-2, 2009, pp. 91-95. doi:10.1365/s10337-008-0831-z [15] F. Belal, I. A. Al-Zaagi, E. A. Gadkariem and M. A. Abounassif, “A Stability-Indicating LC Method for the Simultaneous Determination of Ramipril and Hydro- chlorothiazide in Dosage Forms,” Journal of Pharmaceu- tical and Biomedical Analysis, Vol. 24, No. 3, 2001, pp. 335-342. doi:10.1016/S0731-7085(00)00474-X [16] M. B. Shankar, F. A. Metha, K. K. Bhatt, R. S. Metha and M. Geetha, “Simultaneous spectrophotometric determi- nation of losartan potassium and hydrochlorothiazide in tablets,” Indian Journal of Pharmaceutical Sciences, Vol. 65, No. 2, 2003, pp. 167-170. [17] “ICH Stability Testing of New Drug Substances and Products Q1A (R2),” International Conference on Har- monization, IFPMA, Geneva, 2003. [18] “ICH guidelines on Validation of Analytical Procedures, Text and Methodology Q2 (R1),” FDA, Published in the Federal Register 60, 1995. [19] “United States Pharmacopoeia,” 32nd Edition, United C opyright © 2011 SciRes. AJAC  S. K. SHETTY ET AL. Copyright © 2011 SciRes. AJAC 410 States Pharmacopeial Convention, Rockville, USP 32, 2009. [20] M. Bakshi and S. Singh, “Development of Validated Stability-Indicating Assay Methods-Critical Review,” Journal of Pharmaceutical and Biomedical Analysis, Vol. 28, 2002, pp. 1011-1040.
|