Journal of Transportation Technologies, 2011, 1, 47-53
doi:10.4236/jtts.2011.13007 Published Online July 2011 (http://www.scirp.org/journal/jtts)
Copyright © 2011 SciRes. JTTS
47
Air Traffic Volume and Air Traffic Control Human Errors
Woo-Choon Moon, Kwang-Eui Yoo, Youn-Chul Choi
Ministry of Land, Transport and Maritime Affairs, Gwacheon-si, Korea
School of Air Transport, Transportation, Logistics and Air Law, Korea Aerospace University, Goyang City, Korea
School of Aeronautical Engineering, Han S eo U ni versi t y, Seosam-si, Korea
E-mail: munkr1@hanmail.net, keyoo@kau.ac.kr, pilot@hanseo.ac.kr
Received April 5, 2011; revised May 11, 2011; accepted May 22, 2011
Abstract
Navigable airspaces are becoming more crowded with increasing air traffic, and the number of accidents
caused by human errors is increasing. The main objective of this paper is to evaluate the relationship be-
tween air traffic volume and human error in air traffic control (ATC). First, the paper identifies categories
and elements of ATC human error through a review of existing literature, and a study through interviews and
surveys of ATC safety experts. And then the paper presents the results of an experiment conducted on 52 air
traffic controllers sampled from the Korean ATC organization to find out if there is any relationship between
traffic volume and air traffic controller human errors. An analysis of the experiment clearly showed that sev-
eral types of ATC human error are influenced by traffic volume. We hope that the paper will make its con-
tribution to aviation safety by providing a realistic basis for securing proper manpower and facility in accor-
dance with the level of air traffic volume.
Keywords: ATC, Human Error, Air traffic volume, Workload
1. Introduction
The objectives of the air traffic services shall be to pre-
vent collisions between aircraft, prevent collisions be-
tween aircraft on the manoeuvring area and obstructions
on that area, expedite and maintain an orderly flow of air
traffic, provide advice and information useful for safe
and efficient conduct of flights, notify appropriate or-
ganizations regarding aircraft in need of search and res-
cue aid, and assist such organizations as required [1]. In
order to achieve this purpose, air traffic controllers
should be especially apt to deal with the interaction be-
tween humans and mechanical devices while they pro-
vide directions or advices to pilots to maintain vertical
and horizontal separations between aircrafts and avoid
aircraft collision. Accordingly, the air traffic controllers
need to conduct multiple functions at the same time, such
as thinking, listening and speaking. Considering the
complicated nature of this task, one would wonder
whether there is a higher probability for an air traffic
controller to make mistakes when traffic is heavier. The
objective of this paper is to investigate if air traffic con-
trol (ATC) human error is influenced by the size of traf-
fic volume.
First, categories and elements of ATC human error
was studied through existing literature, and interviews
and surveys of ATC safety experts. And then the paper
presents the results of an experiment conducted on 52 air
traffic controllers sampled from the Korean ATC or-
ganization, to find out if there is a relationship between
traffic volume and air traffic controller human error. It
should also be noted that we used an ATC simulator in-
vented by the Korean Government for this experiment.
2. ATC Human Error and Air Traffic
Volume
It is known that a lot of aircraft accidents are caused both
directly and indirectly by human factors. Considering
that human factor involves all aeronautical personnel
who are related to aircraft operations, it is critical to do
an in-depth research on the human factors of pilots and
air traffic controllers who take the most crucial roles in
aircraft operations. As for pilots, there are various studies
and solutions that deal with issues such as the Cockpit
Resource Management (CRM) and incorporation of a
human resource management system into the Line Ori-
ented Flight Training (LOFT). However, researches on
the ATC human factor have been relatively inactive.
According to the Boeing Company, it turned out that
48 W. C. MOON ET AL.
of the commercial aircraft accidents for the past 10 years,
55% were caused by pilot error, 17% by aircraft defect,
13% by weather condition, 5% by airport and ATC, 3%
by maintenance and 7% by miscellaneous matters [2].
Although ATC accounted for only 5% of commercial
aircraft accidents, which is comparatively lower than
other factors, it should not be overlooked that the 55%
portion for which pilot error accounts, either directly or
indirectly involves ATC because the cooperation be-
tween a pilot and an air traffic controller composes a
significant part of aircraft operation.
Inspired by the current CRM program originally de-
signed for the airline cockpit crew, EUROCONTROL
has developed Team Resources Management (TRM) in
order to research human factors in air traffic controllers
[3]. FAA has also created a new area called “ATC-
CRM” for the study of controllers’ errors [4].
The definition of air traffic volume used for ATC
purposes is the maximum number of aircraft entering a
sector in a given length of time. It is generally accepted
that heavy traffic volume may present an excessively
heavy workload to ATC personnel [5] and may thus re-
sult in a higher probability of error [6]. So, it is also nec-
essary to examine workload increase according to traffic
volume increase. US Federal Aviation Administration
(FAA) has reported that supplementary manpower in
ATC is not provided in a timely manner, which cones-
quently causes a heavy workload and finally leads to
more accidents [7]. The ATC workload standard of
EUROCONTROL is as described in the following table
[8].
As ATC control sectors become more complicating
because of the increase in air traffic volume worldwide,
there have been efforts to rearrange sector structures and
introduce more enhanced and automated ATC systems
all around the world. However, due to the increase of
information as well as air traffic volume, air traffic con-
trollers are exposed to problems and situations that they
have never experienced before, consequently increasing
workload which is the cause of human errors [9]. The
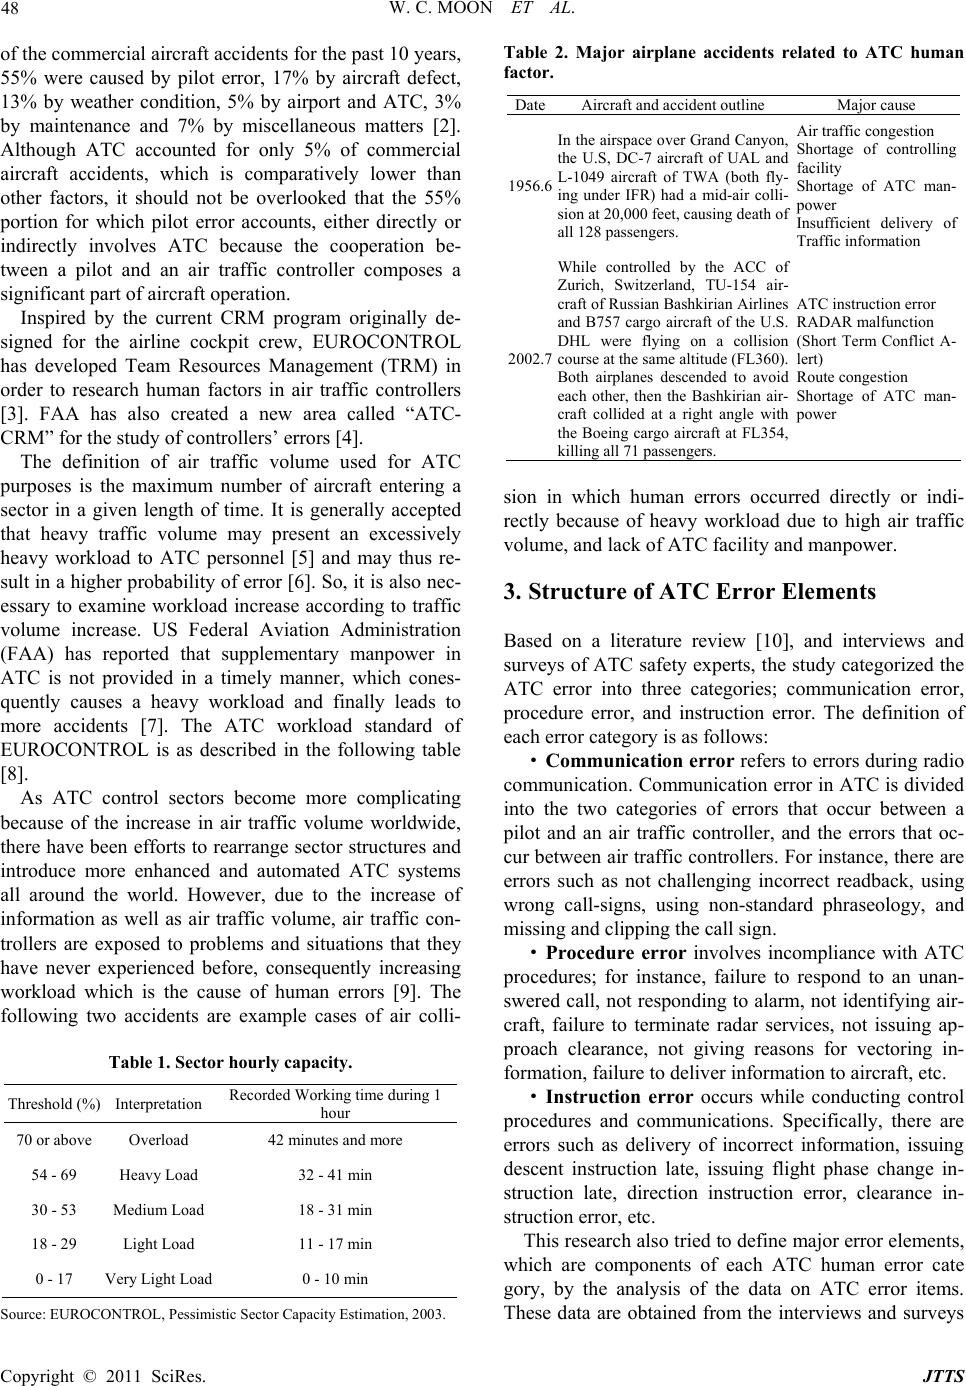
following two accidents are example cases of air colli-
Table 1. Sector hourly capac ity.
Threshold (%) Interpretation Recorded Working time during 1
hour
70 or above Overload 42 minutes and more
54 - 69 Heavy Load 32 - 41 min
30 - 53 Medium Load 18 - 31 min
18 - 29 Light Load 11 - 17 min
0 - 17 Very Light Load 0 - 10 min
Source: EUROCONTROL, Pessimistic Sector Capacity Estimation, 2003.
Table 2. Major airplane accidents related to ATC human
factor.
DateAircraft and accident outline Major cause
1956.6
In the airspace over Grand Canyon,
the U.S, DC-7 aircraft of UAL and
L-1049 aircraft of TWA (both fly-
ing under IFR) had a mid-air colli-
sion at 20,000 feet, causing death of
all 128 passengers.
Air traffic congestion
Shortage of controlling
facility
Shortage of ATC man-
power
Insufficient delivery of
Traffic information
2002.7
While controlled by the ACC of
Zurich, Switzerland, TU-154 air-
craft of Russian Bashkirian Airlines
and B757 cargo aircraft of the U.S.
DHL were flying on a collision
course at the same altitude (FL360).
Both airplanes descended to avoid
each other, then the Bashkirian air-
craft collided at a right angle with
the Boeing cargo aircraft at FL354,
killing all 71 passengers.
ATC instruction error
RADAR malfunction
(Short Term Conflict A-
lert)
Route congestion
Shortage of ATC man-
power
sion in which human errors occurred directly or indi-
rectly because of heavy workload due to high air traffic
volume, and lack of ATC facility and manpower.
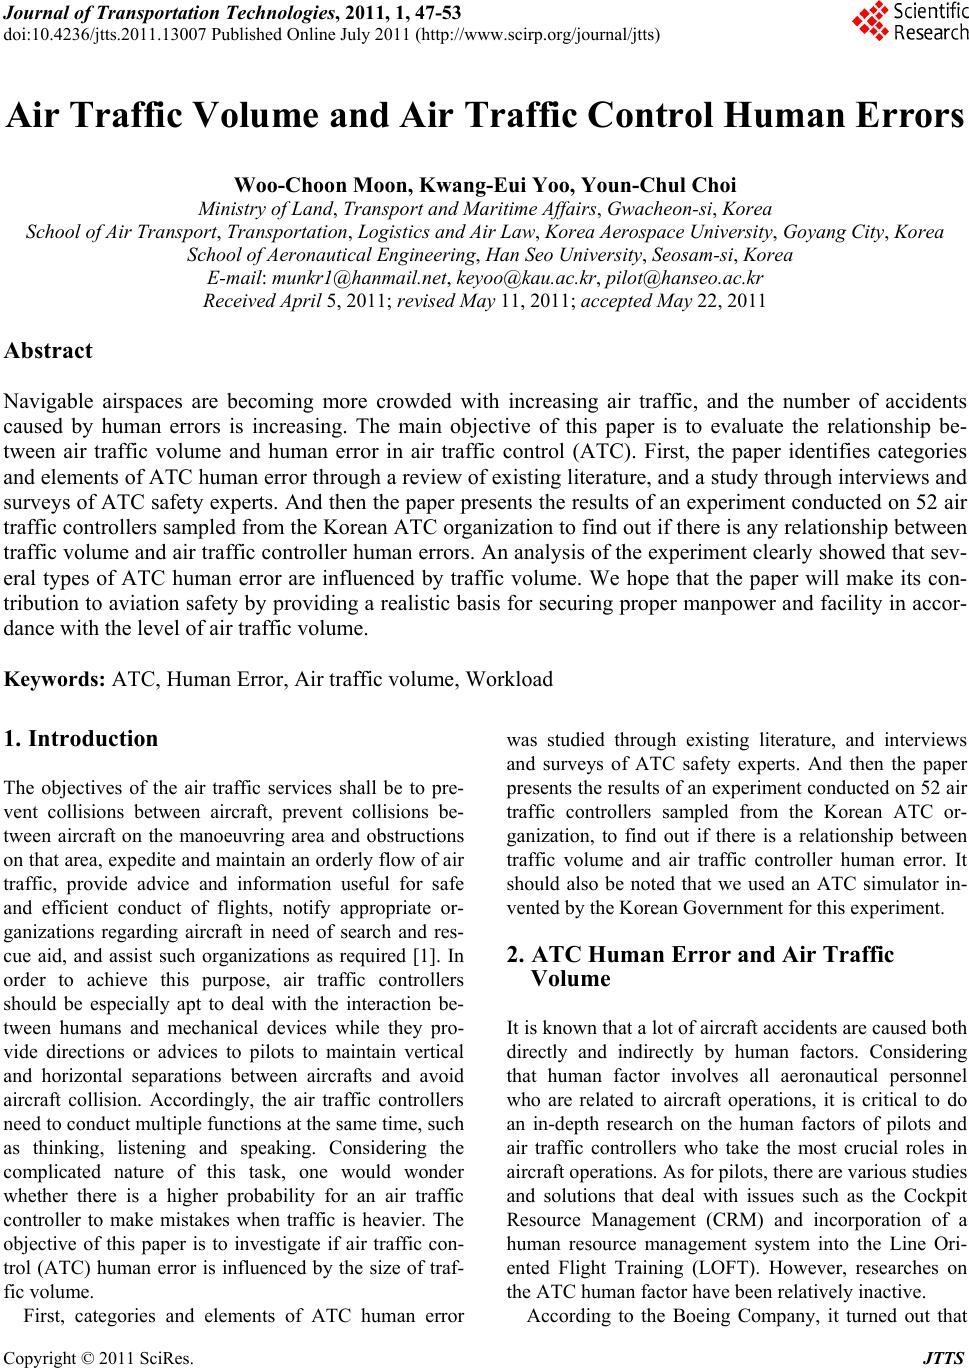
3. Structure of ATC Error Elements
Based on a literature review [10], and interviews and
surveys of ATC safety experts, the study categorized the
ATC error into three categories; communication error,
procedure error, and instruction error. The definition of
each error category is as follows:
· Comm unicatio n error refers to errors during radio
communication. Communication error in ATC is divided
into the two categories of errors that occur between a
pilot and an air traffic controller, and the errors that oc-
cur between air traffic controllers. For instance, there are
errors such as not challenging incorrect readback, using
wrong call-signs, using non-standard phraseology, and
missing and clipping the call sign.
· Procedure error involves incompliance with ATC
procedures; for instance, failure to respond to an unan-
swered call, not responding to alarm, not identifying air-
craft, failure to terminate radar services, not issuing ap-
proach clearance, not giving reasons for vectoring in-
formation, failure to deliver information to aircraft, etc.
· Instruction error occurs while conducting control
procedures and communications. Specifically, there are
errors such as delivery of incorrect information, issuing
descent instruction late, issuing flight phase change in-
struction late, direction instruction error, clearance in-
struction error, etc.
This research also tried to define major error elements,
which are components of each ATC human error cate
gory, by the analysis of the data on ATC error items.
These data are obtained from the interviews and surveys
Copyright © 2011 SciRes. JTTS
W. C. MOON ET AL.
49
Table 3. Structure of ATC human error elements.
Category Explanation Elements Operational definition
C1 Incorrect Readback Not
challenged
C2 Wrong callsign Used
C3 Non-standard
Phraseology
C4 Missed call
C5 Callsign
Omission/Truncation
Communica-
tion error
Difficulties in
communicative
interaction or
aeronautical
operations
C6 Clipped call
P1 Failure to respond to
unanswered call
P2 No/late response to
alarm
P3 No level verification
P4 No Identification of
aircraft
P5 Radar service not ter-
minated
P6 Late/No Issuance of
landing clearance
Procedure
error
Errors such as
difficulties in
following
checklists
P7 Reasons for Vectoring
not Given
I1 Incorrect information
passed to aircraft
I2 Late descent
I3 Late change
I4 Altitude Instruction
Error
I5 Heading Instruction
Error
Instruction
error
Errors such as
giving incorrect
instructions
I6 Clearance Instruction
Error
of profoundly experienced ATC practitioners who par-
ticipated to provide their opinions on ATC human error
elements. Finally, we constructed a structure of error
elements as shown in the following table.
4. Empirical Analysis on Level of Influence
on ATC Human Errors according to Air
Traffic Volume
4.1. Preparation for Experiment
This study conducted experiments on ATC duty per-
formance and human error during duty with sampled air
traffic controllers utilizing simulated approach control
lab. The ATC task is generally divided into 4 major parts:
area control, approach control, aerodrome control and
ramp control. According to the Korean Government’s
data (2008), there are about 300 air traffic controllers
who perform this duty. The sample group for this re-
Table 4. Demographic distr i bution of sample gr oup.
Category Category Number of sample Percentage (%)
male 46 88.5
Gender female 6 11.5
In 20s 15 28.8
In 30s 34 65.4
Age
In 40s 3 5.8
ATC 33 36.5
Duty Non-ATC 19 63.5
5 years or less 12 23.1
6 - 10 years 22 42.3
11 - 20 years 16 30.8
Work
experience
21 years and more2 3.8
search was air traffic controllers who are currently or
were previously in charge of ATC aerodrome control and
approach control at international airports in Korea. The
characteristics of this 52 sample group are as described
in the following table.
The ATC simulation equipment utilized for this re-
search is a kind of training device for air traffic control-
lers, developed by the Ministry of Land Transportation
and Maritime (MLTM) of Korea in 2007. This device
can simulate various flight situations that may occur
during air traffic control duty. It has basic functions that
give various control instructions related to flight maneu-
ver such as climb, cruise, descent, and speed control of
an airplane. It enables trainees to experience situations
close to ones that occur during the actual duty of ATC by
simulating situations and conditions such as the approach
course diagram, initial take-off direction, instrument
landing approach path, various weather conditions, etc.
4.2. Conducting the Experiment
In order to carry out the experiment, the above men-
tioned ATC simulator was installed and the training pro-
gram was adjusted so that it could produce the data ap-
propriate for the purpose of this research. There were 3
computers, 4 monitors, 5 radio communication devices
and 2 speakers provided for the participant group con-
sisting of 1 air traffic controller and 3 pilots. The seats
for the pilots and controller is separated by more than 5
meters with a partition, so that verbal communication
between the air traffic controller and pilot can be con-
ducted in a situation similar to that of the actual radio
communication between pilots and the controller.
The spatial background of the experimental scenario is
the terminal management areas of two large international
airports in Korea, Jeju International Airport and Gimhae
International Airport. We conducted the experiment twice
spending four months in total. The first period of ex-
periment was from January 15, 2009 to March 15, 2009,
Copyright © 2011 SciRes. JTTS
50 W. C. MOON ET AL.
Table 5. Definition of traffic volume level.
Level of Traffic Volume Number of Aircraft Con-
trolled during 15 minutes
V1 10
V2 20
Experiment 1
V3 30
L1 2.5
L2 5
L3 7.5
L4 10
L5 12.5
L6 15
L7 17.5
L8 20
L9 22.5
L10 25
L11 27.5
Experiment 2
L12 30
and the second one was from July 1, 2009 to August 31,
2009. Each sampled air traffic controller was asked to
perform air traffic control duty for 15 minutes with var-
ied levels of air traffic volume. They were required to try
out transfer of control, issuance of traffic information,
and aircraft separation. In the first period there were
three levels of traffic volume, designated as V1, V2 and
V3. The second period experimented with twelve levels
of traffic volume, designated as L1, L2, L3, L4, L5, L6,
L7, L8, L9, L10, L11 and L12 (refer to Table 5). This
volume spectrum is defined to accommodate the entire
range of possible situations, from a very low level to an
extremely high level of traffic volume. As one can see at
Table 5, the level of traffic volume is defined by the
number of aircraft controlled by each sampled controller
during the 15 minute experimental session. The number
of errors made by each sampled controller was counted
utilizing the records of ATC duty during his/her experi-
mental session.
4.3. Analyses
This study established four hypotheses, in order to dis-
cuss the relationship between air traffic volume and fre-
quency of error occurrence:
Hypothesis 1: Overall ATC Error will increase as air
traffic volume increases.
Hypothesis 2: Communication error will increase as
air traffic volume increases.
Hypothesis 3: Procedure error will increase as air traf-
fic volume increases.
Hypothesis 4: Instruction error will increase as air traf-
fic volume increases
4.3.1. Test of Hypothesis 1
The error data obtained in the second period of the ex-
periment was used to test hypothesis 1. The level of in-
Table 6. Frequency of error by the level of air traffic vol-
ume.
Level of Air
traffic volume
Average Fre-
quency of error
Level of Air
traffic volume
Frequency
of error
L1 1.370 L7 3.370
L2 1.550 L8 3.553
L3 1.962 L9 3.970
L4 2.350 L10 4.904
L5 2.765 L11 5.701
L6 3.178 L12 6.304
Figure 1. Regression r esult; frequency of error and level air
traffic volume.
fluence that traffic volume has on frequency of error oc-
currence is presented in Table 6. First, we performed a
correlation analysis to see the level of correlation be-
tween the two variables, traffic volume and frequency of
ATC human errors. The result showed that 0.984 (p <
0.01) was the correlation coefficient. So, it can be said
that there is very strong relationship between the level of
air traffic volume and the error frequency of the air traf-
fic controller. And we also performed a simple regres-
sion analysis utilizing traffic volume as the independent
variable “x”, and frequency of error as the dependent
variable, “y”. The result of the regression analysis was “y
= 0.0516 x + 0.1886” with an R2 value of 0.9675, which
also indicates high significance.
Although the overall equation shows a linear regres-
sion curve, there are some areas where one can detect un-
proportionally higher marginal increase in frequency of
error. As you can see in Figure 1, the marginal increase
in error frequency from the volume level 22.5 to 27.5 is
higher than in other areas.
Table 7 shows the marginal increase in error fre-
quency at each level of traffic volume. The value in the
third column and sixth column of Table 7 is calculated
utilizing the following equations;
∆у = уi+1уi
уi+1 = frequency of error at xi+1 traffic volume
уi = frequency of error xi traffic volume
where, xi = traffic volume (number of aircraft controlled
per unit time),
yi = frequency of error occurrence
Referring to Table 7, it can be said that the marginal
Copyright © 2011 SciRes. JTTS
W. C. MOON ET AL.
Copyright © 2011 SciRes. JTTS
51
Table 7. Marginal increase in frequency of error by air traffic volume.
Traffic volume (xi)
Frequency of error
(yi)
marginal increase in
frequency (∆у) Traffic volume (xi) Frequency of error (yi) marginal increase in
frequency (∆у)
2.5 a/c 1.370 0 17.5 3.370 0.200
5 1.550 0.180 20 3.553 0.183
7.5 1.962 0.412 22.5 3.970 0.427
10 2.350 0.388 25 4.904 0.934
12.5 2.765 0.215 27.5 5.701 0.797
15 3.178 0.418 30 6.304 0.603
Table 8. Error frequency by the level of air traffic volume.
Air traffic
volume (V*)
Error
Type
Minimum
frequency
Maximum
frequency
Average
frequency
Standard
deviation
V1 0 4 1.75 1.26
V2 1 5 2.73 1.19
V3
Commu-
nication
error 0 6 3.28 1.97
V1 0 5 1.51 1.05
V2 1 8 3.23 1.72
V3
Proce-
dure
error 1 10 5.00 2.24
V1 0 2 0.42 0.72
V2 0 5 1.59 1.53
V3
Instruc-
tion
error 0 6 2.34 1.78
Table 9. Frequency of each element of communication error
by level of air traffic volume.
Communication error (C)
Level of Air Traffic VolumeC1 C2 C3 C4 C5 C6
V1 0.08 0.08 0.33 0.35 0.27 0.65
V2 0.23 0.15 0.35 0.54 0.52 0.94
V3 0.35 0.15 0.44 0.42 0.58 1.35
Figure 3. Frequency of communication error by air traffic
volume.
Table 10. Frequency of each element of procedure error by
level of air traffic volume.
Procedure error (P)
Level of Air Traffic Volume
P1 P2 P3 P4 P5 P6 P7 P8
V1 0.00 0.13 0.00 0.22 0.13 0.09 0.17 0.78
V2 0.91 0.91 0.04 0.43 0.00 0.17 0.17 1.39
V3 1.22 1.22 0.09 0.65 0.39 0.35 0.39 1.78
Figure 2. Air traffic volume and frequency of error.
error frequency of each category was significantly af-
fected by the level of traffic volume. It was confirmed
that all three hypotheses were accepted with the signifi-
cance level of 0.05. This means that the error frequency
of each category of ATC human error is influenced by
air traffic volume in a statistically significant manner.
increase in error frequency is highest at the level of traf-
fic volume between 22.5 to 25.
4.3.2. Test of Hypotheses 2, 3 and 4
Hypotheses 2, 3, and 4 were tested with the data obtained
in the first period of the experiment. Those hypotheses
focus on error frequency variation of each error category,
such as communication error, procedure error and in-
struction error, depending on the level of traffic volume.
Table 8 and Figure 2 shows the distribution of average
error frequency for each category of ATC human error.
Each of the hypotheses was tested separately through
ANOVA (Analysis of Variance) to see if the average
error frequency of each category was significantly af-
fected by the level of traffic volume. It was confirmed
Table 9 is the distribution of error frequency for each
element in the communication error category. Figure 3
presents this information as a diagram. Table 10 is the
distribution of error frequency for each element in the
procedure error category. Figure 4 shows this in the
form of a diagram. Table 11 is the distribution of error
frequency for each of the 6 elements in the instruction
error category. Figure 5 shows this information in the
form of a diagram.
52 W. C. MOON ET AL.
Figure 4. Frequency of procedure error by air traffic vol-
ume.
Table 11. Frequency of each element of instruction error by
level of air traffic volume.
Instruction error (I)
Level of Air Traffic Volume
I1 I2 I3 I4 I5I6
V1 0.04 0.09 0.04 0.09 0.04 0.00
V2 0.13 0.35 0.48 0.26 0.09 0.04
V3 0.09 0.48 0.96 0.26 0.22 0.13
Figure 5. Frequency of instruction error by air traffic vol-
ume.
5. Conclusions
Despite the utilization of high-tech equipment, ATC is
still mostly dependent on individual decision-making
[11], which is always subject to probability of occur-
rences of human error. The main purpose of this research
was to test a few hypotheses that claimed that the fre-
quency of ATC human error will be influenced by the
level of air traffic volume. The required data were gath-
ered through experiments that utilized a sample of air
traffic controllers who are currently working for the Ko-
rean ATC organization, and the ATC simulator.
We found there are significant relationships between
ATC human error and the level of traffic volume. As the
air traffic volume increases, the frequencies of error oc-
currence for most ATC human error elements defined by
this study, were verified to increase. Especially, the in-
crease of procedure errors was remarkably high com-
pared to other error categories. The marginal increase in
frequency of error from traffic volume 22.5 to 25 (num-
ber of aircraft) was revealed to be the highest. Therefore,
it may be efficient to limit traffic volume to less than 22
aircraft per 15 minutes. However, it is necessary to con-
sider differences that originate from factors such as air
traffic control system of each air traffic control facility,
sector conditions and flight procedures when determin-
ing the appropriate traffic volume.
It would be effective to assess the determined traffic
volume on a regular basis, and to take corrective meas-
ures such as supplementing manpower, increasing con-
trolling seats and enhancing air traffic control systems in
case determined traffic volume is exceeded. We hope
that the paper will make its contribution to aviation
safety by providing a realistic basis for securing the
proper amount of manpower and facility in accordance
with the level of air traffic volume.
6. References
[1] International Civil Aviation Organization, “Air Traffic
Services”, Annex 11 to International Convention on Civil
Aviation, 13th Edition, Montreal, 2001.
[2] Boeing Company, “Statistical Summary of Commercial
Jet Airplane Accidents Worldwide Operation”, Chicago,
2006.
[3] EUROCONTROL, “Guidelines for Developing and Im-
plementing Team Resource Management”, Brussels, 1996.
[4] Federal Aviation Administration, “The Effects of Perfor-
mance Feedback on Air Traffic Control Team Coordina-
tion: A Simulation Study”, Washington D.C. 2000.
[5] S. Malakis, T. Kontogiannis and B. Kirwan, “Managing
Emergencies and Abnormal Situations in Air Traffic
Control (part I): Task Work Strategies”, Applied Ergo-
nomics, Vol. 41, No. 4, 2010, pp. 620-627.
doi:10.1016/j.apergo.2009.12.019
[6] M. D. Rodgers, Richard H. Mogford and Leslye S. Mog-
ford, “The Relationship of Sector Characteristics to Op-
erational Errors”, Federal Aviation Administration Civil
Aeromedical Institute, Oklahoma City, 1998.
[7] Federal Aviation Administration, “FAA Strategies for
Reducing Operational Error Causal Factors”, Washington
D.C., 2004.
[8] EUROCONTROL, “Pessimistic Sector Capacity Estima-
tion”, Brussels, 2003.
[9] J. Ponds and A. Isaac, “Development of an FAA-EURO-
CONTROL Technical for the Analysis of Human Error in
ATM (DOT/FAA/AM-02/12)”, EUROCONTROL, Brus-
Copyright © 2011 SciRes. JTTS
W. C. MOON ET AL.
Copyright © 2011 SciRes. JTTS
53
sels, 2002.
[10] International Civil Aviation Organization, “Normal Op-
eration Safety Survey (NOSS)”, Doc 9910, ICAO, Mont-
real, 2008.
[11] Christopher D. Wickens, Anne S. Mavor, James McGee,
“Flight to the Future: Human Factors in Air Traffic Con-
trol”, National Academy Press, Washington D.C., 1997.