Paper Menu >>
Journal Menu >>
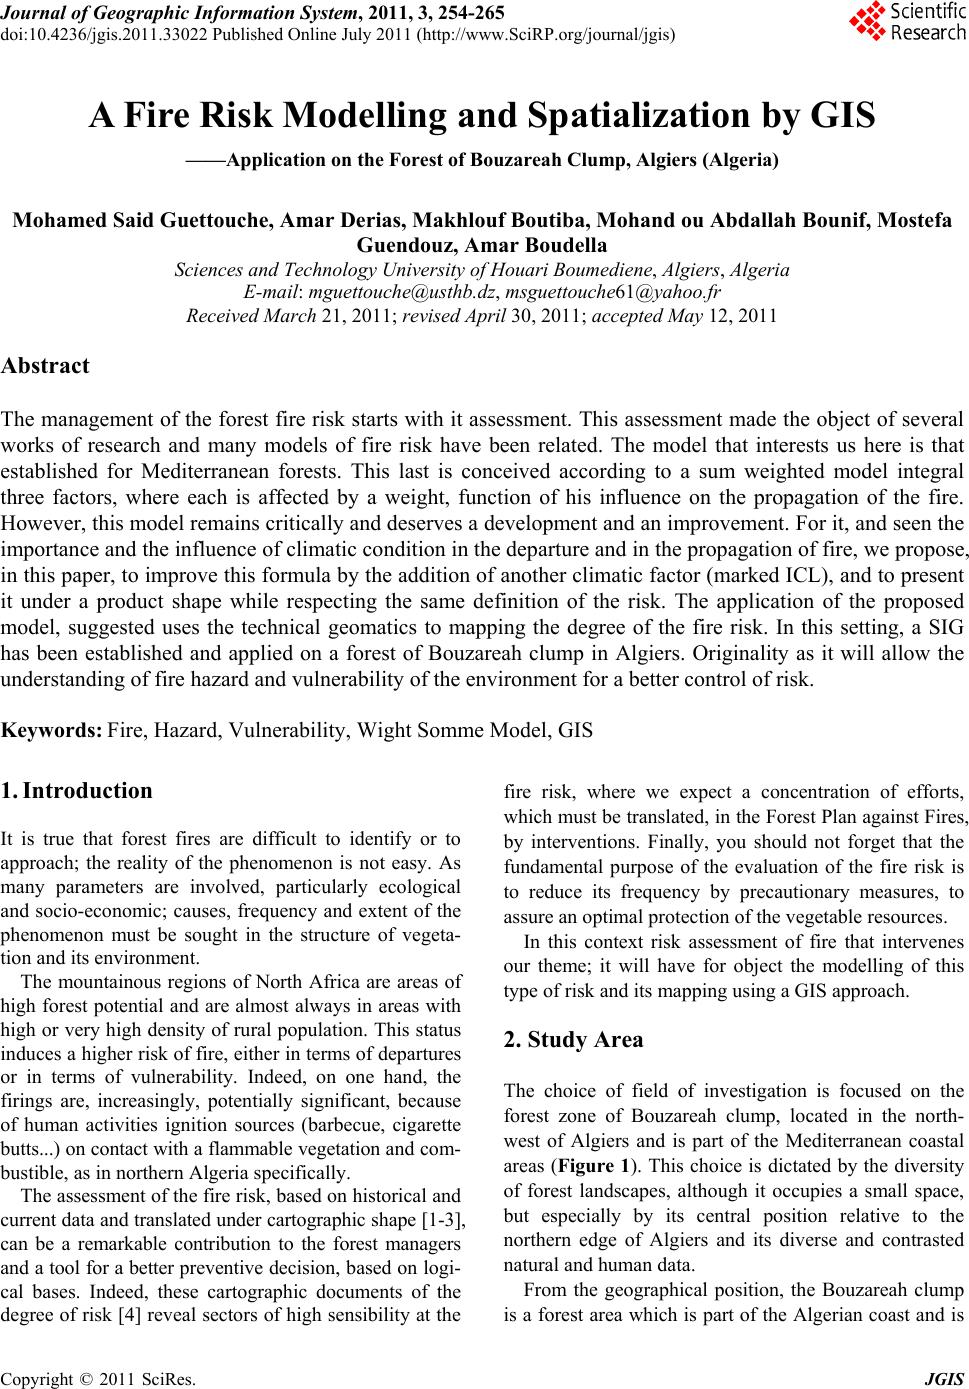 Journal of Geographic Information System, 2011, 3, 254-265 doi:10.4236/jgis.2011.33022 Published Online July 2011 (http://www.SciRP.org/journal/jgis) Copyright © 2011 SciRes. JGIS A Fire Risk Modelling and Spatialization by GIS ——Application on the Forest of Bouz ar eah Clump, Algiers (Alge ria) Mohamed Said Guettouche, Amar Derias, Makhlouf Boutiba, Mohand ou Abdallah Bounif, Mostefa Guendouz, Amar Boudella Sciences and Technology University of Houari Boumediene, Algiers, Algeria E-mail: mguettouche@usthb.dz, msguettouche61@yahoo.fr Received March 21, 2011; revised April 30, 2011; accepted May 12, 2011 Abstract The management of the forest fire risk starts with it assessment. This assessment made the object of several works of research and many models of fire risk have been related. The model that interests us here is that established for Mediterranean forests. This last is conceived according to a sum weighted model integral three factors, where each is affected by a weight, function of his influence on the propagation of the fire. However, this model remains critically and deserves a development and an improvement. For it, and seen the importance and the influence of climatic condition in the departure and in the propagation of fire, we propose, in this paper, to improve this formula by the addition of another climatic factor (marked ICL), and to present it under a product shape while respecting the same definition of the risk. The application of the proposed model, suggested uses the technical geomatics to mapping the degree of the fire risk. In this setting, a SIG has been established and applied on a forest of Bouzareah clump in Algiers. Originality as it will allow the understanding of fire hazard and vulnerability of the environment for a better control of risk. Keywords: Fire, Hazard, Vulnerability, Wight Somme Model, GIS 1. Introduction It is true that forest fires are difficult to identify or to approach; the reality of the phenomenon is not easy. As many parameters are involved, particularly ecological and socio-economic; causes, frequency and extent of the phenomenon must be sought in the structure of vegeta- tion and its environment. The mountainous regions of North Africa are areas of high forest potential and are almost always in areas with high or very high density of rural population. This status induces a higher risk of fire, either in terms of departures or in terms of vulnerability. Indeed, on one hand, the firings are, increasingly, potentially significant, because of human activities ignition sources (barbecue, cigarette butts...) on contact with a flammable vegetation and com- bustible, as in northern Algeria specifically. The assessment of the fire risk, based on historical and current data and translated under cartographic shape [1-3], can be a remarkable contribution to the forest managers and a tool for a better preventive decision, based on logi- cal bases. Indeed, these cartographic documents of the degree of risk [4] reveal sectors of high sensibility at the fire risk, where we expect a concentration of efforts, which must be translated, in the Forest Plan against Fires, by interventions. Finally, you should not forget that the fundamental purpose of the evaluation of the fire risk is to reduce its frequency by precautionary measures, to assure an optimal protection of the vegetable resources. In this context risk assessment of fire that intervenes our theme; it will have for object the modelling of this type of risk and its mapping using a GIS approach. 2. Study Area The choice of field of investigation is focused on the forest zone of Bouzareah clump, located in the north- west of Algiers and is part of the Mediterranean coastal areas (Figure 1). This choice is dictated by the diversity of forest landscapes, although it occupies a small space, but especially by its central position relative to the northern edge of Algiers and its diverse and contrasted natural and human data. From the geographical position, the Bouzareah clump is a forest area which is part of the Algerian coast and is  M. S. GUETTOUCHE ET AL. Copyright © 2011 SciRes. JGIS 255 Figure 1. Location of the study area. bordered in north by the Mediterranean Sea and in south by the Mitidja plain. 3. Methodology The risk assessment of forest fires has been the subject of several research papers [1-14] and several indices of fire risk have been established. The index that has interested us in this work is designed, by Dagorne [14] for Medi- terranean forests. This choice can be justified by two reasons: the first is that Algeria is one of those areas; the second is the ability to have field data, to establish and confirm our model. The index is given by the following formula: 52 3 I RICIMIH (1) where: IR: Risk index; IC: the index of combustibility; IM: the Topomorphological index; IH: the land us index. Based on the principle of the weighted sum, this index is designed as a model assigning each parameter a weighting coefficient based on its influence on the spread of the fire. However, at observation, it appears that the formula (1) occult, firstly, the principle of risk that is based on the product of hazard and vulnerability ([15], ISO/IEC 73, etc.) and, secondly, lack of parameters determining the fire, namely climatic parameters. For this and given the importance and the degree of influence of climatic conditions in the beginning and in the spread of fires, we propose in this work to improve this model by making changes: First it seemed illogical to obscure the climate of the area, why in another climate index (noted: ICL) was added and the weight was rebal- anced. Then we introduced the global model in a form of product within the scientific definition of risk. 3.1. Fire Risk Modeling To evaluate the fire risk, it is necessary to model each ele- ment of risk. This step is to select specific settings for each component (combustible type, slope, etc.) and then using a representation model to assess risk. The parameters are the factors of the natural and an- thropogenic influence the outbreak, spread and fire in- tensity, and their conduct. These parameters are highly correlated and it is their combination that influence or cause a fire. Based on the definition of risk set by Bernoulli [15] the risk of forest fire can be approximated by the follow- ing expression: inc inc inc RAxV (2) where: Rinc: expresses the degree of fire risk; Ainc: ex- presses the degree of fire hazard; Vinc: expresses the de- gree of vulnerability = exposure of issues (human, equip- ment, etc.) to the fire. 3.1.1. Modeling Forest Fire Hazard For a forest fire starts and spreads, it is necessary that the basic parameters are involved: the fuel, the morphology of the environment, climate and man. Modeling of forest fire hazard therefore requires the modeling of these pa- rameters. 1) The Fuel Among the parameters reflecting the susceptibility of  M. S. GUETTOUCHE ET AL. Copyright © 2011 SciRes. JGIS 256 vegetation to fire is the type of fuel available, phytosize or phytomass. This is also an important factor in the spread of fires. To estimate the combustibility, we adopt the model developed at CEMAGREF ([10,11]) with the notations. It is of the form: 12 39 0.237.18ICBV EE (3) where: BV: biovolume fuel is obtained by multiplying the average height of the dominant strata and their re- covery percentages in tenths. Its value is between 0 and 50; E1 and E2: are notes heat intensity of the two domi- nant species (E1 to high woody and E2 average note of low woody and herbaceous). These scores vary from 1 to 9. The notes given by CEMAGREF in this index are as follows: Combustibility classes Note IC 40 0 40 ≤ IC 50 1 50 ≤ IC 60 2 60 ≤ IC 70 3 70 ≤ IC 4 2) The Topomorphology The slope has a considerable influence on the speed of spread of fire over the slope is large, the useful radiation to the spread of fire is important. Indeed, for a fire uphill, the buoyancy forces exerted vertically at an angle with the direction of fire spread, the more closed than the slope is steep, so we can observe the flow of hot gases from the fire towards the yet unburned vegetation. Three morphological parameters involved in the topomorphologic model: slope, exposure and elevation [12]. The combined effect of these three parameters is expressed by the following equation: 3 I Mpme (4) where: p is the slope (coded between 1 and 4); m: repre- sents the morphology of the area (coded of 1 to 4) and e: exposure (coded 0 to 3). The results of combining and weighting of various topomorphologic parameters are listed in Tables 1-4. 3) Climatic Conditions Several climatic parameters involved in the outbreak and spread of wildfires (wind, temperature, rainfall, etc.). Research bioclimatic indicators to characterize the sim- plest possible level of drought or aridity of a place or an environment has been, long time, a concern of scientists [16]. Several indices have been developed by combining Table 1. Grading of slop. GradeSlope ClassesSlope 1 P ≤ 15% Low slope with no impact on the spread 2 15 < P ≤ 30%Moderate slope causing a moderate acceleration of the fire front 3 30 < P ≤ 60%High slope, significant acceleration of the fire front 4 P > 60% Slope with very high risk of turbulence, jumping fire, conflagration Table 2. Grading of morphology. Grade Morphology Classes Morphologie 1 P ≤ 3% Plain (No fire jumps) 2 3 P ≤ 12.5% Lower piedmont (Less fire jumps) 3 12.5 P ≤ 25% High Piedmont (more fire jump) 4 P > 25% Steep (Jumps fire accentuated) Table 3. Grading of exposition. Grade Exposure 2 ENE - E - ESE 3 SSE - S - SSW 1 WSW - W - ONO 0 NNW - N - NNE Table 4. Grading of topomorphologic index. Topomorphologic Classes Grade IM ≤ 5 0 5 IM ≤ 10 1 10 IM ≤ 15 2 15 IM ≤ 20 3 IM > 20 4 data of precipitation (P) and evaporation. In our case, the effect of climatic conditions on forest fires can be seen by the combined effect of drought climate, continentality and dry winds. It can be calculated as well: CLs c v I III (5) where: Is: Climate Drought Index, Ic: index of continent- tality and Iv: index of dry wind. For the drought, most climate experts believe that the proportionality ratio between precipitation and tem- perature can imagine a drought index [17]. In this con- text, the index which characterizes at best the Mediter-  M. S. GUETTOUCHE ET AL. Copyright © 2011 SciRes. JGIS 257 ranean area is of the form [18]: 2 s P IT (6) For the continentality, index of Gams amended by Michalet [19] mainly concerns the contexts of moun- tain, it overcomes the effects of elevation to demon- strate the continentality. This index, denoted by cot(α) “Hydric continentality angle”, is calculated as: 900 100 10 cot A P P A (7) where: P = Total annual rainfall (mm) and A = elevation (m) Indeed, for the same elevation, internal areas of a clump get less rain than the external zones, they are also the sunniest and have daily and seasonal temperature changes significantly stronger, because the clouds are less numerous. Thus, the angle α increases and tends towards 90˚ when rainfall decreases relatively to eleva- tion. For the wind, the effect of wind speed can be seen by the following index: r v s H IV (8) where: Hr = Relative humidity in% and Vs = Standard- ized wind speed. The results of combining and weighting different cli- mate parameters are listed in Tables 5-7. The combina- tion of the three climatic criteria, gives the classes and the gradings shown in Table 8. 4) The Human Factor The jets of cigarette butts or barbecues badly off, are, so alone, a very important source of fire starts, especially for cigarette butts at roadside. It is not possible to model human behavior (neglect, pyromania, etc.), the statistical approach developed in 2006 by J.G. Robin [7] shows a clear correlation be- tween number of outbreaks and near a road or dwellings. We adopt this model to evaluate the effect of human in- fluence on forest fire hazard. It is of the form: 0.0096 80.928 d IH e (9) where: IH: Index of human impact, evidenced by the number of starting fires, and d: distance to road (Max: 300 m). To evaluate its effect on fire hazard, we propose the grading presented in Table 9. For the forest fire hazard, it is defined as the sum of weighted parameters that determine it. It is calculated by the following expression: Table 5. Grading of drought index. GradeDrought Classes Criteria 0 Is 1 Wetland (no drought) 1 0.75 < Is ≤ 1 Very weakly pronounced drought 2 0.5 Is ≤ 0.75 Moderately pronounced drought 3 0.25 Is ≤ 0.5 Drought strongly pronounced 4 Is ≤ 0.25 Severe drought Table 6. Grading of effect of the continentality. Grade Continentality Classes Criteria 0 ≤ 40˚ Heavily sprayed 1 40˚ α ≤ 50˚ Low continentality 2 50° α ≤ 60˚ Moderate Continentality 3 60˚ α ≤ 70˚ Strong continentality 4 α > 70˚ Continentality harsh, Sunshine Table 7. Grading of effect of wind index. GradeWind Classes Criteria 0 Iw 1 No effect on the spread of fire 1 0.75 ≤ Iw < 1 Small effect on the spread of fire 2 0.5 ≤ Iw 0.75 Moderate effect on the spread 3 0.25 ≤ Iw 0.5 Strong effect on the spread 4 Iw ≤ 0.25 Very Strong effect on the spread Table 8. Grading of effect of climatic index. GradeClasses of climate index Criteria 0 ICL ≤ 0 No effects of climate 1 0 < ICL ≤ 3 Low effect of climate 2 3 < ICL ≤ 6 Moderate effect of climate 3 6 < ICL ≤ 9 Strong effect of climate 4 ICL > 9 Very Strong effect 32 4 10 CL inc I CIMIIH A (10) For weighting, we estimate that the share of the com- bustibility and climatic parameters is more important than topomorphology because they influence the emer- gence and spread of fires. The effect of man is casual and can be managed. The combination of different criteria for determining the hazard, gives the notation presented in Table 10. 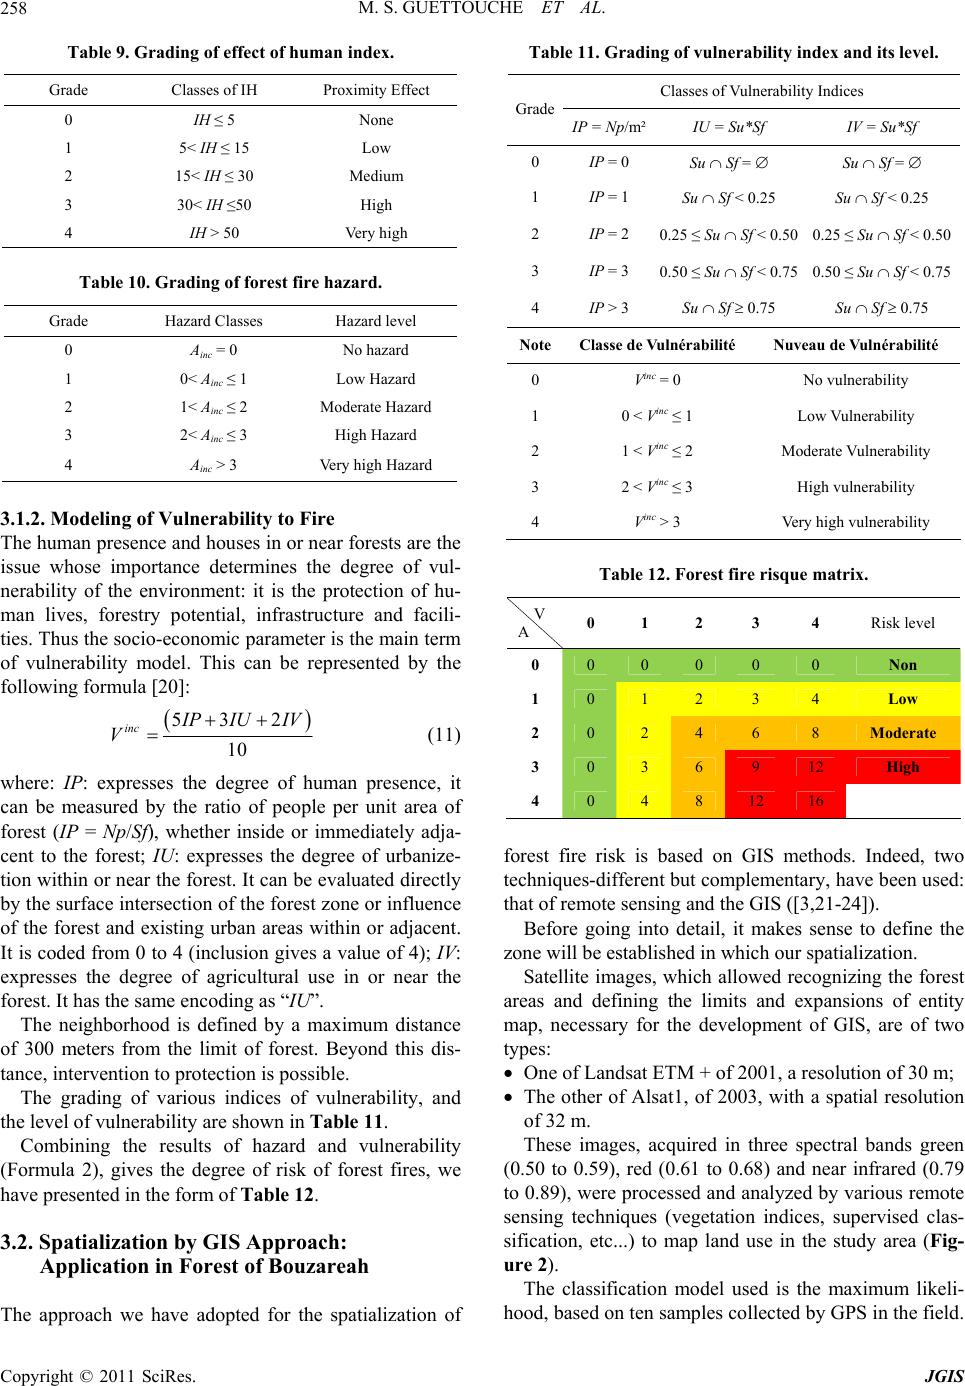 M. S. GUETTOUCHE ET AL. Copyright © 2011 SciRes. JGIS 258 Table 9. Grading of effect of human index. Grade Classes of IH Proximity Effect 0 IH ≤ 5 None 1 5< IH ≤ 15 Low 2 15< IH ≤ 30 Medium 3 30< IH ≤50 High 4 IH > 50 Very high Table 10. Grading of forest fire hazard. Grade Hazard Classes Hazard level 0 Ainc = 0 No hazard 1 0< Ainc ≤ 1 Low Hazard 2 1< Ainc ≤ 2 Moderate Hazard 3 2< Ainc ≤ 3 High Hazard 4 Ainc > 3 Very high Hazard 3.1.2. Modeling of Vulnerability to Fire The human presence and houses in or near forests are the issue whose importance determines the degree of vul- nerability of the environment: it is the protection of hu- man lives, forestry potential, infrastructure and facili- ties. Thus the socio-economic parameter is the main term of vulnerability model. This can be represented by the following formula [20]: 53 2 10 inc I PIU IV V (11) where: IP: expresses the degree of human presence, it can be measured by the ratio of people per unit area of forest (IP = Np/Sf), whether inside or immediately adja- cent to the forest; IU: expresses the degree of urbanize- tion within or near the forest. It can be evaluated directly by the surface intersection of the forest zone or influence of the forest and existing urban areas within or adjacent. It is coded from 0 to 4 (inclusion gives a value of 4); IV: expresses the degree of agricultural use in or near the forest. It has the same encoding as “IU”. The neighborhood is defined by a maximum distance of 300 meters from the limit of forest. Beyond this dis- tance, intervention to protection is possible. The grading of various indices of vulnerability, and the level of vulnerability are shown in Table 11. Combining the results of hazard and vulnerability (Formula 2), gives the degree of risk of forest fires, we have presented in the form of Table 12. 3.2. Spatialization by GIS Approach: Application in Forest of Bouzareah The approach we have adopted for the spatialization of Table 11. Grading of vulnerability index and its level. Classes of Vulnerability Indices Grade IP = Np/m² IU = Su*Sf IV = Su*Sf 0 IP = 0 Su Sf = Su Sf = 1 IP = 1 Su Sf < 0.25 Su Sf < 0.25 2 IP = 2 0.25 ≤ Su Sf < 0.50 0.25 ≤ Su Sf < 0.50 3 IP = 3 0.50 ≤ Su Sf < 0.75 0.50 ≤ Su Sf < 0.75 4 IP > 3 Su Sf 0.75 Su Sf 0.75 NoteClasse de Vulnérabilité Nuveau de Vulnérabilité 0 Vinc = 0 No vulnerability 1 0 < Vinc ≤ 1 Low Vulnerability 2 1 < Vinc ≤ 2 Moderate Vulnerability 3 2 < Vinc ≤ 3 High vulnerability 4 Vinc > 3 Very high vulnerability Table 12. Forest fire risque matrix. V A 0 1 2 3 4 Risk level 0 0 0 0 0 0 Non 1 0 1 2 3 4 Low 2 0 2 4 6 8 Moderate 3 0 3 6 9 12 High 4 0 4 8 12 16 forest fire risk is based on GIS methods. Indeed, two techniques-different but complementary, have been used: that of remote sensing and the GIS ([3,21-24]). Before going into detail, it makes sense to define the zone will be established in which our spatialization. Satellite images, which allowed recognizing the forest areas and defining the limits and expansions of entity map, necessary for the development of GIS, are of two types: One of Landsat ETM + of 2001, a resolution of 30 m; The other of Alsat1, of 2003, with a spatial resolution of 32 m. These images, acquired in three spectral bands green (0.50 to 0.59), red (0.61 to 0.68) and near infrared (0.79 to 0.89), were processed and analyzed by various remote sensing techniques (vegetation indices, supervised clas- sification, etc...) to map land use in the study area (Fig- ure 2). The classification model used is the maximum likeli- hood, based on ten samples collected by GPS in the field. 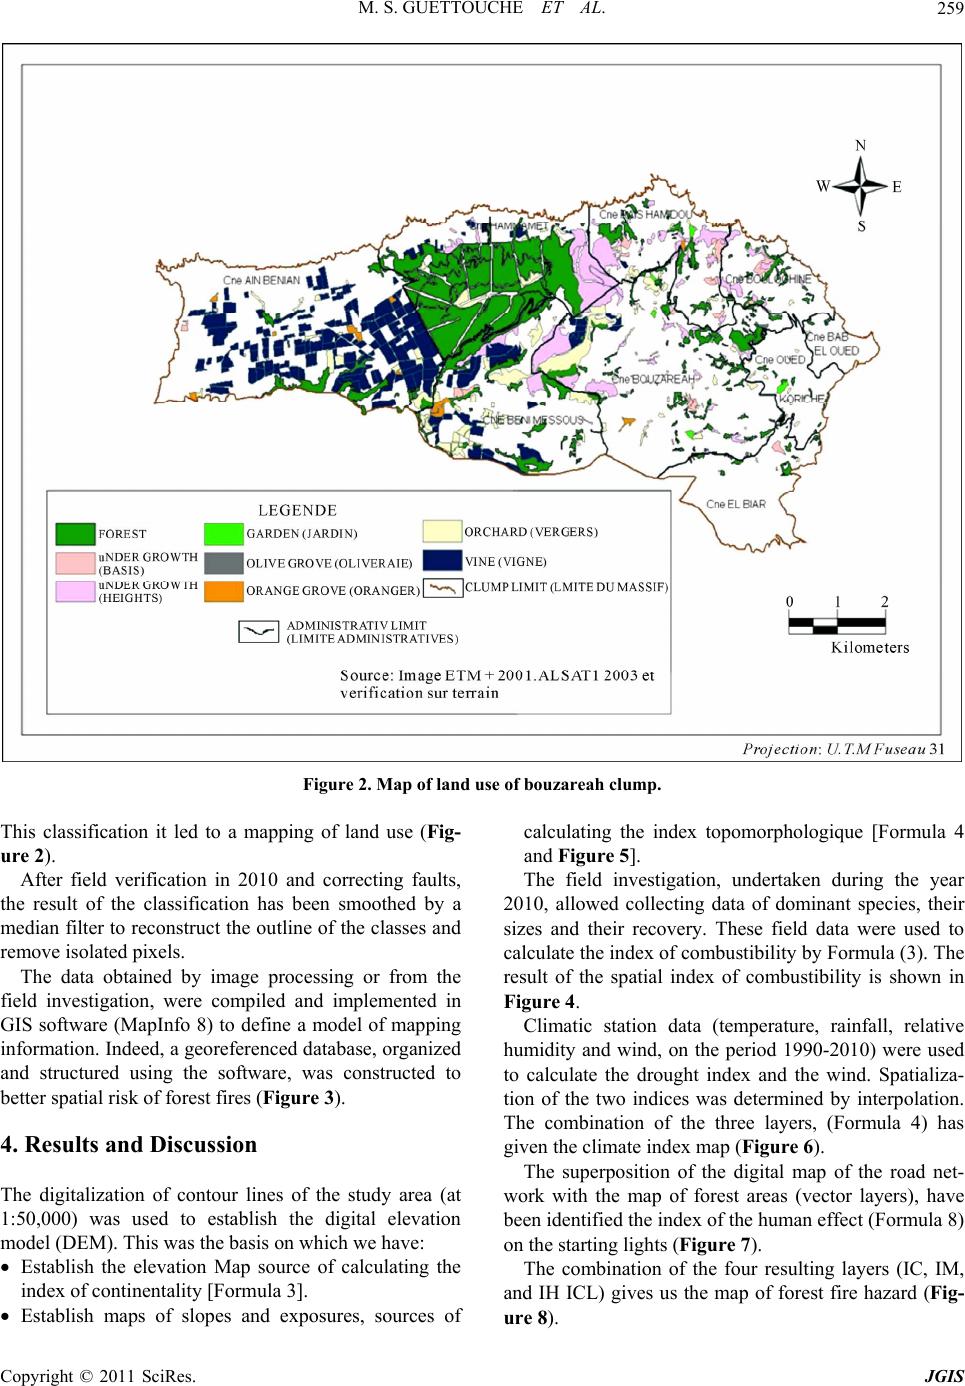 M. S. GUETTOUCHE ET AL. Copyright © 2011 SciRes. JGIS 259 Figure 2. Map of land use of bouzareah clump. This classification it led to a mapping of land use (Fig- ure 2). After field verification in 2010 and correcting faults, the result of the classification has been smoothed by a median filter to reconstruct the outline of the classes and remove isolated pixels. The data obtained by image processing or from the field investigation, were compiled and implemented in GIS software (MapInfo 8) to define a model of mapping information. Indeed, a georeferenced database, organized and structured using the software, was constructed to better spatial risk of forest fires (Figure 3). 4. Results and Discussion The digitalization of contour lines of the study area (at 1:50,000) was used to establish the digital elevation model (DEM). This was the basis on which we have: Establish the elevation Map source of calculating the index of continentality [Formula 3]. Establish maps of slopes and exposures, sources of calculating the index topomorphologique [Formula 4 and Figure 5]. The field investigation, undertaken during the year 2010, allowed collecting data of dominant species, their sizes and their recovery. These field data were used to calculate the index of combustibility by Formula (3). The result of the spatial index of combustibility is shown in Figure 4. Climatic station data (temperature, rainfall, relative humidity and wind, on the period 1990-2010) were used to calculate the drought index and the wind. Spatializa- tion of the two indices was determined by interpolation. The combination of the three layers, (Formula 4) has given the climate index map (Figure 6). The superposition of the digital map of the road net- work with the map of forest areas (vector layers), have been identified the index of the human effect (Formula 8) on the starting lights (Figure 7). The combination of the four resulting layers (IC, IM, and IH ICL) gives us the map of forest fire hazard (Fig- ure 8). 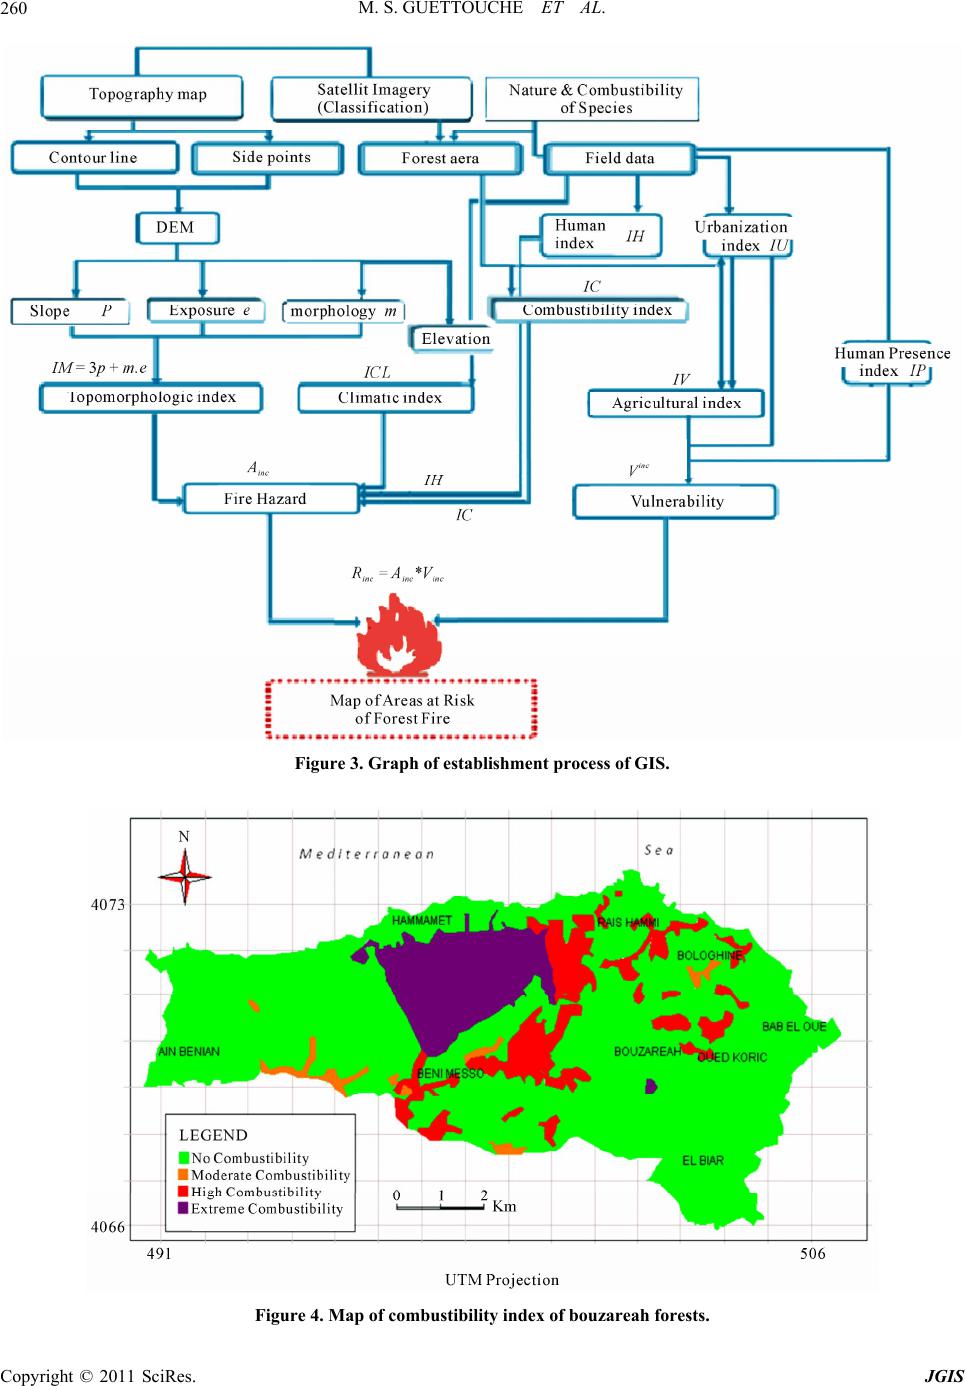 M. S. GUETTOUCHE ET AL. Copyright © 2011 SciRes. JGIS 260 Figure 3. Graph of establishment process of GIS. Figure 4. Map of combustibility index of bouzareah forests. 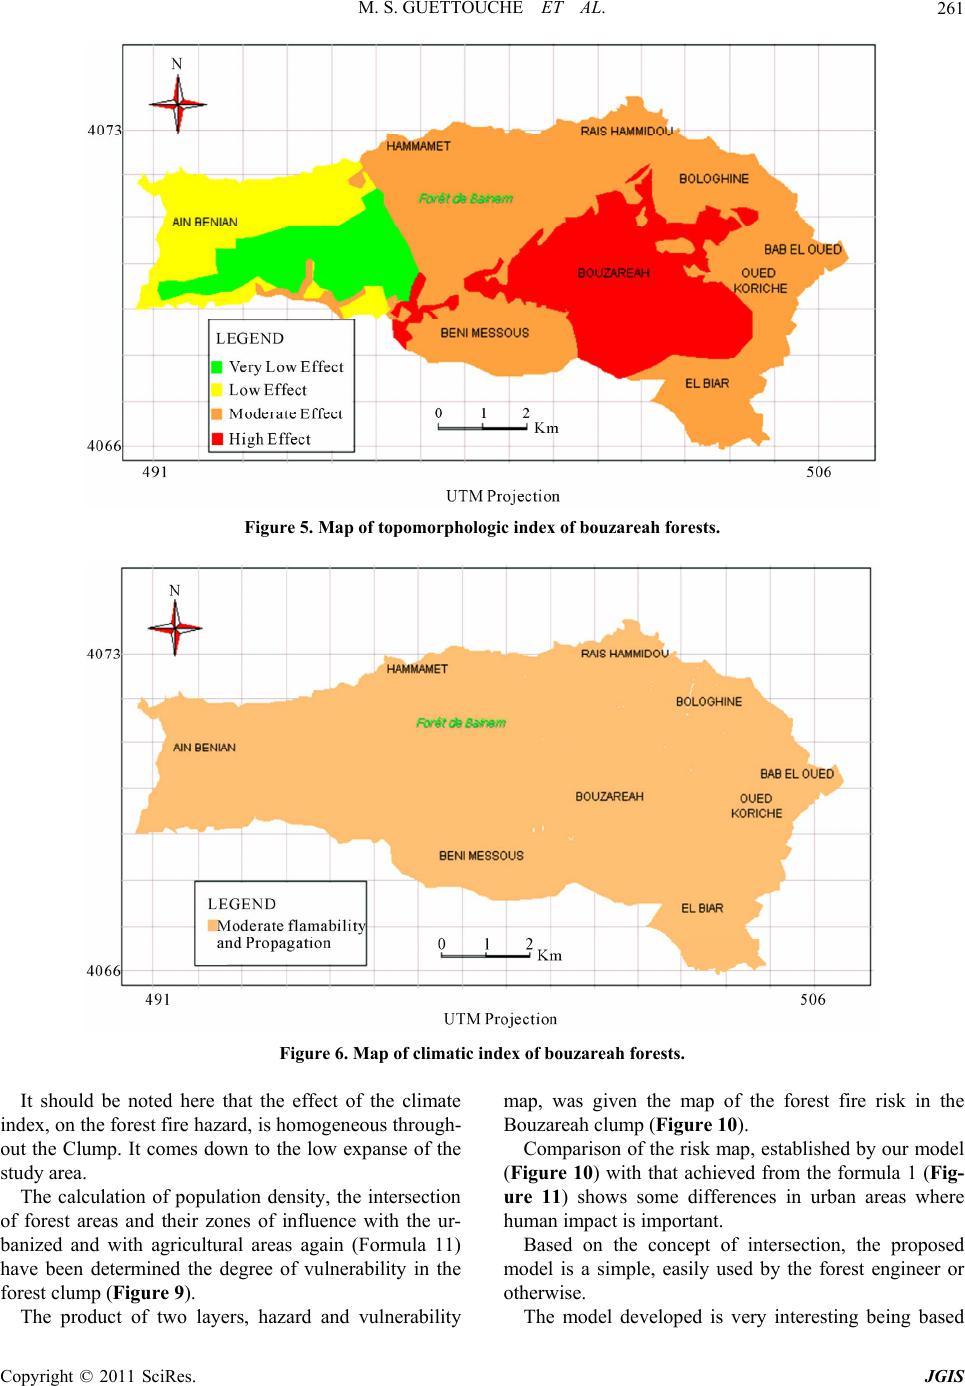 M. S. GUETTOUCHE ET AL. Copyright © 2011 SciRes. JGIS 261 Figure 5. Map of topomorphologic index of bouzareah forests. Figure 6. Map of climatic index of bouzareah forests. It should be noted here that the effect of the climate index, on the forest fire hazard, is homogeneous through- out the Clump. It comes down to the low expanse of the study area. The calculation of population density, the intersection of forest areas and their zones of influence with the ur- banized and with agricultural areas again (Formula 11) have been determined the degree of vulnerability in the forest clump (Figure 9). The product of two layers, hazard and vulnerability map, was given the map of the forest fire risk in the Bouzareah clump (Figure 1 0 ). Comparison of the risk map, established by our model (Figure 10) with that achieved from the formula 1 (Fig- ure 11) shows some differences in urban areas where human impact is important. Based on the concept of intersection, the proposed model is a simple, easily used by the forest engineer or otherwise. The model developed is very interesting being based  M. S. GUETTOUCHE ET AL. Copyright © 2011 SciRes. JGIS 262 Figure 7. Map of human index of bouzareah forests. Figure 8. Map of fire hazard of bouzareah forests. not on the number of fires, but on factors initiation and propagation of the fire, with a weighting based on the judgments of experts, because we do not wait Fire to plan its management. Similarly, this model could be easily applied to other regions of the Mediterranean area since the similarity of the environmental landscapes and likeness of the climate. It is well established that combustion is individually driven by climatic factors [8]. The integration of the cli- mate factor in the model is essential because it plays a major role in the spread of fire and that may act at sev- eral levels. For example, the wind acts by renewing the oxygen in the air, reducing the angle between the flames and the land and promoting the transport of incandescent  M. S. GUETTOUCHE ET AL. Copyright © 2011 SciRes. JGIS 263 particles in front of the flame. The speed of propagation of a fire is closely correlated with wind speed but also to the arid environment. On the other hand, the notion of risk involves a vul- nerability to fire hazard. The model of Equation (1), es- tablished for the forests of the Mediterranean area [14], obscures this part, which defines, in fact, the risk of for- est fire. The evolution of land use influences, particularly on the risk of forest fires due to the development of the interface forest/habitat and the absence of buffer zone areas that are cultivated. The robustness of the model is predicting the risk of forest fires, based only on flamma- bility criteria. This model is not static and rigid: you can change some timing to give more weight to one factor or another decrease. Figure 9. Vulnerability map of bouzareah clump. Figure 10. Map of forest fire risk in the bouzareah clump.  M. S. GUETTOUCHE ET AL. Copyright © 2011 SciRes. JGIS 264 Figure 11. Map of forest fire risk in the bouzareah clump (formula 1). 5. Conclusions In this work, we proposed an improved model of the for- est fire risk (1), adding the effects of climatic parameters and human activity on the hazard, and adopting the sci- entific definition of risk. Spatialization of risk has been established using a GIS approach. Applying the proposed model on forest areas of Bouzareah clump, using techniques Geomatics (Re- mote Sensing and GIS) allows establishing map risk of forest fire using multiple layers of information from maps and terrain. The operation of combination of layers is used for mapping the areas of forest fire hazard and areas vulnerable to fire. The fire risk map is not a means of struggle, but it helps establish a forestry plan and an adequate control. In addition to managing the problem of urbanization in ha- zardous areas, becomes possible and controllable. This is the current state of knowledge on risk “forest fire,” noted yearly. Researchers are likely to perform; can we model in the laboratory to understand empirically what this product? 6. References [1] S. Kuntz and M. Karteris, “Fire Risk Modelling Based on Satellite Remote Sensing and GIS,” EARSel Advances in Remote Sensing, Vo. 4, No. 3, 1995, pp. 39-46. [2] E. Chuvieco, A. De Santis, D. Riaño and K. Halligan, “Simulation Approaches for Burn Severity Estimation Us- ing Remotely Sensed Images,” Fire Ecology Special Issue, Vol. 3, No. 1, 2007, pp. 129-152 [3] Gh. Faour, R. Bou Kheir and A. Darwish, “Méthode Globale d’Evaluation du Risque d’Incendies de Foret Utilisant la Télédétection et les SIG: Cas du Liban,” Rev. Télédétection, Vol. 5, No. 4, 2006, pp. 359-377. [4] C. Lampin, M. Jappiot, N. Alibert, R. Manlay and R. Guillande, “A: Prototype d’une Echelle d’Intensite pour le Phenomene Incendie de Forets,” Ingénieries EAT, Vol. No. 31, 2002, pp. 49-56. [5] D. Alexandrian, F. Esnault and G. Calabri, “Feux de Forêt dans la Région Méditerranéenne,” Unasylva n 197 - La Forêt Méditerranéenne, Vol. 50, 1999/2 Revue Inter- nationale des Forêts et des Industries Forestières, FAO. [6] G. Carbonell, “Embrasement Généralisé Eclair en Feu de Forêt,” Embrasement Généralisé Éclair en Feu de Forêt, 2004, p. 153. [7] P. Carrega, “Le Risque d’Incendies de Forêt en Région Méditerranéenne: Compréhension et Evolution, Mont- pellier, France, 2008. [8] P. Carrega and N. Jeronimo, “Risque Météorologique d’Incendie de Foret et Méthodes de Spatialisation pour une Cartographie a Fine Echelle,” Actes du XXème Colloque International de l’AIC, Tunis, Septembre 2007, p. 7. [9] P. Carrega, “A Meteorological Index of Forest Fire Haz- ard in Mediterranean France,” International Journal of Wildland Fire, Vol. 1, No. 2, 1991, pp. 79-86. [10] Dagorne and J. M. Castex, “Gestion des Espaces Fore- stiers et Sub-Forestiers en Zones Rouges. L’exemple de Saint-Césaire-sur-Siagne (Alpes-Maritimes, France),” Fi- nisterra, Vol. 27, No. 53-54, 1992, pp. 141-166. [11] Mariel, “Cartographie du Niveau de Risque d’Incendie, Exemple du Massif des Maures,” Rapport CEMAGREF, 1995. [12] Meddour-Sahar, R. Meddour and A. Derridj, “Analyse des Feux de Forêts en Algérie sur le Temps Long 1876-2007,” les Notes d’analyse du CIHEAM, n 39, Septembre 2008,  M. S. GUETTOUCHE ET AL. Copyright © 2011 SciRes. JGIS 265 p. 11. www.ciheam.org. [13] D. Tàbara, D. Saurí and R. Cerdan, “Forest Fire Risk Ma- nagement and Public Participation in Changing Socio- environmental Conditions: A Case Study in a Mediterra- nean Region,” Risk Analysis, Vol. 23, No. 2, April 2003, pp. 249-260. [14] Dagorne and Y. Duche, “Protection des forêts Contre les Incendies & Système d’Information Géographique. Appli- cation à la Commune d’Auribeau sur Siagne (Alpes Maritimes)” Revue Forêt Méditerranéenne. T: XV, n 4, octobre 1994, pp. 416-419. [15] D. Bernoulli (1738) Specimen Theoriae Novae de Men- sura Sortis {Commentarii Academiae Scientiarum Impe- rialis Petropolitanae (5, 175-192, 1738)}, Econometrica, Vol. 22, 1954, pp. 23-36. [16] P. Curé, “Remarque sur l’Equivalence de Certains Indices Utilisés Pour la Classification des Climats,” La Mété- orologie, Juillet-Décembre 1945, pp. 202-208. [17] F. Lebourgeois and Ch. Piedallu, “Appréhender le Niveau de Sécheresse dans le Cadre des Etudes Stationnelles et de la Gestion Forestière à Partir d’Indices Bioclima- tiques,” Rev. For. Fr. LVII, April 2005, pp. 331-356. [18] H. Gaussen and F. Bagnouls, “L’Indice Xérothermique,” Bulletin de l’Association des Géographes Français, n 222-223, 1952, pp. 10-16. [19] R. Michalet, “Nouvelle Synthèse Bioclimatique des Mi- lieux Mediterraneens. Application au Maroc Septen- trional,” Revue d’Écologie Alpine, Vol. 1, 1991, pp. 60- 80. [20] M. S. Guettouche, “Modélisation du Risque d’Incendie de Forêts et Validation par Approche Géomatique. Appli- cation sur la Forêt du Sahal Algérois (Algérie),” Congrès International GeoTunis, 29 Novembre-3 December 2010, Tunis, Tunisie. [21] M. Belhadj-Aissa, A. Belhadj-Aissa and Y. Smara, “Appli- cation du SIG et de la Télédétection dans la Gestion des feux de Forets en Algérie,” 2nd FIG Regional Conference Marrakech, Morocco, 2-5 December 2003, p. 16. [22] Missoumi and K. Tadjerouni, “SIG et Imagerie Alsat1 pour la Cartographie du Risque d’Incendie de Forêt,” Proceedings of the 2nd FIG Regional Conference, Ma- rrakech, Morocco, 2-5 December 2003, p. 14. [23] M. Khader, et al., “Etude du Risque Incendie à l’Aide de la Géomatique: cas de la Forêt de Nesmoth (Algérie),” Me- diterránea, Serie de Estudios Biológicos, Universitat d’Alacant Departamento de Ecología, Facultad de Ciencias, Época II, No. 20, 2009, pp. 10-38, ISSN 1130-6203. [24] F. Peigneux, “Utilisation des Systèmes d’Information Géo- référée dans l’Analyse du Risque. Etude de cas: le Gua- temala, à l’Echelle Départementale,” Certificat de Spé- cialisation en Géomatique 3e cycle, Centre Universitaire d’Ecologie Humaine, Université de Genève, Ge- nève, 2003, p. 37. |