Journal of Applied Mathematics and Physics
Vol.04 No.04(2016), Article ID:65460,7 pages
10.4236/jamp.2016.44076
Portfolio Construction for Value Appreciation
Michael Ha, George Z. Liu, Lihui Zheng
1Financial Mathematics Programme, Xi’an Jiaotong-Liverpool University, Suzhou, China
2Risk Strategy & Derivatives, Asia Pacific, Allianz Global Investors, Hong Kong, China
3Risk Management Department, Huatai-Pinebridge Fund Management Co. Ltd., Shanghai, China


Received 7 March 2016; accepted 6 April 2016; published 13 April 2016
ABSTRACT
Background: While working as risk consultants at Barra in 1990’s, the first two authors decided to start collaborating on a research project with its first paper titled “Application of Volatility in Portfolio Construction” [1]. The third author was then a risk manager of a financial institution which was a client of Barra’s. Bringing his expertise in portfolio risk management, he joined the research team. Aim: The core of this paper lies in the construction of an investment portfolio with a main objective of value appreciation while examining its tracking error [1]-[3], a risk measurement with reference to a benchmark [1] [4]. The authors believe, while tracking error measurement is a common tool for portfolio risk management, total risk measurement is more important. The management goal is to minimize drawbacks using the technique of risk budgeting. These topics will be discussed in future research papers.
Keywords:
Tracking Error, Beta, Valuation, Exposure, Monitoring, Rebalance

1. Introduction
RCM (a company which is now fully integrated into Allianz Global Investors) is a growth style stock selection driven equity manager. We believe that fundamental research combined with non-financial research, GrassrootsSM, allows investment managers and analysts to identify opportunities ahead of the market and thereby benefit from price appreciation. Central to RCM’s investment philosophy is the belief that rigorous fundamental research of securities combined with a disciplined valuation methodology will enable us to outperform benchmarks [4] while maintaining a below average risk profile. As such, RCM is a fundamental, bottom-up research company focused on identifying the best risk-adjusted investments. Country and sector/industry selection are primarily a result of identifying superior securities. We monitor allocations to ensure that we are only taking measured bets away from the benchmark.
RCM invests in high quality growth companies whose growth in earnings will provide returns in excess of the market while preserving clients’ principal in down markets. A disciplined identification process is facilitated through fundamental research and a series of valuation disciplines, purchasing those securities whose growth in earnings/dividends and/or cash flow will provide a total return in excess of the market. The investment approach seeks to generate superior returns over a full market cycle.
2. Portfolio Construction and Investment Process
Portfolios are constructed by taking into account of stock selection considerations. We aim to build portfolios that contain the very best individual stock opportunities across the Pacific Rim region. Our stock selection is the result of a 5-step consensus decision-making process which is shown in Table 1. Our strong tradition and proven track record of managing Asia-Pacific investments and the full range of 10 Asian single country funds provides the foundation for this decision making process. Asset allocation is applied as a risk control measure based on an assessment of liquidity and macro-economic conditions.
The investment process can be summarized according to the following 5 steps:
2.1. Growth and Quality
Stock ideas are generated at the market and sector level from the stock universe. We identify stocks which show good potential for both secular and internal earnings growth. Through our extensive research and local market awareness, we aim to avoid predictable threats to a business, whether technological, regulatory, or via competition. When examining a company, we look at a balance between growth prospects, quality of the company and valuation.
2.2. Valuation Discipline
Upon identifying growth and quality, we assess whether the company is available at reasonable value. We use, among other measures, P/E relative to market, book value and price to cash flow to measure a company's value. RCM’s emphasis on proprietary fundamental and grassroots research has led the company to construct RIMS Express, our central repository of analytical data. This system enables detailed analysis of individual stocks, risk indicators, valuations and company research notes. The system also enables the user to conduct detailed analysis of both benchmark data and portfolio data.
2.3. Security Selection
We employ a common voting system to assess overall opinions and determine stock weightings. Each member of the relevant sector team has an opportunity to register opinions ranging from disfavour to strong preference,

Table 1.Decision-making process.
on an absolute basis. The sector team is composed of analysts who are individually responsible for their stocks and often representatives from GrassrootsSM. The authority for “buys” is driven by a disciplined team process based around a stock rating system. As illustrated in Table 2, all stocks are rated on a 1 to 5 basis for considered inclusion within an equity portfolio. This systematic stock analysis ensures consistency on a global basis across our different offices.
Stocks are chosen for their growth prospects and therefore analysts naturally monitor stocks for their long- term suitability for equity portfolios. 12 - 18 months would be considered the minimum holding period although in general our investment philosophy is geared toward a longer term three-year period.
Once recommendations have been made, they are entered onto RIMS Express, the central repository for global analysis at RCM. Company fundamentals are entered, along with the analyst’s recommendations and a calculation of target price and hence percentage upside. In this way the fund manager can differentiate between votes with the same rank, on an absolute basis.
2.4. Portfolio Construction
Portfolio construction is predominately judgmentally-driven focusing on using the best investment ideas from the research process. The portfolio manager looks to add value by taking active positions versus the benchmark where our bottom-up stock selection process identifies investment opportunities.
2.5. Controls
The portfolio would be monitored daily with regard to the portfolio’s position in relation to the benchmark, sector exposure [1], investment restrictions and other client guidelines. The CIO, together with Risk Manager, would review the portfolio regularly to ensure consistency with the recommendations, process and client guidelines.
3. Portfolio Review
3.1. Drawdown Analysis
The portfolio is up 10.89% for year 2004, while the benchmark FTSE AW Asia Pacific ex Japan Index is up 15.18% in Sterling terms. Although we are disappointed with the underperformance over the past year, the negative divergence is not extraordinary in relevance to our risk tolerance [1] and investment guidelines.
Given that the predicated portfolio tracking error [1]-[3] has been steady around 3.1% per annum, we are not taking any excessive risk at all. The negative divergence of −4.29% represents a 1.37 standard deviation event with roughly 10% chance of happening. In another word, the relative underperformance is not a rare event as it is within our risk tolerance as implied by the tracking error [5]. In addition, according to the investment guidelines, the downside tolerance is no more than −5% p.a. over any rolling 12-month period, relative to the benchmark index. As shown in performance chart, the worst recent 12-month rolling return of the portfolio is around −3.8%, which is within the guideline.
Initially, the portfolio was showing a sign of bottoming out in November-04 as recent underperformance is decelerating. The portfolio outperformed the benchmark by 0.27% for the month, apparently due to the fact that our stock picks are delivering better results. The rolling 12-month return is showing similar encouraging sign

Table 2.Voting system.
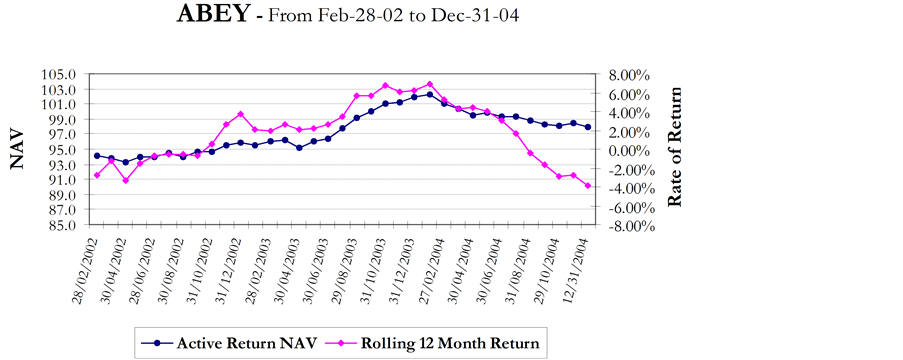
Graph 1. ABEY’s returns.
as it has buckled the recent downward trend. Unfortunately, the portfolio was not able to carry the positive momentum into December. Investors’ profit taking on some of our core holdings, such as CNOOC, Indosat, Telekom Malaysia, and Hopewell Holdings, has cost our portfolio 0.38% alone in relative performance. As this event was not driven by fundamentals, we continue to hold these names in the core portfolio.
3.2. Stock Selection Analysis
Nevertheless, we are certainly not content with the underperformance for the year 2004. The Performance Attribution analysis reveals that the underperformance is mainly due to relatively weak performance of our stock picks. As such, we have thoroughly analyzed stocks we hold that underperformed and stocks we do not own but outperformed. In particular, we have reviewed each of these names in the context of whether they have failed to deliver positive earnings surprises or gone through a de-rating.
Our bottom-up research result is best illustrated by Newcrest Mining, which outperformed the index by 47% in 2003. We held this stock since the beginning of 2003 due to our favourable outlook of the gold price. Additionally, we predicted the imminent capacity increase of the Telfer plant would provide an earning boost. The outperformance of this holding in 2003 has proved our views to be accurate. Another excellent example is Hopewell Holdings, which we accumulated in 2002. The company outperformed the index by 94% in 2003. We picked up the stock on its attractive valuation as it was trading below its historical average P/E. Additionally the company was beginning to see results from its debt restructuring efforts. The stock ended up being one of the best performing stocks in our portfolio.
3.3. Portfolio Outlook
As explained earlier, the negative divergence of −4.29% from benchmark for year 2004 is the result of relatively poor performance of our stock picks. As such, we have done a thorough analysis of our stock selection and taken actions accordingly, i.e. exit names whose fundamentals have changed unfavourably and hold on to names that we have strong convictions. At the portfolio level, we continue to monitor country and sector exposures [1] closely to ensure that we are not taking any unintentional bets.
The list of our top 10 active holdings as of December 31, 2004 consists of AMP, TSMC, Cathay Financial, BHP Billiton, Great Eagle, Hyundai Mobis, China Telecom, Newcrest Mining, Hopewell and Hong Kong Exchange. We firmly believe the overweight holdings will deliver good result in coming quarters as they have proven management and impressive earning track records.
4. Risk Management Review
Risk control was always an integral part of our investment process. On a weekly basis, the CIO together with the Risk Manager would review portfolio risk characteristics to ensure real-time compliance with investment guidelines and that portfolio risks are in line with portfolio style in terms of matching risk and return expectations.
In terms of this particular portfolio, as shown in the risk decomposition chart (Chart 1), the tracking error has been fairly constant around 3% with more than 50% coming from specific risk [1] (stock picking) and 30% coming from fundamental with clear growth style bias. Given that stock picking and fundamental are clearly related, from risk perspective, the portfolio is true to label as a bottom up driven growth portfolio.
Although our investment process is mainly bottom up driven, we always keep a close eye on sector and country exposures [1]. The benchmark deviations [1] [5] [10] [12] [13] in sectors and countries are nothing but a residual [1] by-product of our stock picking, that’s why the deviations are always small. Similarly, the annualized industry and country risks are small as they only account for 6% and 9% each of portfolio tracking error (Chart 2).
Interestingly, when the current portfolio is re-balanced to be sector neutral, country neutral, and both sector/country neutral, the resulting industry and country risk did not decrease much at all in absolute terms (see Chart 2). First of all, factor risk such as country and industry risks could never be totally isolated due to correlations [10] [11] among them. Secondly, country dollar neutral does not mean country risk would be zero as effective active country exposure [1] might not be zero due to country betas [1] [6]-[9]. Meanwhile, sector dollar neutral does not mean industry risk would be zero, as industry biases could still exist. As such, it does not make much sense for us to be sector and country dollar neutral at all times because it would only reduce overall portfolio risk marginally.
5. Conclusion
We now conclude our study by highlighting a few key points.
Chart 1. (Source: wilshire).

Chart 2. (Source: wilshire).

1) The portfolio was up 10.89% for the year 2004 while benchmark FTSE AW Asia Pacific ex Japan went up 15.18% in Sterling terms. The portfolio underperformed mainly due to weak performance of our stock picks. Having thoroughly analyzed the performance of our stock picks in light of their fundamentals, we exited names whose fundamentals had changed unfavourably and held on to names that we had strong convictions. At the portfolio level, we continued to monitor country and sector exposures closely to ensure that we were not taking any unintentional bets.
2) Risk control was always an integral part of our investment process. The tracking error of this portfolio was steady around 3% with more than 50% coming from specific risk (stock picking) and 30% coming from fundamental (growth style). The recent portfolio divergence of 3.45% was not unusual as it fell well within our risk tolerance implied by portfolio tracking error. The recent rolling 12-month return also fell well within the −5% threshold as stipulated in the investment guidelines.
3) Although our investment process was mainly bottom up driven, we always kept a close eye on sector and country exposures. The benchmark deviations in sectors and countries were nothing but a residual by-product of our stock picking. Given that the deviations and corresponding risks were always small, it did not make much sense for us to be sector and country dollar neutral at all times because it would only reduce overall portfolio risk marginally.
Acknowledgements
The authors would like to thank Xian Jiaotong-Liverpool University for supporting and sponsoring the publication of this paper.
Cite this paper
Michael Ha,George Z. Liu,Lihui Zheng, (2016) Portfolio Construction for Value Appreciation. Journal of Applied Mathematics and Physics,04,662-668. doi: 10.4236/jamp.2016.44076
References
- 1. Ha, M., Liu, G. and Zheng, L.H. (2015) Application of Volatility in Portfolio Construction. Journal of Applied Mathematics and Physics, 3, 808-813. http://dx.doi.org/10.4236/jamp.2015.37099
- 2. Bodie, Kane and Marcus (2011) Investments and Portfolio Management. 9th Edition, McGraw-Hill.
- 3. Chance, D.M. (2003) Analysis of Derivatives for the CFA Program. AIMR.
- 4. Maginn, J.L. and Tuttle, D.L. (1990) Managing Investment Portfolio. 2nd Edition, Warren, Gorham & Lamont.
- 5. Grinold, R.C. and Kahn, R.N. (1995) Active Portfolio Management. Pro-bus.
- 6. Chew, D.H. (1999) The New Corporate Finance Where Theory Meets Practice. 2nd Edition, Irwin McGraw-Hill.
- 7. Crouhy, M., Galai, D. and Robert, M. (2001) Risk Management. McGraw-Hill.
- 8. Vernimmen, Quiry, Dallocchio, Le Fur and Salvi (2011) Corporate Finance Theory and Practice. 3rd Edition, Wiley.
- 9. Elton, Gruber, Brown and Goetzmann (2011) Modern Portfolio Theory and Investment Analysis. 8th Edition, Wiley.
- 10. Ha, M. (2013) Lecture Notes for Course: Financial Risk Management. Xian Jiaotong-Liverpool University.
- 11. Miller, M.B. (2012) Mathematics and Statistics for Financial Risk Management. Wiley.
- 12. Panjer, H.H. (1998) Financial Economics. The Actuarial Foundation.
- 13. Zenios, S.A. (1993) Financial Optimization. Cambridge. http://dx.doi.org/10.1017/CBO9780511522130