 Journal of Geographic Information System, 2011, 3, 195-210 doi:10.4236/jgis.2011.33016 Published Online July 2011 (http://www.SciRP.org/journal/jgis) Copyright © 2011 SciRes. JGIS A Spatially Heterogeneous Expert Based (SHEB) Urban Growth Model Using Model Regionalization Dimitrios Triantakonstantis, Giorgos Mountrakis, Jida Wang Department of Environmental Resources Engineering, State University of New York College of Environmental Science and Forestry , Syracuse, USA E-mail: dim30@aua.gr, gm@esf.edu, gdbruins @ ucl a.edu Received March 26, 20 1 1; revised May 13, 2011; accepted Ma y 25, 2011 Abstract Urbanization changes have been widely examined and numerous urban growth models have been proposed. We introduce an alternative urban growth model specifically designed to incorporate spatial heterogeneity in urban growth models. Instead of applying a single method to the entire study area, we segment the study area into different regions and apply targeted algorithms in each subregion. The working hypothesis is that the integration of appropriately selected region-specific models will outperform a globally applied model as it will incorporate further spatial heterogeneity. We examine urban land use changes in Denver, Colorado. Two land use maps from different time snapshots (1977 and 1997) are used to detect the urban land use changes, and 23 explanatory factors are produced to model urbanization. The proposed Spatially Heterogeneous Ex- pert Based (SHEB) model tested decision trees as the underlying modeling algorithm, applying them in dif- ferent subregions. In this paper the segmentation tested is the division of the entire area into interior and ex- terior urban areas. Interior urban areas are those situated within dense urbanized structures, while exterior urban areas are outside of these structures. Obtained results on this model regionalization technique indicate that targeted local models produce improved results in terms of Kappa, accuracy percentage and multi-scale performance. The model superiority is also confirmed by model pairwise comparisons using t-tests. The segmentation criterion of interior/exterior selection may not only capture specific characteristics on spatial and morphological properties, but also socioeconomic factors which may implicitly be present in these spa- tial representations. The usage of interior and exterior subregions in the present study acts as a proof of con- cept. Other spatial heterogeneity indicators, for example landscape, socioeconomic and political boundaries could act as the basis for improved local segmentations. Keywords: Urban Growth Models, Spatial Heterogeneity, Model Fusion, Decision Trees, Denver 1. Introduction Urbanization is a phenomenon observed since ancient times. It has been strengthened and acquired global mag- nitude over the last two centuries. More specifically, in year 1800 only 2% of p eople lived in cities, while in year 1900 the ratio incr eased to 12%. In year 2008, more th an 50% of the world population lived in urban areas [1], and it is estimated that by year 2025 80% of human popula- tion will live in cities [2]. This transition has and will change further socioeconomic structure, environmental resource allocation and ecosystem behavior. Urban en- vironmental planning has been quantitatively and quali- tatively supported by applying weighted overlay methods to the driving factors [3], as well as geostatistical tech- niques as an important part of the GIS-SPRING software capabilities [4]. It is therefore crucial to develop models for urban growth prediction to support interdisciplinary policy decisions for a sustainable future. Numerous models have been recently developed for land use change prediction (for example [5-9]). The in- fluence of biophysical and socioeconomic factors on land use changes has been an important issue in scientific debates [10] and significant investments are made in the understanding of linkages between ecosystems, climate and land use. For example, the National Science Founda- tion currently invests $22.5 million to human-environ- ment research, with a significant portion devoted to land 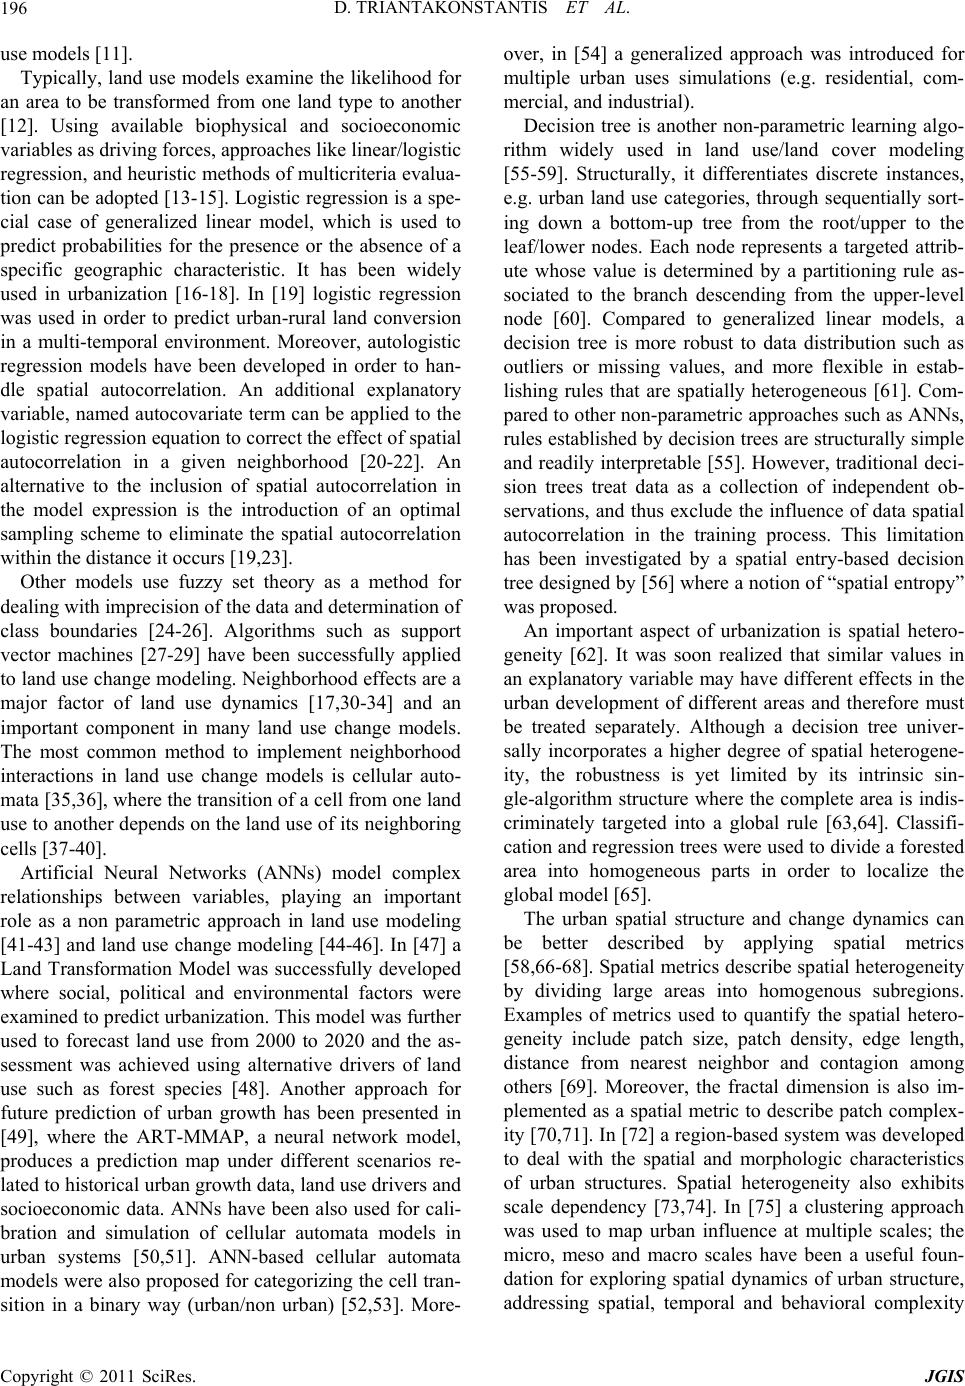 D. TRIANTAKONSTANTIS ET AL. 196 use models [11]. Typically, land use models examine the likelihood for an area to be transformed from one land type to another [12]. Using available biophysical and socioeconomic variables as driving fo rces, approaches like linear/logistic regression, and heuristic methods of multicriteria evalua- tion can be adopted [13-15]. Logistic regression is a spe- cial case of generalized linear model, which is used to predict probabilities for the presence or the absence of a specific geographic characteristic. It has been widely used in urbanization [16-18]. In [19] logistic regression was used in order to predict urban-rural land conversion in a multi-temporal environment. Moreover, autologistic regression models have been developed in order to han- dle spatial autocorrelation. An additional explanatory variable, named autocovariate term can be applied to the logistic regression equation to correct the effect of spatial autocorrelation in a given neighborhood [20-22]. An alternative to the inclusion of spatial autocorrelation in the model expression is the introduction of an optimal sampling scheme to eliminate the spatial autocorrelation within the distance it occurs [19,23]. Other models use fuzzy set theory as a method for dealing with imprecision of the data and determination of class boundaries [24-26]. Algorithms such as support vector machines [27-29] have been successfully applied to land use chan ge modeling. Neighborhoo d effects are a major factor of land use dynamics [17,30-34] and an important component in many land use change models. The most common method to implement neighborhood interactions in land use change models is cellular auto- mata [35 ,36], wh ere th e transition of a cell from one land use to another depends on the land use of its neighboring cells [37-40]. Artificial Neural Networks (ANNs) model complex relationships between variables, playing an important role as a non parametric approach in land use modeling [41-43] and land use change modeling [44-46]. In [47] a Land Transformation Model was successfully developed where social, political and environmental factors were examined to predict urbanization. This model was further used to forecast land use from 2000 to 2020 and the as- sessment was achieved using alternative drivers of land use such as forest species [48]. Another approach for future prediction of urban growth has been presented in [49], where the ART-MMAP, a neural network model, produces a prediction map under different scenarios re- lated to historical urban growth data, land use drivers and socioeconomic data. ANNs have been also used for cali- bration and simulation of cellular automata models in urban systems [50,51]. ANN-based cellular automata models were also proposed for categorizing the cell tran- sition in a binary way (urban/non urban) [52,53]. More- over, in [54] a generalized approach was introduced for multiple urban uses simulations (e.g. residential, com- mercial, and industrial). Decision tree is another non-parametric learning algo- rithm widely used in land use/land cover modeling [55-59]. Structurally, it differentiates discrete instances, e.g. urban land use categories, through sequentially sort- ing down a bottom-up tree from the root/upper to the leaf/lower nodes. Each node represents a targeted attrib- ute whose value is determined by a partitioning rule as- sociated to the branch descending from the upper-level node [60]. Compared to generalized linear models, a decision tree is more robust to data distribution such as outliers or missing values, and more flexible in estab- lishing rules that are spatially heterogeneous [61]. Com- pared to other non-parametric approaches such as ANNs, rules established by decision trees are structurally simple and readily interpretable [55]. However, traditional deci- sion trees treat data as a collection of independent ob- servations, and thus exclude the influence of data spatial autocorrelation in the training process. This limitation has been investigated by a spatial entry-based decision tree designed by [56] where a notion of “spatial entropy” was proposed. An important aspect of urbanization is spatial hetero- geneity [62]. It was soon realized that similar values in an explanatory variable may have different effects in the urban development of different areas and therefore must be treated separately. Although a decision tree univer- sally incorporates a higher degree of spatial heterogene- ity, the robustness is yet limited by its intrinsic sin- gle-algorithm structure where the complete area is indis- criminately targeted into a global rule [63,64]. Classifi- cation and regression trees were used to divide a forested area into homogeneous parts in order to localize the global model [65]. The urban spatial structure and change dynamics can be better described by applying spatial metrics [58,66-68]. Spatial metrics de scribe spatial heterogeneity by dividing large areas into homogenous subregions. Examples of metrics used to quantify the spatial hetero- geneity include patch size, patch density, edge length, distance from nearest neighbor and contagion among others [69]. Moreover, the fractal dimension is also im- plemented as a spatial metric to describe patch complex- ity [70,71]. In [72] a region-based system was developed to deal with the spatial and morphologic characteristics of urban structures. Spatial heterogeneity also exhibits scale dependency [73,74]. In [75] a clustering approach was used to map urban influence at multiple scales; the micro, meso and macro scales have been a useful foun- dation for exploring spatial dynamics of urban structure, addressing spatial, temporal and behavioral complexity Copyright © 2011 SciRes. JGIS 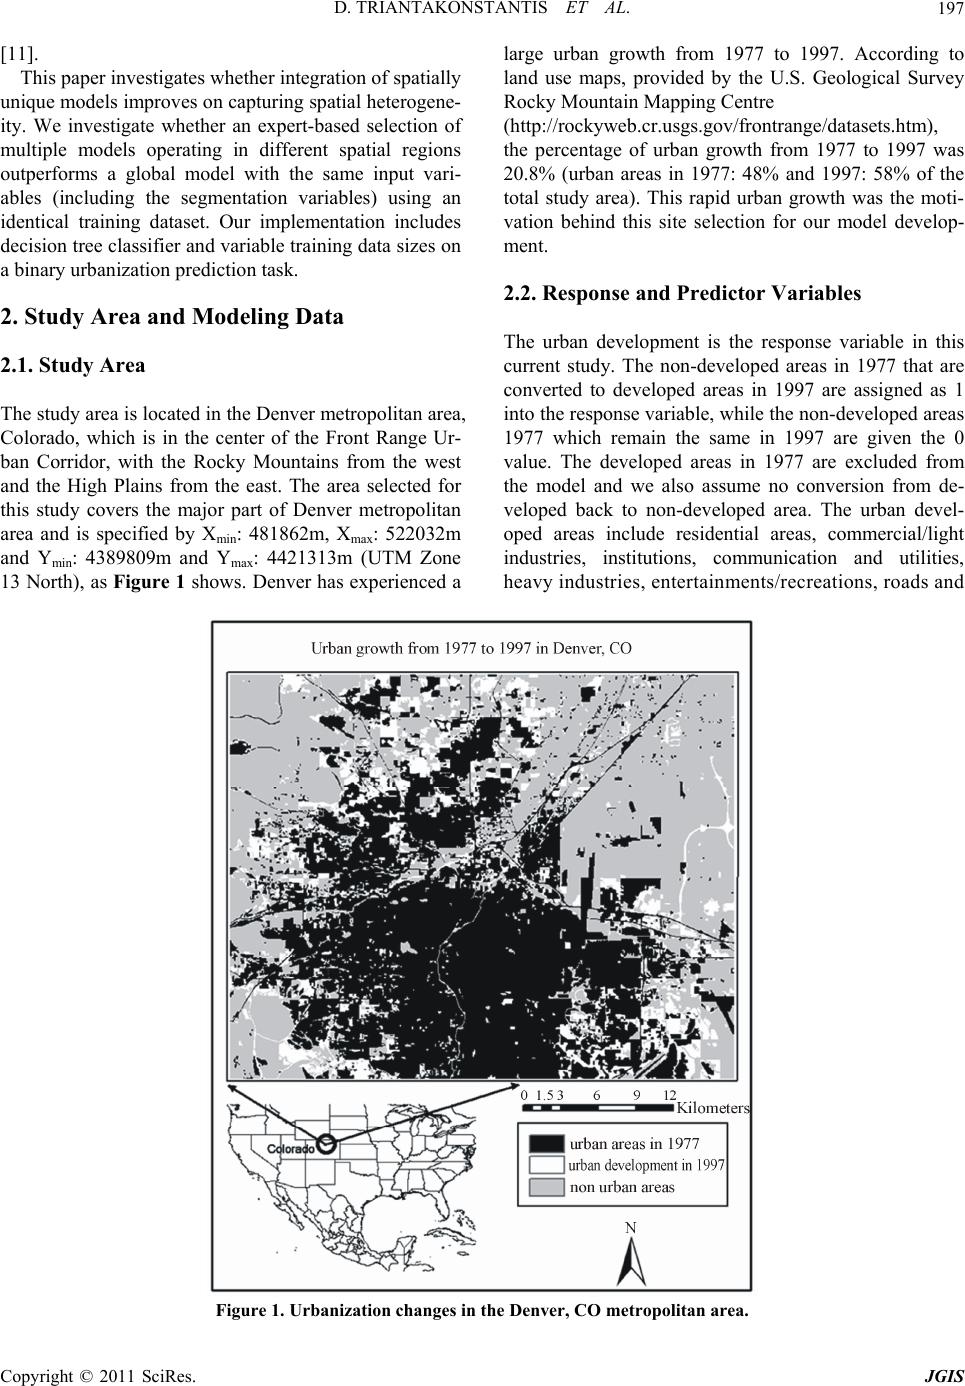 D. TRIANTAKONSTANTIS ET AL. Copyright © 2011 SciRes. JGIS 197 [11]. This paper investigates whether integration of spatially unique models improves on capturing spatial heterogene- ity. We investigate whether an expert-based selection of multiple models operating in different spatial regions outperforms a global model with the same input vari- ables (including the segmentation variables) using an identical training dataset. Our implementation includes decision tree classifier and variable training data sizes on a binary urbani zat i on prediction task . 2. Study Area and Modeling Data 2.1. Study Area The study area is located in the Denver metropo litan area, Colorado, which is in the center of the Front Range Ur- ban Corridor, with the Rocky Mountains from the west and the High Plains from the east. The area selected for this study covers the major part of Denver metropolitan area and is specified by Xmin : 481862m, Xmax: 522032m and Ymin: 4389809m and Ymax: 4421313m (UTM Zone 13 North), as Figure 1 shows. Denver has experienced a large urban growth from 1977 to 1997. According to land use maps, provided by the U.S. Geological Survey Rocky Mountain Mapping Centre (http://rockyweb.cr.usgs.gov/frontrange/datasets.htm), the percentage of urban growth from 1977 to 1997 was 20.8% (urban areas in 1977: 48% and 1997: 58% of the total study area). This rapid urban growth was the moti- vation behind this site selection for our model develop- ment. 2.2. Response and Predictor Variables The urban development is the response variable in this current study. The non-developed areas in 1977 that are converted to developed areas in 1997 are assigned as 1 into the response variab le, while the non -developed ar eas 1977 which remain the same in 1997 are given the 0 value. The developed areas in 1977 are excluded from the model and we also assume no conversion from de- veloped back to non-developed area. The urban devel- oped areas include residential areas, commercial/light industries, institutions, communication and utilities, heavy industries, entertainments/recreations, roads and Figure 1. Urbanization changes in the Denver, CO metropolitan area.  D. TRIANTAKONSTANTIS ET AL. 198 other transportation. We examine 21 predictor variables which are pro- duced using Euclidean distances to the nearest neighbor and Kernel density filters. The predictor variables in- clude: a) Euclidean distance to entertainment venues, heavy industries, rivers, primary roads, secondary roads and minor roads, b) Kernel density (radius: 120 pixel) of agricultural business, residential areas, urban develop- ments, commercial areas, institutes/schools, communica- tions/utilities, lands/ponds, cultivated lands and natural vegetations, c) Kernel density (radius: 10, 30, 50, 80, 100, 150) of distance to urban developments. All the afore- mentioned variables were based on 1977 vector data, no information from 1997 was incorporated as that was our prediction year. Furthermore, elevation and slope are also considered, making 23 the to tal number of predictor variables. Statistical analysis in this study area shows that distance to entertainment, density of residential areas, density of urban development and density of natural vegetations contribute with higher importance in model- ing the urban growth than the other predictor variables [68]. The final form of the dataset expressing response and predictor variables is in a raster representation with a 30m spatial resolution. 3. Model Development 3.1. Theoretical Underpinnings Several algorithms have been proposed for urban mod- eling with varying complexity and success. A motivating factor behind algorithmic selection relies on an algo- rithm’s ability to capture spatial heterogeneity. The cur- rent approach is to rely solely on algorithmic complexity to adjust model behavior in different regions of the entire study site. In this paper we examine whether a segmenta- tion of the study area in subr egions follow ed by selective application of methods within each subregion would lead to improved modeling capabilities. In other words through model regionalization we challenge the current expectation that a highly complex globally applied method can sufficiently recognize local heterogeneity and fine tune performance accordingly. From the model development perspective, we train different models in different subregions and then spa- tially group the results obtained. These subregions are identified based on expert knowledge on different ur- banization drivers. In order to allow a global model to directly compete with our numerous local models the segmentation criterion used to define subregions is also incorporated as an additional input variable to the global model. Therefore the global model has equal opportunity to capture heterogeneity as the local models, because the same input variables and the same modeling techniques are implemented in both cases. We apply decisions trees in order to evaluate our hy- pothesis of multiple local models outperforming a global one. Decision trees are a popular modeling technique as in addition to advanced modeling capabilities, they still remain easy to understand as they can be converted to a set of rules. Decision trees use a training dataset in order to construct the model structure and the produced model is applied to a different dataset (validation) to estimate the prediction accuracy. Of particular interest is per- formance assessment of local vs. global models on a varying training dataset size. Small training sizes are cost-efficient to acquire but there is an overfitting cost associated with them, therefore the identification of proper balance is investigated. 3.2. Subregion Identification Based on Heterogeneous Behavior Extraction of homogenous areas is typically based on fragmentation analysis where spatial and landscape met- rics are adopted. A wide range of relevant metrics has been proposed, especially in ecological applications [67]. In our case fragmentation analysis involved evaluation of spatial distribution of urban development in the entire study area. It was found that some areas have higher propensity for urban development than others; a conse- quence of urbanization density. More specifically, an area surrounded by urban structures may experience dif- ferent development pressures than not surrounded areas [68]. In our study, the entire area is divided into two subre- gions: the interior urban subregion, a dense urbanized area and the exterior urban subregion with no dense ur- ban structures (Figure 2). These two areas exhibit dif- ferent propensity for urban development. Figure 3 demonstrates the cumulative probability that an undeveloped pixel in 1977 would be developed in 1997 at a given distance. That relationship is clearly dif- ferent for the interior and exterior subregions at various distances from already developed areas, which were measured using Euclidean distances between pixel cen- ters. Note that the intention of this graph is to provide a relative comparison between exterior and interior regions leading to motivation beh ind the model develop ment; the graphs purpose is not to directly incorporate these prob- abilities in model design. Undeveloped areas in close proximity to existing urban structures are more likely to be converted to urban land use in general, but note that this probability is significantly higher in interior subre- gions. This is mainly due to the intense human influen ce which occurs near existed urban structures in dense ur- ban environments such as the interior subregion. For C opyright © 2011 SciRes. JGIS  D. TRIANTAKONSTANTIS ET AL. 199 Figure 2. Interior and Exterior subregions of the 1977 Undeveloped area. Euclidean distance from urban areas in 1977 (m) Figure 3. Development probability as a function of Euclidean proximity to existing urban structures for the interior and exte- rior subregions. C opyright © 2011 SciRes. JGIS  D. TRIANTAKONSTANTIS ET AL. 200 example, the commercial value of these properties may be higher than places far away from buildings. Therefore, the decision to separate in the proposed models interior and exterior areas reflects expert knowledge on expected urban devel op ment behavior. Motivated by the divergence in urban development behavior we develop the proposed local models for each subregion (one for the interior and another for the exte- rior) and contrast them with a global model trained and operating in both subregions simultaneously. Further segmentations are possible, especially for the exterior subregion, however this interesting investigation is re- served for futur e work. The purpo se of this manuscr ipt is to demonstrate the proof of concept on model regionali- zation and excite ad ditional research. 3.3. Model Design and Experimental Setup The proposed Spatially Heterogeneous Expert Based (SHEB) model uses multiple decision trees to capture urban growth. The entire study area is divided into the interior and exterior subregions leading to the creation of multiple models to test model regionalization benefits. If a model is trained using samples exclusively from a subregion it is called Local, if samples come from the entire study area the name Global is assigned. We also use a subscript index in the naming structure to reflect where the model is simulated for validation purposes, for example Globalint relates to a globally trained model validated only in the interior subregion. All the Loca l models are trained and validated exclusively in the same subregion, therefore the notation Localint for example suggests a local model trained and validated in the inte- rior subregion. As a result of the above we have devel- oped the following models: Localint: training and validation dataset from the in te- rior subregion. Localext: training and validation dataset from the exte- rior subregion. Globalint: training dataset from the entire study area, validation dataset only fro m the interior subregion. Globalext: training dataset from the entire study area, validation dataset only fro m the exterior subregion. Globalall: training and validation dataset from the entire study area. We should clarify that Globalint, Globalext and Globalall are the exact same model since they are all produced from the same training set from the entire study area; however, model performance is validated in differ- ent regions to allow comparisons with th e corresponding Local models. In order to identify the opti mal balance between Local and Global models we perform comparisons in each subregion (interior and exterior) and in the overall site (all region). The term balance is used to refer to the fact that not always Local models will outperform global ones; in every region we compare the corresponding Lo- cal with the Global model and decide which one to use. The subregion analysis lead to the following pairwise comparisons: a) Localint and Globalint, b) Localext and Globalext. For each subregion, the comparison between the Local and Global models assesses whether spatial heterogeneity should be addressed separately in that re- gion. Depending on the subregion accuracy assessment the predominant subregion-specific model is selected to participate further into the SHEB model structure. Since the SHEB model expects to operate over the entire study site it is compared against the Globalall model. These comparisons are presented graphically in Figure 4. 3.4. Algorithmic Specifics The decision tree models were developed and evaluated in the Matlab environment. Ten observations were set as the minimum for a node to be split. Moreover, each deci- sion tree is adjusted using a 10-fold cross-validation and a pruning process. In order to compare Local and Global models we had to ensure comparable model complexity and input selec- tion. Regarding input selection the Local models contain the aforementioned 23 predictor variables (see section 2.2). The Global models incorporate the exact same 23 variables plus an additional predictor variable: a dummy variable with value of 1 if a point belongs to the interior subregion and the value of -1 if it lies in the exterior subregion. By doing so, the Global models have the po- tential to express the expert-derived interior/exterior segmentation within their model structure. In terms of model complexity the decision trees d eveloped for Local and Global models are directly comparable because the training of each model took place considering the same minimum number of points (10 points) classified in every leaf. The reference output variable is dichotomous, with value 1 if the change is from non-urban in 1977 to urban in 1997, and 0 when the 1977 non-urban areas do not change. The reference output binary variable is com- pared with the predicted output of SHEB and Globalall models. Each set of predictor values is inserted into the decision tree, which is produced using the regression tree option in Matlab, and a corresponding response value is predicted. Because the reference response variable con- tains only two numeric values, 0 and 1, the correspond- ing predicted outpu t is a contin uou s variable with a rang e between 0 and 1, indicating the probability for change. The closer the probability to 1, the more likely C opyright © 2011 SciRes. JGIS 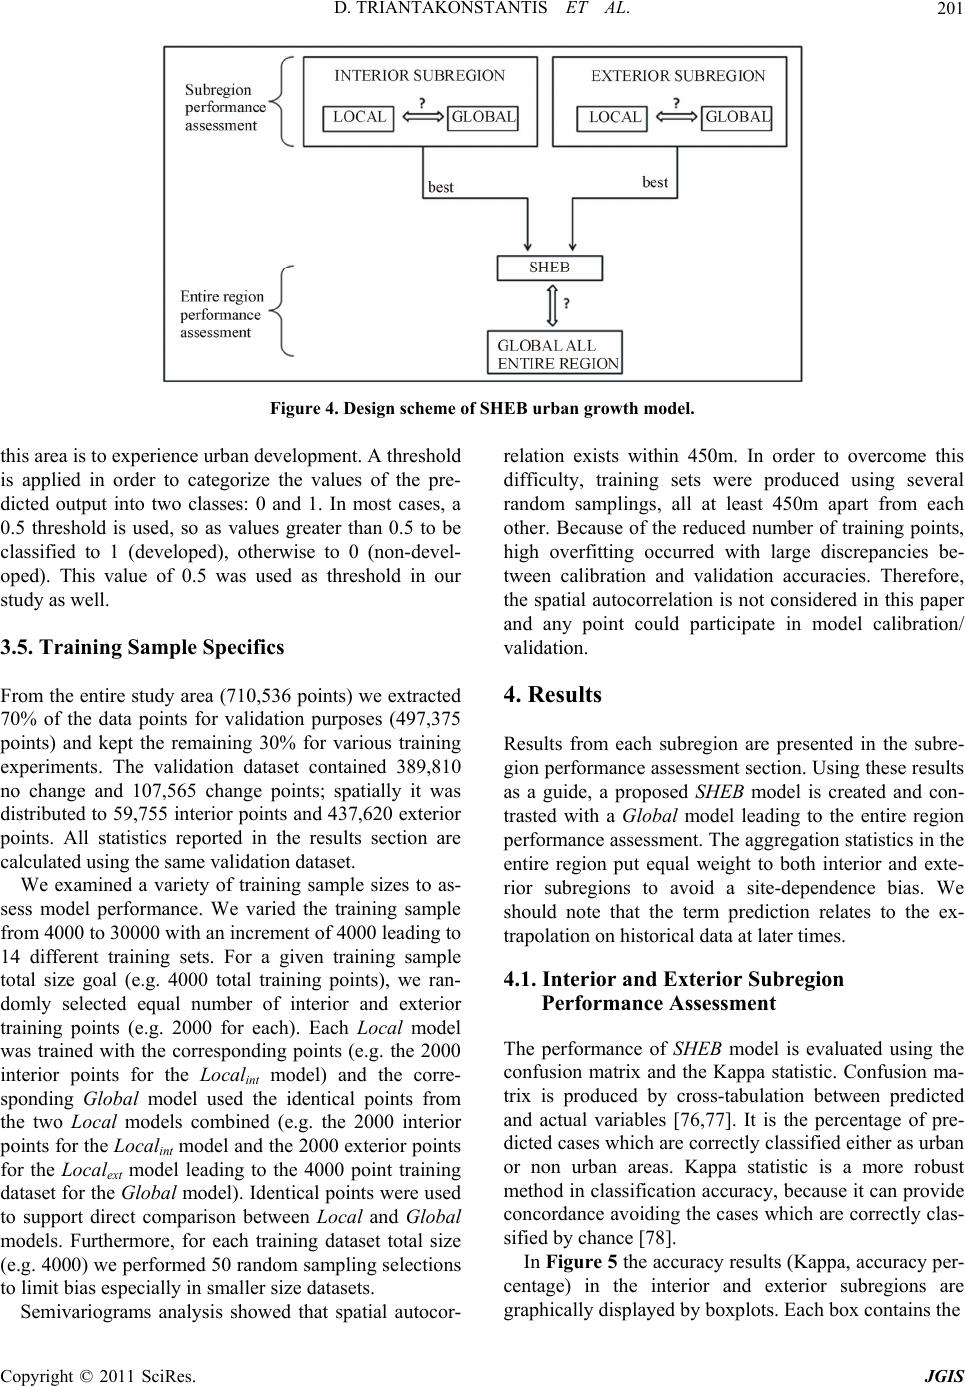 D. TRIANTAKONSTANTIS ET AL. 201 Figure 4. Design scheme of SHEB urban growth model. this area is to experience urban development. A threshold is applied in order to categorize the values of the pre- dicted output into two classes: 0 and 1. In most cases, a 0.5 threshold is used, so as values greater than 0.5 to be classified to 1 (developed), otherwise to 0 (non-devel- oped). This value of 0.5 was used as threshold in our study as well. 3.5. Training Sample Specifics From the entire study area (710,536 points) we extracted 70% of the data points for validation purposes (497,375 points) and kept the remaining 30% for various training experiments. The validation dataset contained 389,810 no change and 107,565 change points; spatially it was distributed to 59,7 55 interior points and 437,620 ex terior points. All statistics reported in the results section are calculated using the same validation dataset. We examined a variety of training sample sizes to as- sess model performance. We varied the training sample from 4000 to 30000 with an increment of 4000 leading to 14 different training sets. For a given training sample total size goal (e.g. 4000 total training points), we ran- domly selected equal number of interior and exterior training points (e.g. 2000 for each). Each Local model was trained with the corresponding points (e.g. the 2000 interior points for the Localint model) and the corre- sponding Global model used the identical points from the two Local models combined (e.g. the 2000 interior points for the Localint model and the 2000 exterior po ints for the Localext model leading to the 4000 point training dataset for the Global model). Identical points were used to support direct comparison between Local and Global models. Furthermore, for each training dataset total size (e.g. 4000) we performed 50 random sampling selections to limit bias especially in smaller size datasets. Semivariograms analysis showed that spatial autocor- relation exists within 450m. In order to overcome this difficulty, training sets were produced using several random samplings, all at least 450m apart from each other. Because of the reduced number of training points, high overfitting occurred with large discrepancies be- tween calibration and validation accuracies. Therefore, the spatial autocorrelation is not considered in this paper and any point could participate in model calibration/ validation. 4. Results Results from each subregion are presented in the subre- gion performance assessment section. Using these results as a guide, a proposed SHEB model is created and con- trasted with a Global model leading to the entire region performance assessment. The aggregation statistics in the entire region put equal weight to both interior and exte- rior subregions to avoid a site-dependence bias. We should note that the term prediction relates to the ex- trapolation on historical data at later times. 4.1. Interior and Exterior Subregion Performance Assessment The performance of SHEB model is evaluated using the confusion matrix and the Kappa statistic. Confusion ma- trix is produced by cross-tabulation between predicted and actual variables [76,77]. It is the percentage of pre- dicted cases which are correctly classified either as urban or non urban areas. Kappa statistic is a more robust method in classification accuracy, because it can provide concordance avoiding the cases which are correctly clas- sified by chance [78]. In Figure 5 the accuracy results (Kappa, accuracy per- centage) in the interior and exterior subregions are graphically displayed by boxplots. Each box contains the C opyright © 2011 SciRes. JGIS 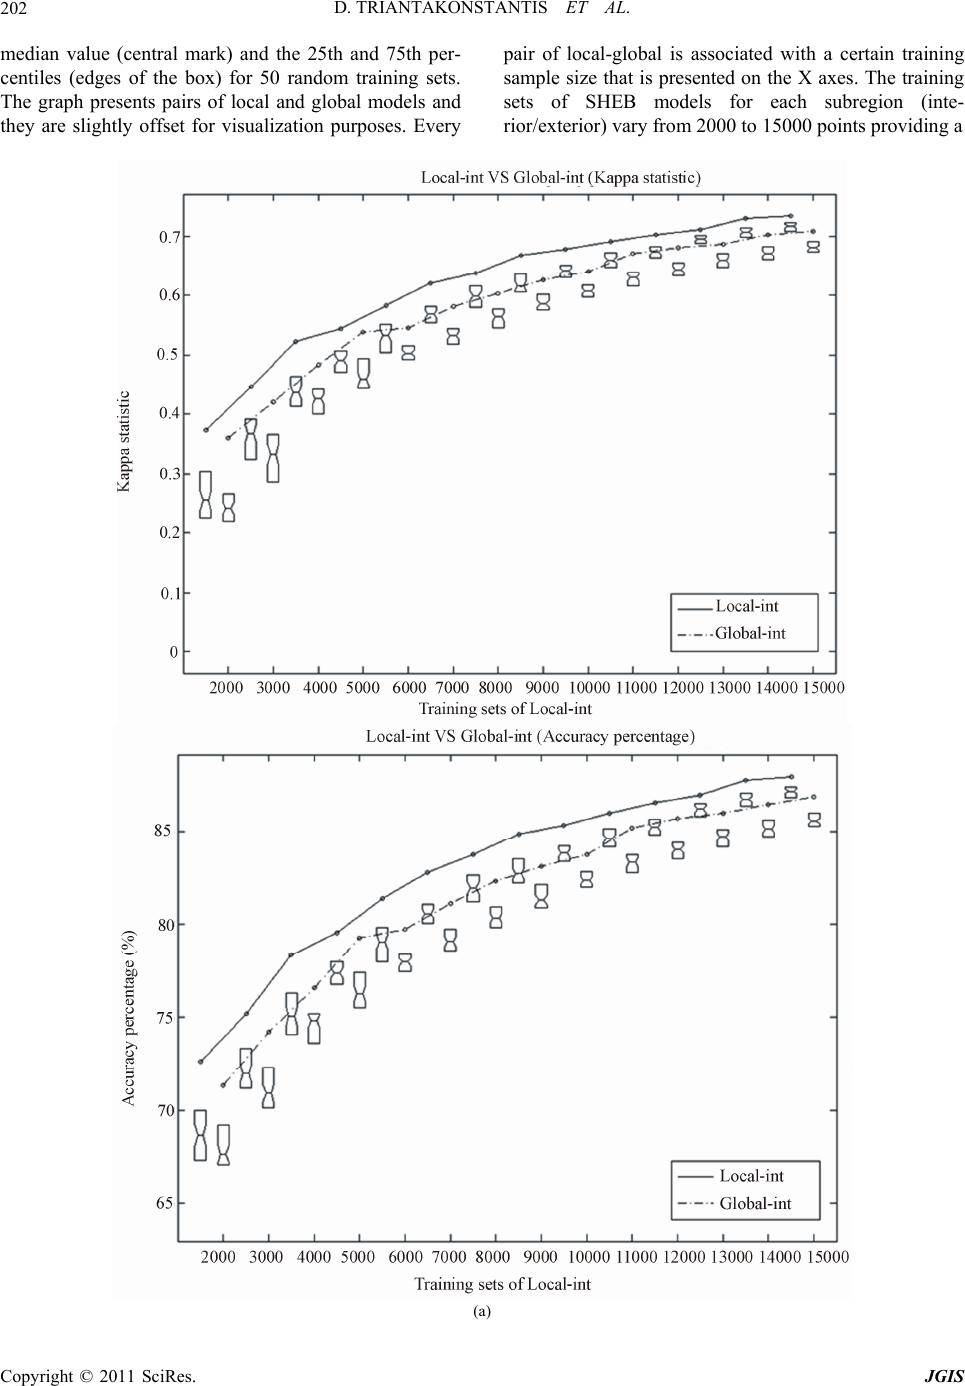 D. TRIANTAKONSTANTIS ET AL. 202 median value (central mark) and the 25th and 75th per- centiles (edges of the box) for 50 random training sets. The graph presents pairs of local and global models and they are slightly offset for visualization purposes. Every pair of local-global is associated with a certain training sample size that is presented on the X axes. The training sets of SHEB models for each subregion (inte- rior/exter ior) vary from 2000 to 15000 points providing a (a) Copyright © 2011 SciRes. JGIS 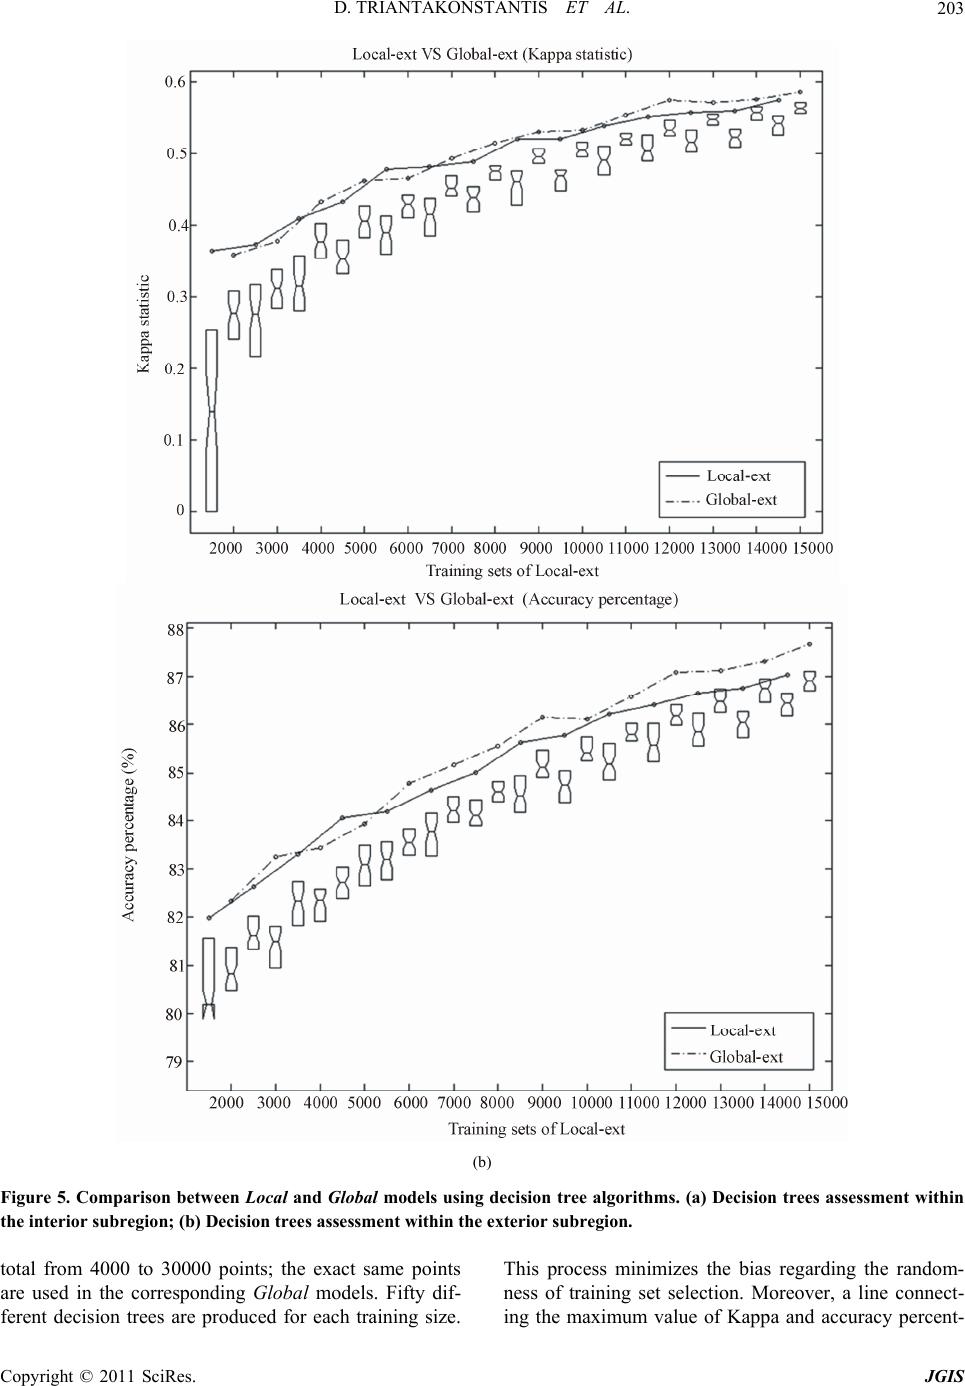 D. TRIANTAKONSTANTIS ET AL.203 (b) Figure 5. Comparison between Local and Global models using decision tree algorithms. (a) Decision trees assessment within the interior subregion; (b) Decision trees assessment within the exterior subregion. total from 4000 to 30000 points; the exact same points are used in the corresponding Global models. Fifty dif- ferent decision trees are produced for each training size. This process minimizes the bias regarding the random- ness of training set selection. Moreover, a line connect- ing the maximum value of Kappa and accuracy percent- Copyright © 2011 SciRes. JGIS  D. TRIANTAKONSTANTIS ET AL. 204 age for each training size is drawn. The comparison within the interior subregion using models Localint and Globalint for both Kappa and accu- racy percentage in different training sizes is given in Figure 5(a). The comparison in the exterior subregion between Localext and Globalext is presented in Figure 5(b). In the interior subregion, the Localint model exhibits significant improvements over the Globalint, while the results for the exterior subregion do not show sign ificant differe nc es b etween the Localext and Globalext models. 4.2. Entire Region Performance Assessment 4.2.1. Singl e Pixel Assessme nt Using the subregion performance assessment we fuse the Local Interior model (Localint) with the Global Exterior model (Globalext) to formulate the proposed SHEB model. The SHEB is then compared to a decision tree-based Global model (Globalall) operating on the entire study area. Since both SHEB and Global model use the same model to classify points in the exterior subregion, algo- rithmic improvements are due to any performance differ- ences in the interior subregion. W e average improveme nt s over both regions to produce the overall accuracy and Kappa statistics comparisons of Figure 6. It is worth mentioning t hat i n decisi on t ree grap hs (Figures 5 and 6), both Kappa and accuracy percentage are sensitive to the number of training points, as expected. In order to ex- amine the significance of Kappa statistic as well as the accuracy percentage in the two pairwise comparisons (SHEB VS Globalall), a paired Student’s t-test is carried out. The comparison aggregates differences between the best two models for each training dataset size. This test is used to investigate performance relationship between two models, without considering any one-to-one corre- spondence between poin ts belonging into the same group. According to Table 1, SHEB model differences from the Global model in terms of both Kappa and accuracy per- centages are statistically significant (a=0.05). In addition, the negative t values for the exterior subregio n justify the selection of the Global over the Local model to partici- pate in the SHEB model. 4.2.2. Neig hborhood Asses sment The above accuracy metrics are based on a pixel per pixel comparison between model output and reference data. Multi-scale accuracies are also used to aggregate performance within a neighborhood moving away from individual pixels. The multi-scale accuracies capture the similarity of patterns providing an assessment in differ- ent resolutions. More specifically, the multi-scale accu- racy assesses the number of changes occurred in a speci- fied window versus the actual number of changes with- out taking into account the exact spatial specificity of these changes as long as they take place within a local neighborhood. This assessment technique is important and beneficial for potential users such as policy makers and planners, where algorithmic performance in a given window (e.g. a 1 mile block) is more desirable rather than the actual locations of urban sprawl within that neighborhood. The calculation is defined by the follow- ing form ul a [79]. , , 1, , 1id nid iid id mm M Fn where ,id is the accuracy of the pixel i in a window with d diameter size of the circular window within which the accuracy is calculated, is the actual changes occurred in d, ,id m ,id m is the predicted changes in d, ,id is the total valid pixels (excluding the existing urban de- veloped pix els in 1977) in the examined window and n is the total population of pixels. In Figure 7, the graphs of multi-scale accuracies are presented using the training sets of 4000, 16000 and 30000 points for both SHEB and Globalall models. For each training size test, the best algorithm of the 50 deci- sion trees was selected in order to calculate the multi-scale accuracies. The size of neighborhood ranges from 3x3 to 70x70 pixels (90m to 2100m). The fusion between Localint and Globalext (SHEB model) offers in- creased accuracy when compared to the Globalall model. For example, at the 1km scale, a representative planning scale for the urban community, accuracy improvement varies from 1% to 3%. Most importantly, improvements are more significant for smaller training set sizes, which makes the proposed method even more appealing con- sidering that data availability is a typical limitation in such models. 5. Discussion and Conclusions A Spatially Heterogeneous Expert Based (SHEB) model, which addresses spatial heterogeneity using multiple region-specific models, is introduced in this research. Our hypothesis investigates whether expert knowledge improves prediction accuracy through model regionali- zation, in other words whether the integration of different models in homogeneous local subregions outperforms a global model trained in the entire study area. Most simi- lar studies capture the spatial heterogeneity using the differentiated factor, the factor which describes this dis- similarity, as an additional term to a global model ap- plied in the entire study area. In contrast, the SHEB model uses this expert knowledge prior to the model ap- Copyright © 2011 SciRes. JGIS 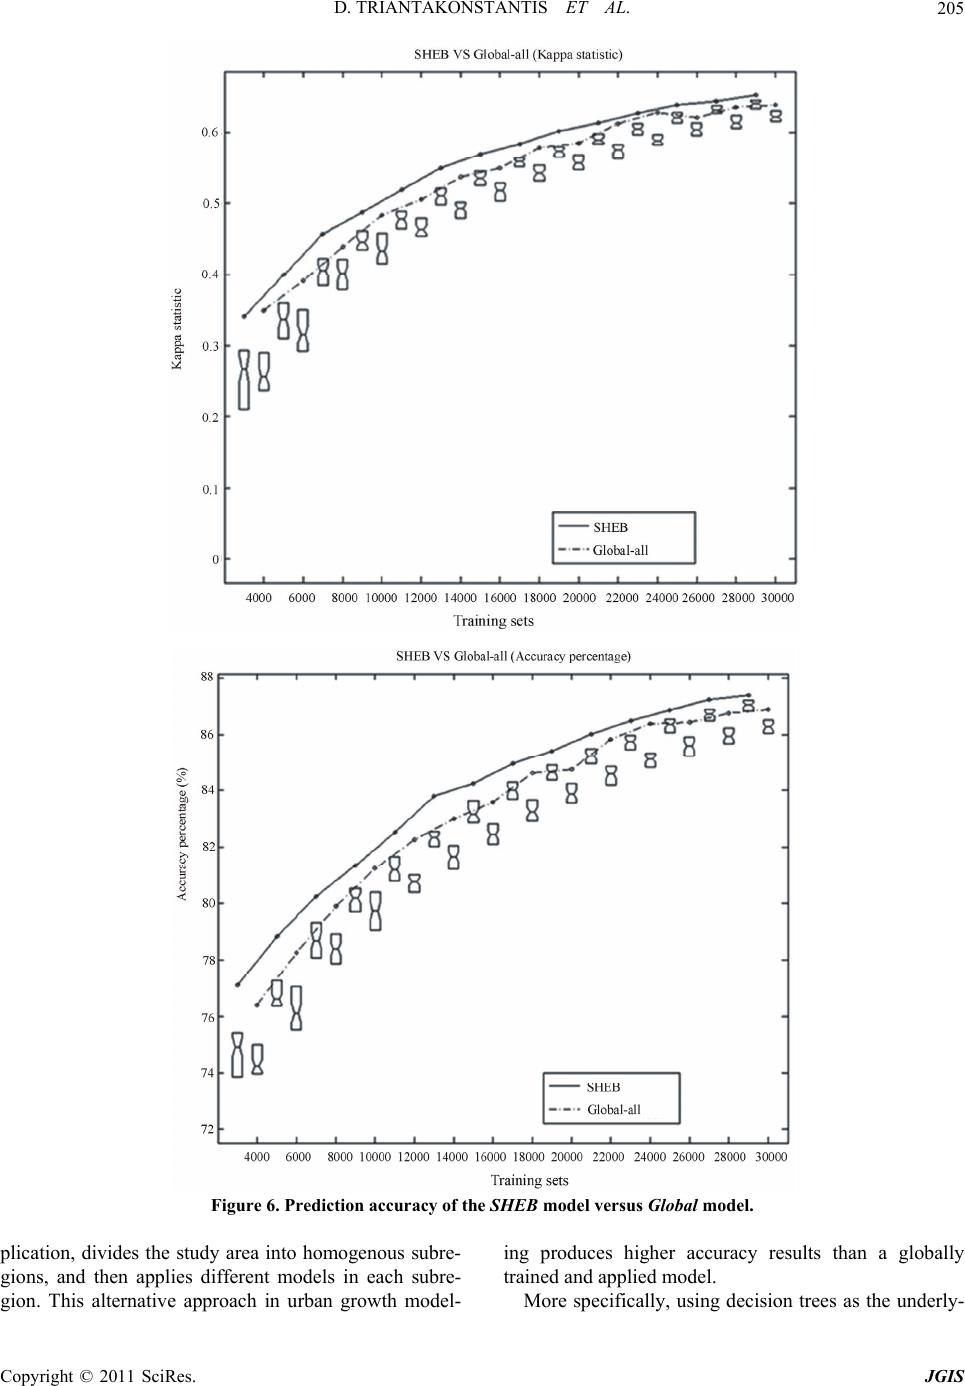 D. TRIANTAKONSTANTIS ET AL. 205 Figure 6. Prediction accuracy of the SHEB model versus Global model. plication, divides the study area into homogenous subre- gions, and then applies different models in each subre- gion. This alternative approach in urban growth model- ing produces higher accuracy results than a globally trained and applied model. More specifically, using decision trees as the underly- C opyright © 2011 SciRes. JGIS 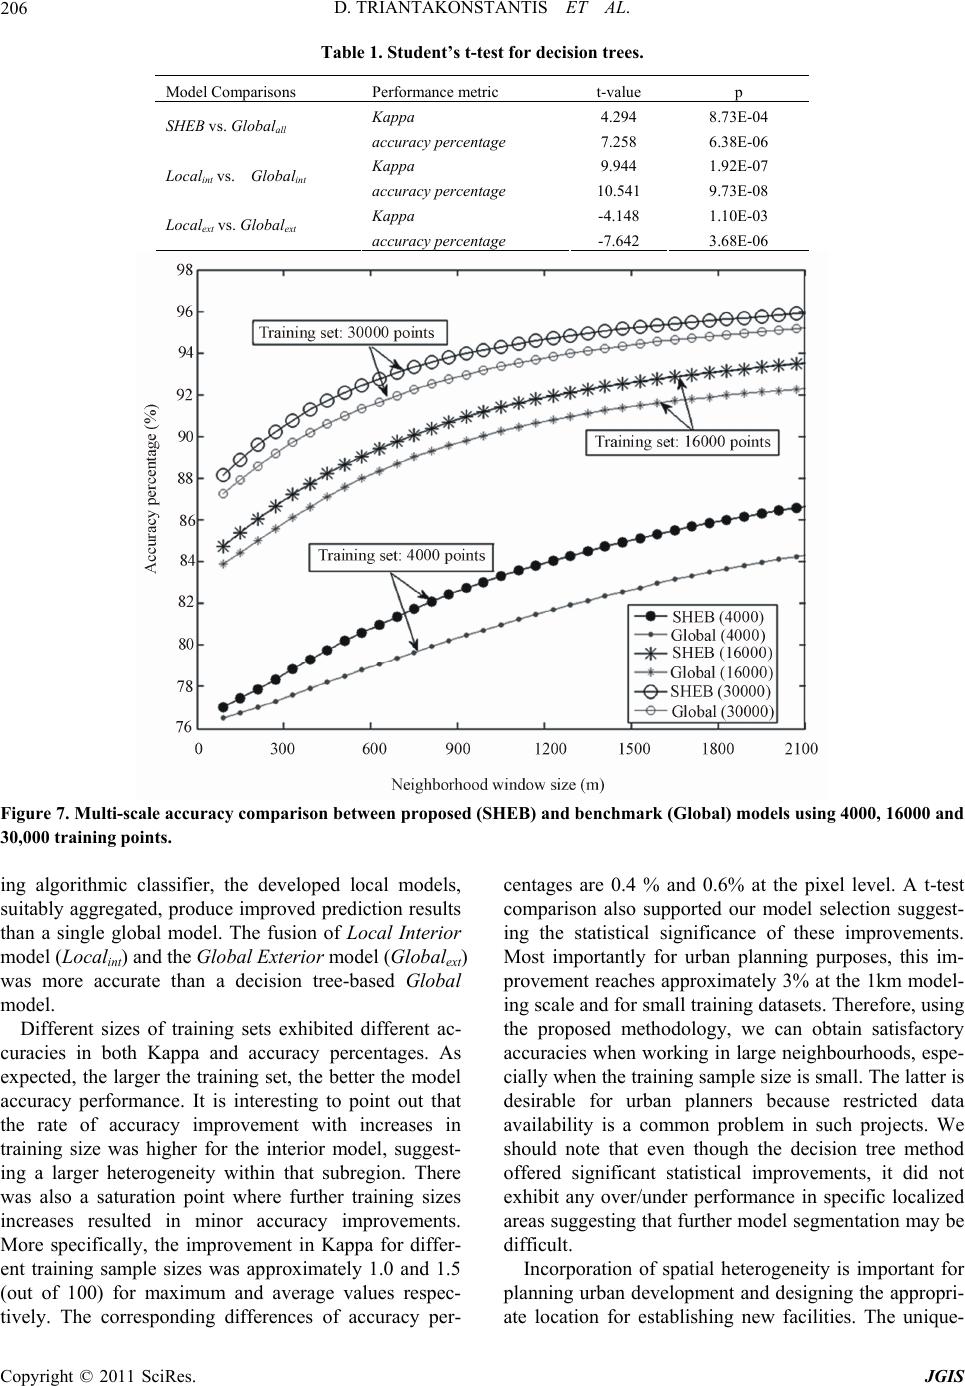 D. TRIANTAKONSTANTIS ET AL. 206 Table 1. Student’s t-test for decision trees. Model Comparisons Performance metric t-value p Kappa 4.294 8.73E-04 SHEB vs. Globalall accuracy percentage 7.258 6.38E-06 Kappa 9.944 1.92E-07 Localint vs. Globalint accuracy percentage 10.541 9.73E-08 Kappa -4.148 1.10E-03 Localext vs. Globalext accuracy percentage -7.642 3.68E-06 Figure 7. Multi-scale accuracy comparison between proposed (SHEB) and benchmark (Global) models using 4000, 16000 and 30,000 training points. ing algorithmic classifier, the developed local models, suitably aggregated, produce improved prediction results than a single global model. The fusion of Local Interior model (Localint) and the Global Exterior model (Globalext) was more accurate than a decision tree-based Global model. Different sizes of training sets exhibited different ac- curacies in both Kappa and accuracy percentages. As expected, the larger the training set, the better the model accuracy performance. It is interesting to point out that the rate of accuracy improvement with increases in training size was higher for the interior model, suggest- ing a larger heterogeneity within that subregion. There was also a saturation point where further training sizes increases resulted in minor accuracy improvements. More specifically, the improvement in Kappa for differ- ent training sample sizes was approximately 1.0 and 1.5 (out of 100) for maximum and average values respec- tively. The corresponding differences of accuracy per- centages are 0.4 % and 0.6% at the pixel level. A t-test comparison also supported our model selection suggest- ing the statistical significance of these improvements. Most importantly for urban planning purposes, this im- provement reaches approximately 3% at the 1km model- ing scale and for small training datasets. Therefore, using the proposed methodology, we can obtain satisfactory accuracies when working in large neighbourhoods, espe- cially when the training sample size is small. The latter is desirable for urban planners because restricted data availability is a common problem in such projects. We should note that even though the decision tree method offered significant statistical improvements, it did not exhibit any over/under performance in specific localized areas suggesting that further model segmentation may be difficult. Incorporation of spatial heterogeneity is important for planning urban development and designing the appropri- ate location for establishing new facilities. The unique- C opyright © 2011 SciRes. JGIS  D. TRIANTAKONSTANTIS ET AL.207 ness of a subregion can be identified not only by charac- teristics on its spatial and morphological properties, but also based on socioeconomic factors which may be im- plicitly present in these spatial representations. An inter- esting future investigation could base model regionaliza- tion on socioeconomic and administrative variables. For example, different models could be based on governing units that inherently may behave differently. The local information can provide reliable modeling adaptability because expert knowledge can more easily be incorpo- rated in homogenous subregions rather than in the entire study area. The SHEB model can sufficiently support the applicability of different homogenous subregion extrac- tions, in order to handle the spatial heterogeneity. The usage of interior and exterior subregions in the present study acts as a proof of concept. In troducing further spa- tial heterogeneity into th e model could po tentially lead to further improvements in the prediction accuracy of urban development. 6. Acknowledgements This research was supported by the Nation al Aeronautics and Space Administration through an award for Dr. Mountrakis from the New Investigator Progra m (award # NNX08AR11G). 7. References [1] United Nations Population Fund, “State of the World Population 2007: Unleashing the Potential of Urban Growth,” United Nations Population Fund, United Na- tions Publications, 2007. [2] United Nations Population Fund, “The State of World Population,” United Nations Population Fund, United Nations Publications, 1999. [3] A. Rahman, Y. Kumar, S. Fazal and S. Bhaskaran, “Ur- banization and Quality of Urban Environment Using Remote Sensing and GIS Techniques in East Delhi-In- dia,” Journal of Geographic Information System, Vol. 3, No. 1, 2011, pp. 62-84. doi:10.4236/jgis.2011.31005 [4] R. M. Mendes and R. Lorandi, “Geospatial Analysis of Geotechnical Data Applied to Urban Infrastructure Plan- ning,” Journal of Geographic Information System, Vol. 2, No. 1, 2010, pp. 23-31. doi:10.4236/jgis.2010.21006 [5] H. Briassoulis, “Analysis of Land Use Change: Theoreti- cal and Modeling Approaches,” West Virginia University: Regional Research Institute, Morgantown, 2000. http://www.rri.wvu.edu/WebBook/Briassoulis/contents.ht m [6] J. I. Barredo, M. Kasanko, N. Mccormick and C. Lavalle, “Modelling Dynamic Spatial Processes: Simulation of Urban Future Scenarios through Cellular Automata,” Landscape and Urban Planning, Vol. 64, No. 3, 2003, pp.145-160. doi:10.1016/S0169-2046(02)00218-9 [7] Veldkamp and P. H. Verburg, “Modelling Land Use Change and Environmental Impact,” Journal of environ- mental management, Vol. 72, No. 1-2, 2004, pp. 1-3. doi:10.1016/j.jenvman.2004.04.004 [8] M. Batty, “Agents, Cells, and Cities: New Representa- tional Models for Simulating Multiscale Urban Dynam- ics,” Environment and Planning A, Vol. 37, No. 8, 2005, pp. 1373-1394. doi:10.1068/a3784 [9] P. H. Verburg and A. Veldkamp, “Introduction to the Special Issue on Spatial Modeling to Explore Land Use Dynamics,” International Journal of Geographical In- formation Science, Vol. 19, No. 2, 2005, pp. 99-102. doi:10.1080/13658810410001713362 [10] J. Wu and R. Hobbs, “Key Issues and Research Priorities in Landscape Ecology: An Idiosyncratic Synthesis,” Landscape Ecology, Vol. 17, No. 4, 2002, pp. 355-365. doi:10.1023/A:1020561630963 [11] E. G. Irwin, “New Directions for Urban Economic Mod- els of Land Use Change: Incorporating Spatial Dynamics and Heterogeneity,” Journal of Regional Science, Vol. 50, No. 1, 2010, pp. 65-91. doi:10.1111/j.1467-9787.2009.00655.x [12] J. R. Eastman, L. A. Solorzano and M. E. Van Fossen, “Transition Potential Modeling for Land-Cover Change,” In: D. J. Maguire, M. Batty and M. F. Goodchild, Eds., GIS, Spatial Analysis, and Modeling, ESRI Press, Red- lands, 2005, pp. 357-385. [13] J. R. Eastman, “Idrisi Kilimanjaro, Manual,” Clark Labs, Clark University, Worcester, 2003. [14] R. Aspinall, “Modelling Land Use Change with General- ized Linear Models—A Multi-Model Analysis of Change between 1860 and 2000 in Gallatin Valley, Montana,” Journal of environmental management, Vol. 72, No. 1-2, 2004, pp. 91-103. doi:10.1016/j.jenvman.2004.02.009 [15] Sebastian-Lopez, R. Salvador-Civil, J. Gonzalo-Jimenez and J. Sanmiguel-Ayanz, “Integration of Socio-Economic and Environmental Variables for Modelling Long-Term Fire Danger in Southern Europe,” European Journal of Forest Research, Vol. 127, No. 2, 2008, pp. 149-163. doi:10.1007/s10342-007-0191-5 [16] J. Allen and K. Lu, “Modeling and Prediction of Future Urban Growth in the Charleston Region of South Caro- lina: A GIS-Based Integrated Approach,” Ecology and Society, Vol. 8, No. 2, 2003, p. 2. [17] P. H. Verburg, T. C. M. De Nijs, J. Ritsema Van Eck, H. Visser and K. De Jong, “A Method to Analyse Neigh- bourhood Characteristics of land Use Patterns,” Com- puters, Environment and Urban Systems, Vol. 28, No. 6, 2004, pp. 667-690. doi:10.1016/j.compenvurbsys.2003.07.001 [18] Z. Hu and C. P. Lo, “Modeling Urban Growth in Atlanta Using Logistic Regression,” Computers, Environment and Urban Systems, Vol. 31, No. 6, 2007, pp. 667-688. doi:10.1016/j.compenvurbsys.2006.11.001 [19] B. Huang, L. Zhang and B. Wu, “Spatiotemporal Analy- sis of Rural-Urban Land Conversion,” International Jour- nal of Geographical Information Science, Vol. 23, No. 3, Copyright © 2011 SciRes. JGIS  D. TRIANTAKONSTANTIS ET AL. 208 2009, pp. 379-398. doi:10.1080/13658810802119685 [20] N. H. Augustin, M. A. Mugglestone and S. T. Buckland, “An Autologistic Model for the Spatial Distribution of Wildlife,” Journal of Applied Ecology, Vol. 33, No. 2, 1996, pp. 339-347. doi:10.2307/2404755 [21] K. P. Overmars, G. H. J. De Koning and A. Veldkamp, “Spatial Autocorrelation in Multi-Scale Land Use Mod- els,” Ecological Modelling, Vol. 164, No. 2-3, 2003, pp. 257-270. doi:10.1016/S0304-3800(03)00070-X [22] C. F. Dormann, “Assessing the Validity of Autologistic Regression,” Ecological Modelling, Vol. 207, No. 2-4, 2007, pp. 234-242. doi:10.1016/j.ecolmodel.2007.05.002 [23] Getis and D. A. Griffith, “Comparative Spatial Filtering in Regression Analysis,” Geographical Analysis, Vol. 34, No. 2, 2002, pp. 130-140. [24] J. Malczewski, “Ordered Weighted Averaging with Fuzzy Quantifiers: GIS-Based Multicriteria Evaluation for Land-Use Suitability Analysis,” International Journal of Applied Earth Observation and Geoinformation, Vol. 8, No. 4, 2006, pp. 270-277. doi:10.1016/j.jag.2006.01.003 [25] Gemitzi, V. A. Tsihrintzis, E. Voudrias, C. Petalas and G. Stravodimos, “Combining Geographic Information Sys- tem, Multicriteria Evaluation Techniques and Fuzzy Logic in Siting MSW Landfills,” Environmental Geology, Vol. 51, No. 5, 2007, pp. 797-811. doi:10.1007/s00254-006-0359-1 [26] M. Zarghami and F. Szidarovszky, “Fuzzy Quantifiers in Sensitivity Analysis of OWA Operator,” Computers and Industrial Engineering, Vol. 54, No. 4, 2008, pp. 1006-1018. doi:10.1016/j.cie.2007.11.012 [27] Q. Yang, X. Li and X. Shi, “Cellular Automata for Simu- lating Land Use Changes Based on Support Vector Ma- chines,” Computers and Geosciences, Vol. 34, No. 6, 2008, pp. 592-602. doi:10.1016/j.cageo.2007.08.003 [28] C. Huang, K. Song, S. Kim, J. R. G. Townshend and P. Davis, “Use of a Dark Object Concept and Support Vec- tor Machines to Automate Forest Cover Change Analy- sis,” Remote Sensing of Environment, Vol. 112, No. 3, 2008, pp. 970-985. doi:10.1016/j.rse.2007.07.023 [29] T. Kuemmerle, P. Hostert, V. C. Radeloff, S. Van der Linden and K. Perzanowski, “Cross-Border Comparison of Post-Socialist Farmland Abandonment in the Carpa- thians,” Ecosystems, Vol. 11, No. 4, 2008, pp. 614-628. doi:10.1007/s10021-008-9146-z [30] D. E. Goldberg, “Neighborhood Competition in an Old-Field Plant Community,” Ecology, Vol. 68, No. 5, 1987, pp. 1211-1223. doi:10.2307/1939205 [31] P. J. Burton, “Some Limitations Inherent to Static Indices of Plant Competition,” Canadian Journal of Forest Re- search, Vol. 23, No. 10, 1993, pp. 2141-2152. doi:10.1139/x93-267 [32] W. D'amato and K. J. Puettmann, “The Relative Domi- nance Hypothesis Explains Interaction Dynamics in Mixed Species Alnus Rubra/Pseudotsuga Menziesii Stands,” Journal of Ecology, Vol. 92, No. 3, 2004, pp. 450-463. doi:10.1111/j.0022-0477.2004.00888.x [33] S. W. Simard and B. J. Zimonick, “Neighborhood Size Effects on Mortality, Growth and Crown Morphology of Paper Birch,” Forest Ecology and Management, Vol. 214, No. 1-3, 2005, pp. 251-265. doi:10.1016/j.foreco.2005.04.009 [34] C. He, N. Okada, Q. Zhang, P. Shi and J. Li, “Modelling Dynamic Urban Expansion Processes Incorporating a Potential Model with Cellular Automata,” Landscape and Urban Planning, Vol. 86, No. 1, 2008, pp. 79-91. doi:10.1016/j.landurbplan.2007.12.010 [35] S. J. Walsh, J. P. Messina, C. F. Mena, G. P. Malanson and P. H. Page, “Complexity Theory, Spatial Simulation Models, and Land Use Dynamics in the Northern Ecua- dorian Amazon,” Geoforum, Vol. 39, No. 2, 2008, pp. 867-878. doi:10.1016/j.geoforum.2007.02.011 [36] Menard and D. J. Marceau, “Simulating the Impact of Forest Management Scenarios in an Agricultural Land- scape of Southern Quebec, Canada, Using a Geographic Cellular Automata,” Landscape and Urban Planning, Vol. 79, No. 3-4, 2007, pp. 253-265. doi:10.1016/j.landurbplan.2006.02.016 [37] H. Couclelis, “From Cellular Automata to Urban Models: New Principles for Model Development and Implementa- tion,” Environment and Planning B: Planning and Design, Vol. 24, No. 2, 1997, pp. 165-174. doi:10.1068/b240165 [38] R. White and G. Engelen, “High-Resolution Integrated Modelling of the Spatial Dynamics of Urban and Re- gional Systems,” Computers, Environment and Urban Systems, Vol. 24, No. 5, 2000, pp. 383-400. doi:10.1016/S0198-9715(00)00012-0 [39] X. Liu, X. Li, L. Liu, J. He and B. Ai, “A Bottom-Up Approach to Discover Transition Rules of Cellular Auto- mata Using Ant Intelligence,” International Journal of Geographical Information Science, Vol. 22, No. 11-12, 2008, pp. 1247-1269. doi:10.1080/13658810701757510 [40] J. V. Vliet, R. White and S. Dragicevic, “Modeling Urban Growth Using a Variable Grid Cellular Automaton,” Computers, Environment and Urban Systems, Vol. 33, No. 1, 2009, pp. 35-43. doi:10.1016/j.compenvurbsys.2008.06.006 [41] F. Del Frate, F. Pacifici, G. Schiavon and C. Solimini, “Use of Neural Networks for Automatic Classification from High-Resolution Images,” IEEE Transactions on Geoscience and Remote Sensing, Vol. 45, No. 4, 2007, pp. 800-809. doi:10.1109/TGRS.2007.892009 [42] M. J. Canty, “Boosting a Fast Neural Network for Super- vised Land Cover Classification,” Computers and Geo- sciences, Vol. 35, No. 6, 2009, pp. 1280-1295. doi:10.1016/j.cageo.2008.07.004 [43] T. Kavzoglu, “Increasing the Accuracy of Neural Net- work Classification Using Refined Training Data,” Envi- ronmental Modelling Software, Vol. 24, No. 7, 2009, pp. 850. doi:10.1016/j.envsoft.2008.11.012 [44] JR. R. G. Pontius, W. Boersma, J. Castella, K. Clarke and T. Nijs, “Comparing the input, output, and Validation Maps for Several Models of Land Change,” Annals of Regional Science, Vol. 42, No. 1, 2008, pp. 11-37. doi:10.1007/s00168-007-0138-2 Copyright © 2011 SciRes. JGIS  D. TRIANTAKONSTANTIS ET AL.209 [45] T. Lakes, D. Muller and C. Kruger, “Cropland Change in Southern Romania: A Comparison of Logistic Regres- sions and Artificial Neural Networks,” Landscape Ecol- ogy, Vol. 24, No. 9, 2009, pp. 1195-1206. doi:10.1007/s10980-009-9404-2 [46] B. C. Pijanowski, A. Tayyebi, M. R. Delavar and M. J. Yazdanpanah, “Urban Expansion Simulation Using Geo- spatial Information System and Artificial Neural Net- works,” International Journal of Environmental Research, Vol. 3, No. 4, 2009, pp. 493-502. [47] B. C. Pijanowski, D. G. Brown, B. A. Shellito and G. A. Manik, “Using Neural Networks and GIS to Forecast Land Use Changes: A Land Transformation Model,” Computers, Environment and Urban Systems, Vol. 26, No. 6, 2002, pp. 553-575. doi:10.1016/S0198-9715(01)00015-1 [48] C. E. Rizkalla and R. K. Swihart, “Forecasting the Effects of Land-Use Change on Forest Rodents in Indiana,” En- vironmental Management, Vol. 44, No. 5, 2009, pp. 899-908. [49] W. Liu and K. C. Seto, “Using the ART-MMAP neural Network to Model and Predict Urban Growth: A Spatio- temporal Data Mining Approach,” Environment and Planning B: Planning and Design, Vol. 35, No. 2, 2008, pp. 296-317. doi:10.1068/b3312 [50] X. Li and A. G. Yeh, “Calibration of Cellular Automata by Using Neural Networks for the Simulation of Com- plex Urban Systems,” Environment and Planning A, Vol. 33, No. 8, 2001, pp. 1445-1462. doi:10.1068/a33210 [51] Y. Mahajan and P. Venkatachalam, “Neural Network Based Cellular Automata Model for Dynamic Spatial Modeling in GIS,” Lecture Notes in Computer Science (Including Subseries Lecture Notes in Artificial Intelli- gence and Lecture Notes in Bioinformatics), Vol. 5592, Part 1, 2009, pp. 341-352. [52] B. C. Pijanowski, S. Pithadia, B. A. Shellito and K. Al- exandridis, “Calibrating a Neural Network-Based Urban Change Model for Two Metropolitan Areas of the Upper Midwest of the United States,” International Journal of Geographical Information Science, Vol. 19, No. 2, 2005, pp. 97-215. doi:10.1080/13658810410001713416 [53] Q. Guan, L. Wang and K. C. Clarke, “An Artificial- Neural-Network-Based, Constrained CA Model for Si- mulating Urban Growth,” Cartography and Geographic Information Science, Vol. 32, No. 4, 2005, pp. 369-380. doi:10.1559/152304005775194746 [54] C. M. Almeida, J. M. Gleriani, E. F. Castejon and B. S. Soares-Filho, “Using Neural Networks and Cellular Automata for Modelling Intra-Urban Land-Use Dynam- ics,” International Journal of Geographical Information Science, Vol. 22, No. 9, 2008, pp. 943-963. [55] J. C. Chan, K. Chan and A. G. Yeh, “Detecting the Na- ture of Change in an Urban Environment: A Comparison of Machine Learning Algorithms,” Photogrammetric En- gineering and Remote Sensing, Vol. 67, No. 2, 2001, pp. 213-225. [56] X. Li and C. Claramunt, “A Spatial Entropy-Based Deci- sion Tree for Classification of Geographical Informa- tion,” Transactions in GIS, Vol. 10, No. 3, 2006, pp. 451-467. doi:10.1111/j.1467-9671.2006.01006.x [57] X. Liu, X. Li, X. Shi, S. Wu and T. Liu, “Simulating Complex Urban Development Using Kernel-Based Non- Linear Cellular Automata,” Ecological Modelling, Vol. 211, No. 1-2, 2008, pp. 169-181. doi:10.1016/j.ecolmodel.2007.08.024 [58] X. Li and A. G. Yeh, “Analyzing Spatial Restructuring of Land Use Patterns in a Fast Growing Region Using Re- mote Sensing and GIS,” Landscape and Urban Planning, Vol. 69, No. 4, 2004, pp. 335-354. doi:10.1016/j.landurbplan.2003.10.033 [59] S. E. Sesnie, P. E. Gessler, B. Finegan and S. Thessler, “Integrating Landsat TM and SRTM-DEM Derived Vari- ables with Decision Trees for Habitat Classification and Change Detection in Complex Neotropical Environ- ments,” Remote Sensing of Environment, Vol. 112, No. 5, 2008, pp. 2145-2159. doi:10.1016/j.rse.2007.08.025 [60] J. R. Quinlan, “Probabilistic Decision Tress,” In: K. Yves and R. Michalski, Eds., Machine Learning: An Artificial Intelligence Approach, Morgan Kaufmann, San Mateo, Vol. 3, 1983, pp. 140-152. [61] R. I. McDonald and D. L. Urban, “Spatially Varying Rules of Landscape Change: Lessons from a Case Study,” Landscape and Urban Planning, Vol. 74, No. 1, 2006, pp. 7-20. doi:10.1016/j.landurbplan.2004.08.005 [62] J. Liu and W. W. Taylor, “Integrating Landscape Ecology into Natural Resource Management,” Cambridge Univer- sity Press, Cambridge, 2002. doi:10.1017/CBO9780511613654 [63] D. G. Brown, S. Page, R. Riolo, M. Zellner and W. Rand, “Path Dependence and the Validation of Agent-Based Spatial Models of Land Use,” International Journal of Geographical Information Science, Vol. 19, No. 2, 2005, pp. 153-174. doi:10.1080/13658810410001713399 [64] J. Wang and G. Mountrakis, “Developing a Multi-Net- work Urbanization (MuNU) Model: A Case Study of Ur- ban Growth in Denver, Colorado,” International Journal of Geographical Information Science, Vol. 25, No. 2, 2011, pp. 229-253. doi:10.1080/13658810903473213 [65] M. Raty and A. Kangas, “Localizing General Models with Classification and Regression Trees,” Scandinavian Journal of Forest Research, Vol. 23, No. 5, 2008, pp. 419-430. doi:10.1080/02827580802378826 [66] M. Herold, H. Couclelis and K. C. Clarke, “The Role of Spatial Metrics in the Analysis and Modeling of Urban Land Use Change,” Computers, Environment and Urban Systems, Vol. 29, No. 4, 2005, pp. 369-399. doi:10.1016/j.compenvurbsys.2003.12.001 [67] L. Porter-Bolland, E. A. Ellis and H. L. Gholz, “Land Use Dynamics and Landscape History in La Montaña, Cam- peche, Mexico,” Landscape and Urban Planning, Vol. 82, No. 4, 2007, pp. 198-207. [68] J. S. Deng, K. Wang, Y, Hong and J. G. Qi, “Spatio- Temporal Dynamics and Evolution of Land Use Change and Landscape Pattern in Response to Rapid Urbaniza- tion,” Landscape and Urban Planning, Vol. 92, No. 3-4, 2009, pp. 187-198. Copyright © 2011 SciRes. JGIS  D. TRIANTAKONSTANTIS ET AL. Copyright © 2011 SciRes. JGIS 210 doi:10.1016/j.landurbplan.2009.05.001 [69] K. McGarigal, S. Tagil and S. A. Cushman, “Surface Metrics: An Alternative to Patch Metrics for the Quanti- fication of Landscape Structure,” Landscape Ecology, Vol. 24, No. 3, 2009, pp. 433-450. doi:10.1007/s10980-009-9327-y [70] D. Triantakonstantis and S. Barr, “A Spatial Structural and Statistical Approach to Building Classification of Residential Function for City-Scale Impact Assessment Studies,” Lecture Notes in Computer Science, Vol. 5592, 2009, pp. 221-236. doi:10.1007/978-3-642-02454-2_16 [71] Lagarias, “Fractal Analysis of the Urbanization at the Outskirts of the City: Models, Measurement and Expla- nation,” CyberGeo: European Journal of Geography, 2007, pp. 1-16. [72] S. Barr and M. Barnsley, “A Region-Based, Graph-Theo- retic Data Model for the Inference of Second-Order The- matic Information from Remotely-Sensed Images,” In- ternational Journal of Geographical Information Science, Vol. 11, No. 6, 1997, pp. 555-576. doi:10.1080/136588197242194 [73] K. Wu, N. Nunan, J. W. Crawford, I. M. Young and K. Ritz, “An Efficient Markov Chain Model for the Simula- tion of Heterogeneous Soil Structure,” Soil Science Soci- ety of America Journal, Vol. 68, No. 2. 2004, pp. 346-351. doi:10.2136/sssaj2004.0346 [74] J. Gong, Y. Liu and B. Xia, “Spatial Heterogeneity of Urban Land-Cover Landscape in Guangzhou from 1990 to 2005,” Journal of Geographical Sciences, Vol. 19, No. 2, 2009, pp. 213-224. doi:10.1007/s11442-009-0213-y [75] T. G. Wade, J. D. Wickham, N. Zacarelli and K. H. Riit- ters, “A Multi-Scale Method of Mapping Urban Influ- ence,” Environmental Modelling & Software, Vol. 24, No. 10, 2009, pp. 1252-1256. doi:10.1016/j.envsoft.2009.03.006 [76] M. Story and R. G. Congalton, “Accuracy Assessment: A User’s Perspective,” Photogrammetric Engineering and Remote Sensing, Vol. 52, No. 3, 1986, pp. 397-399. [77] R. G. Congalton, “A Review of Assessing the Accuracy of Classifications of Remotely Sensed Data,” Remote Sensing of Environment, Vol. 37, No. 1, 1991, pp. 35-46. doi:10.1016/0034-4257(91)90048-B [78] J. Cohen, “A Coefficient of Agreement for Nominal Scales,” Educational and Psychological Measurement, Vol. 20, No. 1, 1960, pp. 37–46. doi:10.1177/001316446002000104 [79] R. Costanza, “Model Goodness of Fit: A Multiple Reso- lution Procedure,” Ecological Modelling, Vol. 47, No. 3-4, 1989, pp. 199-215. doi:10.1016/0304-3800(89)90001-X
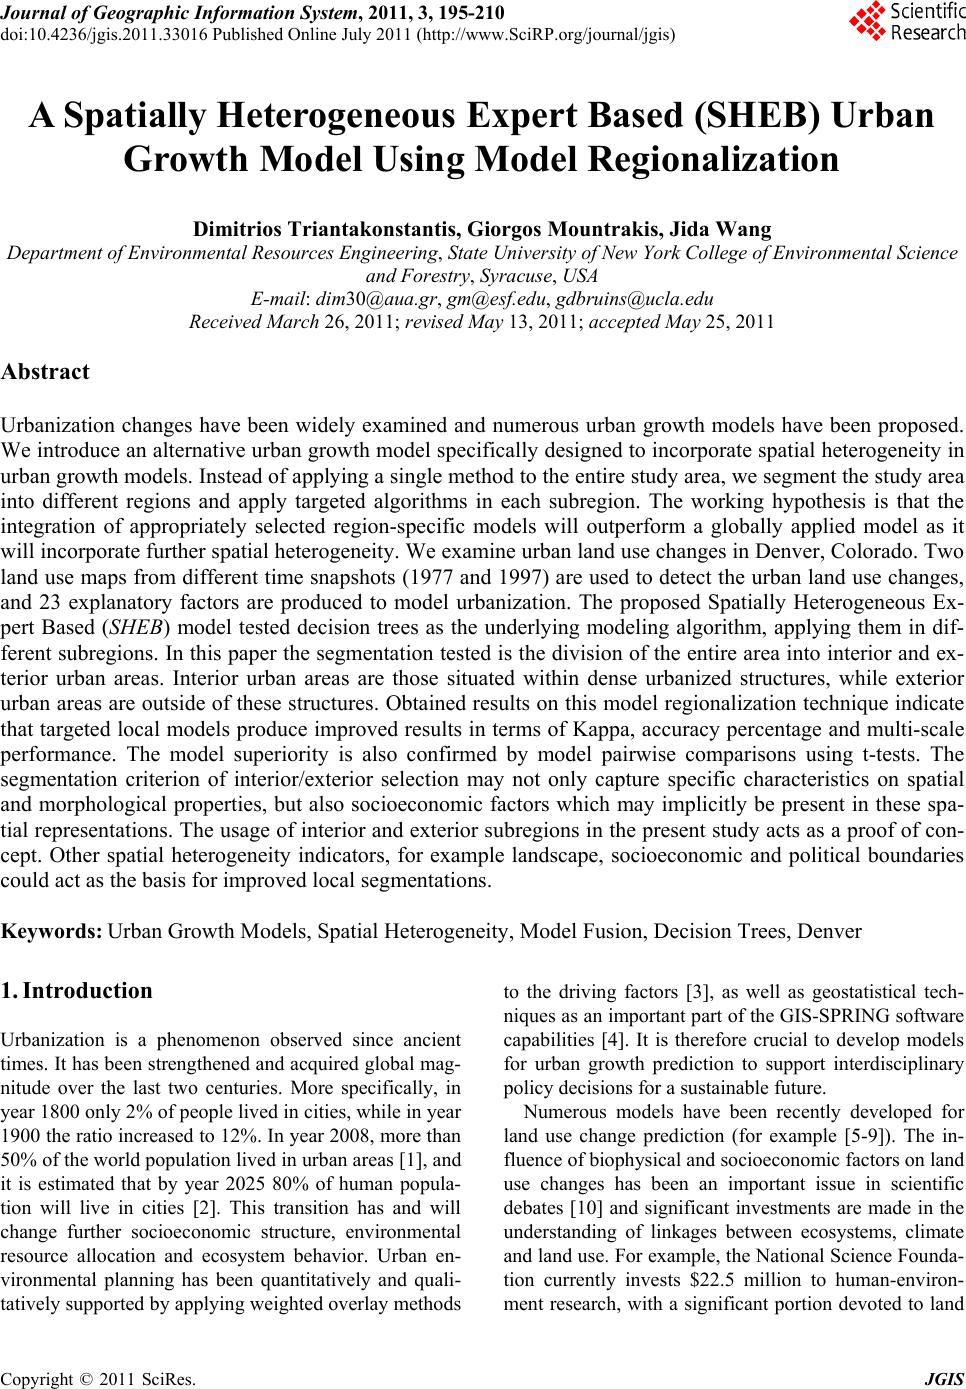
|