Influence of S Contents on the Hydrogen Blistering and Hydrogen Induced Cracking of A350LF2 Steel
918
polished and then the cross-sections were examined with
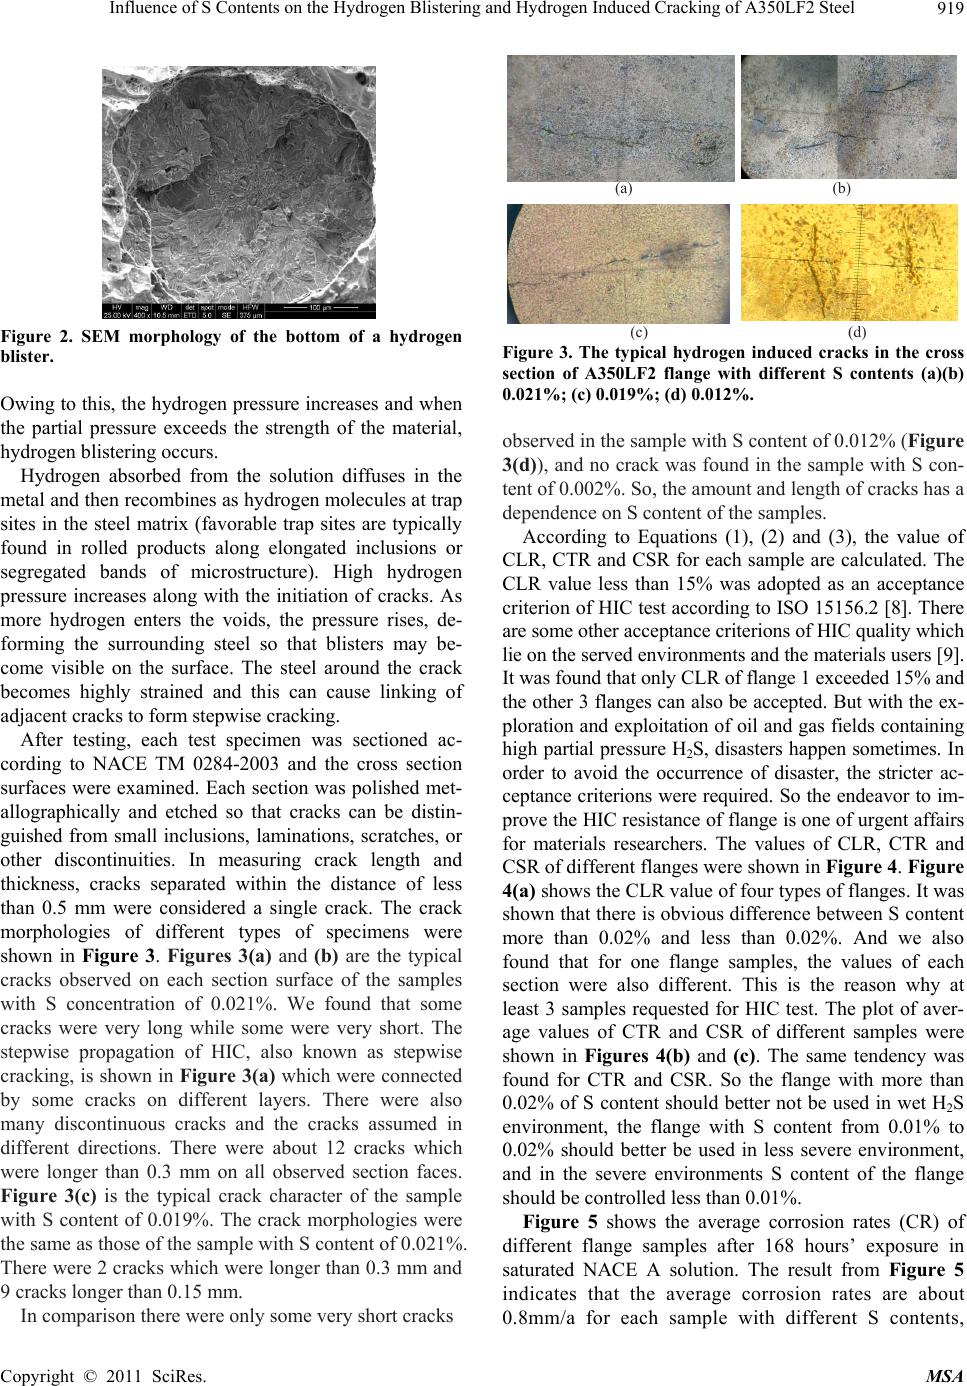
100X optical microscope (OM) after etched with solution
of a mixture of 4% nitric acid and ethanol. Three differ-
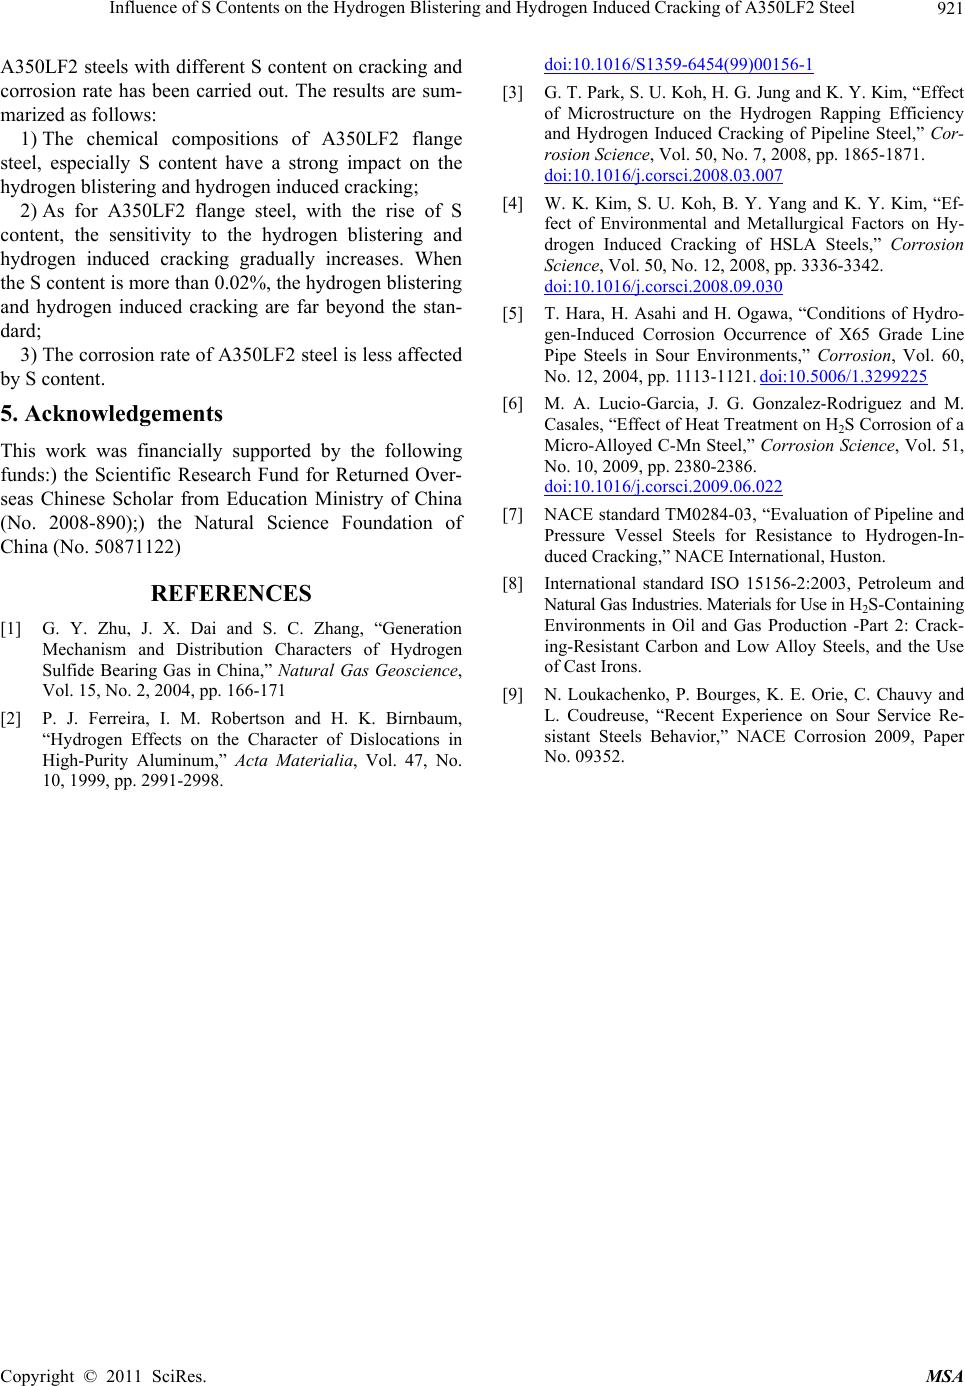
ent cracking parameters were measured:
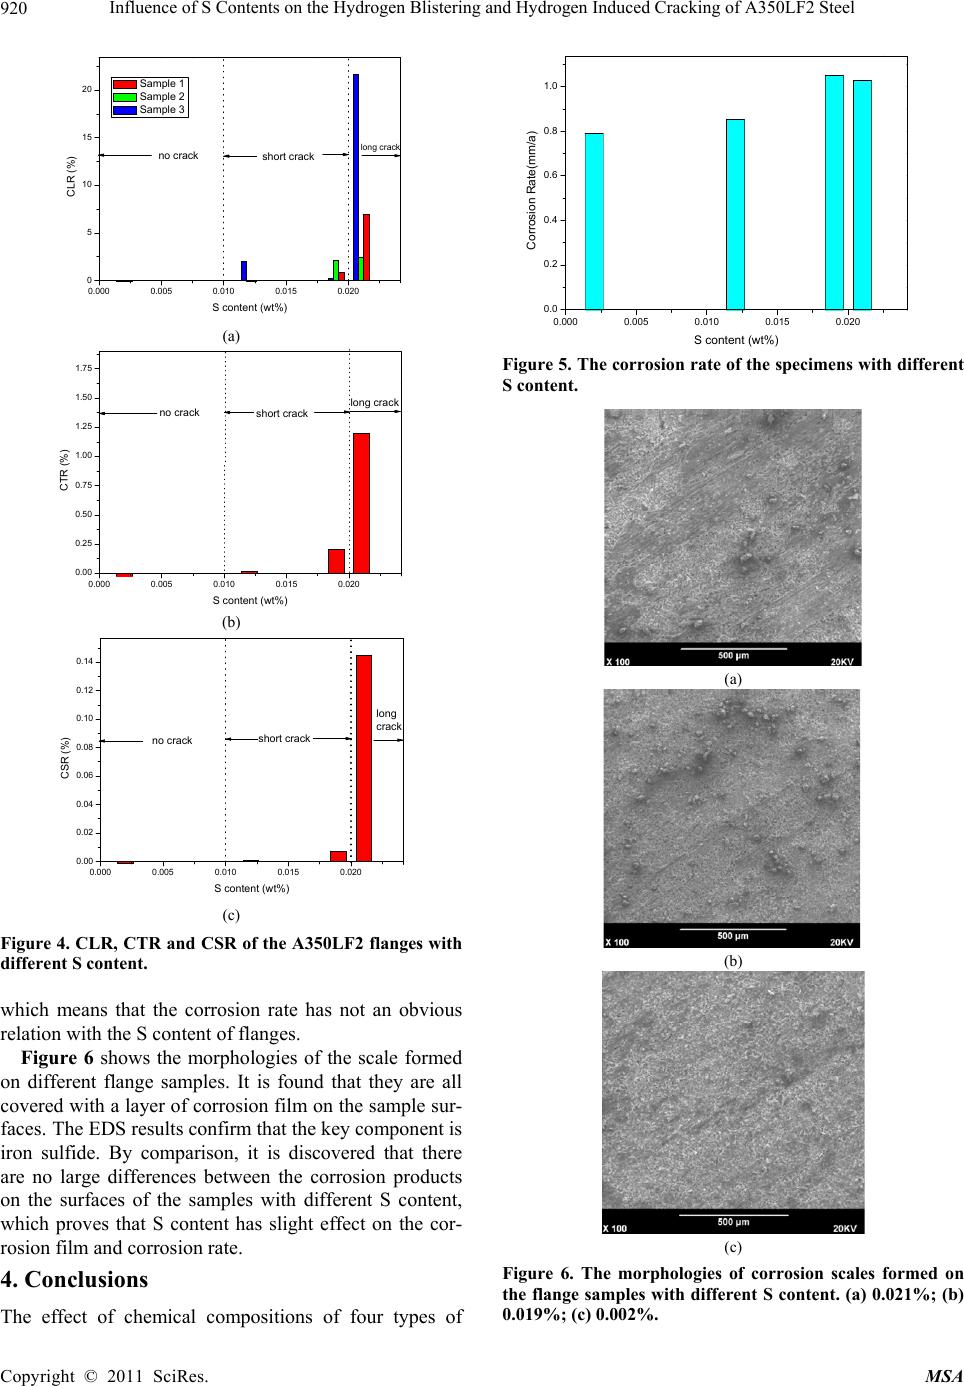
Crack Length Ratio (CLR) = a/W × 100% (1)
Crack Thickness Ratio (CTR) = b/T × 100% (2)
Crack Sensitivity Ratio (CSR) = (a × b)/(W × T) × 100%
(3)
where a is the crack length, b is the crack thickness, W is
the section width and T is the test specimen thickness.
2.2. H2S Corrosion Rate Test
Corrosion tests were carried out in the H2S corrosion
experimental device following the NACE Standard
TM-0284-2003. The size of corrosion rate sample is 50
mm × 10 mm × 3 mm. Before the test, the surface of the
test specimens were polished with grit silicon carbide
papers progressively up to 800 grade, then degreased
with acetone and rinsed with absolute alcohol, weighted
using a precision of 0.001 mg, and finally stored in des-
iccators for use. Before experiment, the sealed test vessel
was deoxygenated with nitrogen for at least 6 hours.
Purging began immediately after the test vessel was
filled and was done at a rate of at least 100 ml per minute,
per liter of test solution. After purging, H2S gas was be
bubbled through the test solution. The rate of bubbling
was at least 200 ml per minute, per liter of test solution
for the first 60 minutes. Thereafter, a positive pressure of
H2S gas was maintained which controlled by the
flowmeter. After 168 hours’ corrosion, the samples were
removed from the solution and rinsed with deionized wa-
ter. The samples were descaled (the solution: 1 L HCl (ρ
= 1.19 g/L), 20 g Sb2O3 and 50 g SnCl2), rinsed with wa-
ter and absolute alcohol, dried in nature state and weight-
ed again with a precision of 0.001 mg. The corrosion rate
was represented by corrosion depth (mm)/corrosion time
(per year), i.e. mm/a. The corrosion morphologies were
observed by means of scanning electronic microscopy .
3. Results and Discussion
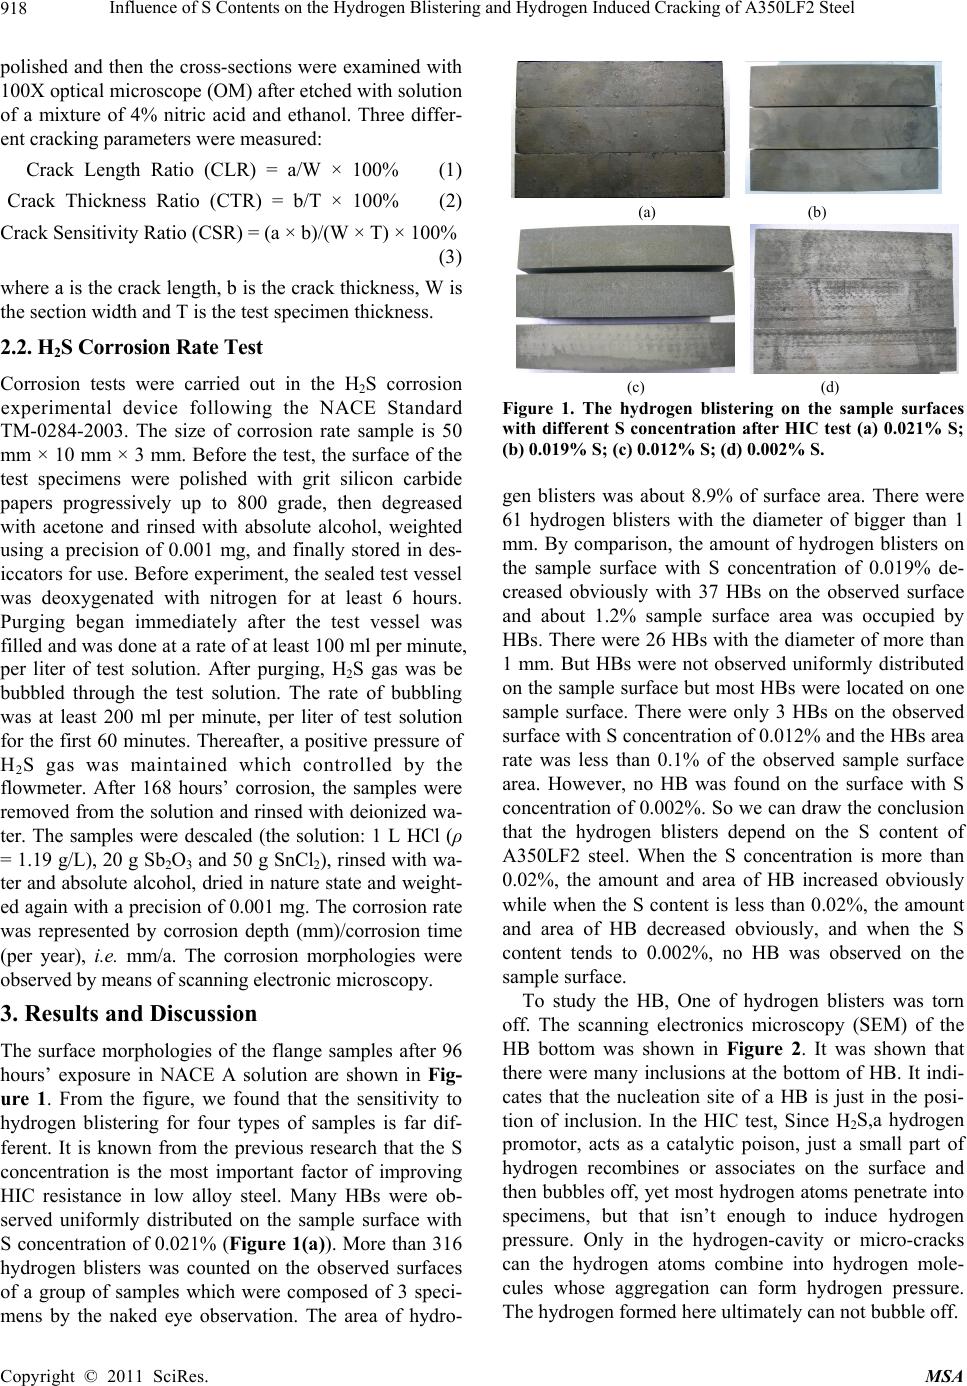
The surface morphologies of the flange samples after 96
hours’ exposure in NACE A solution are shown in Fig-
ure 1. From the figure, we found that the sensitivity to
hydrogen blistering for four types of samples is far dif-
ferent. It is known from the previous research that the S
concentration is the most important factor of improving
HIC resistance in low alloy steel. Many HBs were ob-
served uniformly distributed on the sample surface with
S concentration of 0.021% (Figure 1(a)). More than 316
hydrogen blisters was counted on the observed surfaces
of a group of samples which were composed of 3 speci-
mens by the naked eye observation. The area of hydro-
(a) (b)
(c) (d)
Figure 1. The hydrogen blistering on the sample surfaces
with different S concentration after HIC test (a) 0.021% S;
(b) 0.019% S; (c) 0.012% S; (d) 0.002% S.
gen blisters was about 8.9% of surface area. There were
61 hydrogen blisters with the diameter of bigger than 1
mm. By comparison, the amount of hydrogen blisters on
the sample surface with S concentration of 0.019% de-
creased obviously with 37 HBs on the observed surface
and about 1.2% sample surface area was occupied by
HBs. There were 26 HBs with the diameter of more than
1 mm. But HBs were not observed uniformly distributed
on the sample surface but most HBs were located on one
sample surface. There were only 3 HBs on the observed
surface with S concentration of 0.012% and the HBs area
rate was less than 0.1% of the observed sample surface
area. However, no HB was found on the surface with S
concentr ation of 0.002%. So we can draw the conclusion
that the hydrogen blisters depend on the S content of
A350LF2 steel. When the S concentration is more than
0.02%, the amount and area of HB increased obviously
while when the S content is less than 0.02%, the amount
and area of HB decreased obviously, and when the S
content tends to 0.002%, no HB was observed on the
sample surface.
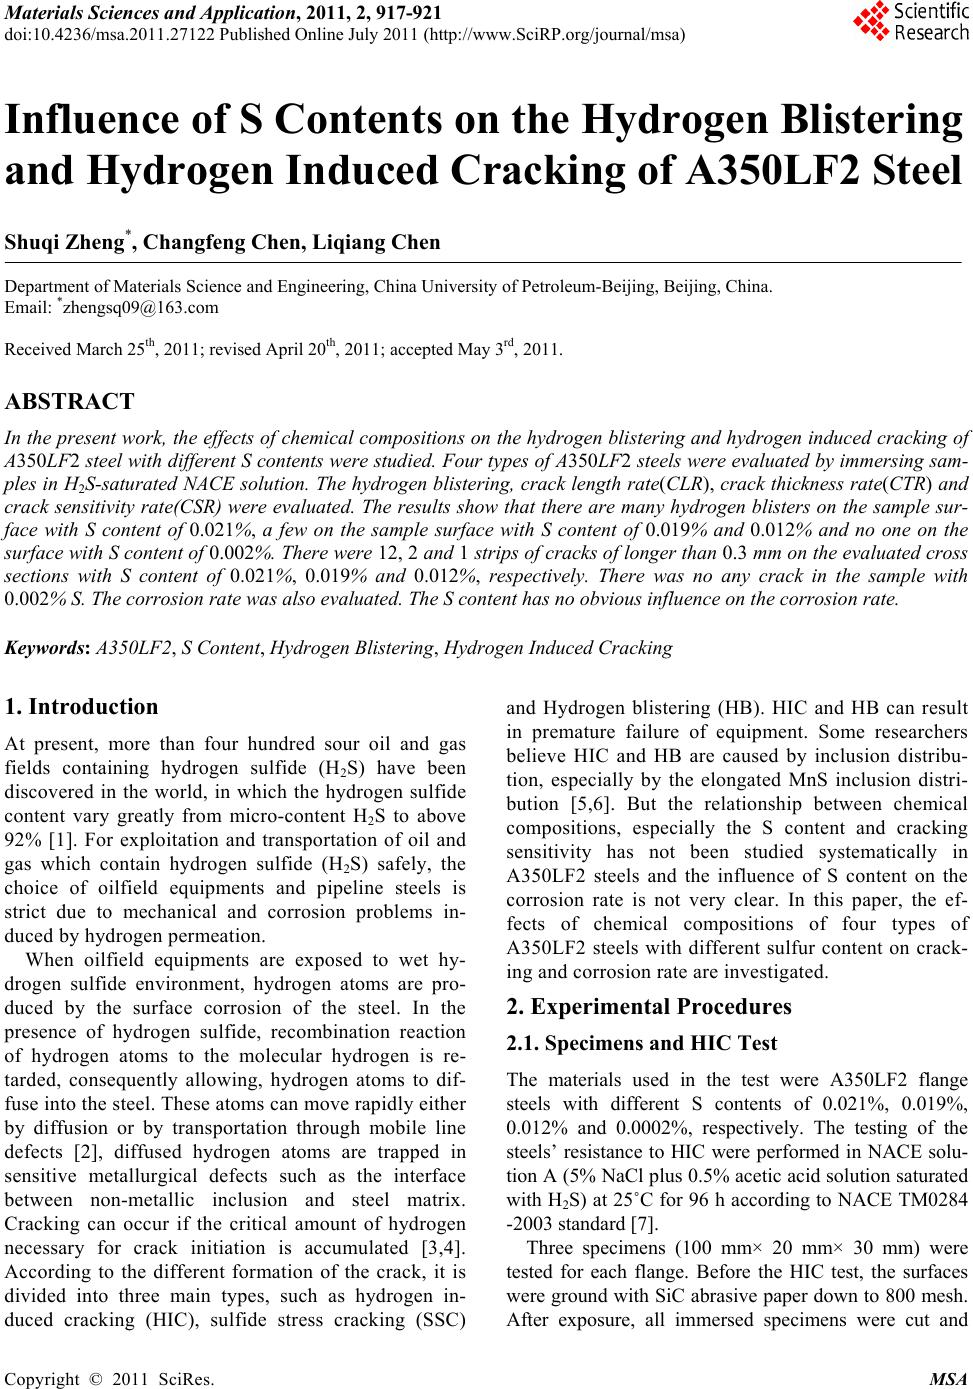
To study the HB, One of hydrogen blisters was torn
off. The scanning electronics microscopy (SEM) of the
HB bottom was shown in Figure 2. It was shown that
there were many inclusions at the bottom of HB. It indi-
cates that the nucleation site of a HB is just in the posi-
tion of inclusion. In the HIC test, Since H2S,a hydrogen
promotor, acts as a catalytic poison, just a small part of
hydrogen recombines or associates on the surface and
then bubbles off, yet most hydrogen atoms penetrate into
specimens, but that isn’t enough to induce hydrogen
pressure. Only in the hydrogen-cavity or micro-cracks
can the hydrogen atoms combine into hydrogen mole-
cules whose aggregation can form hydrogen pressure.
The hydrogen formed here ultimately can not bubble off.
Copyright © 2011 SciRes. MSA