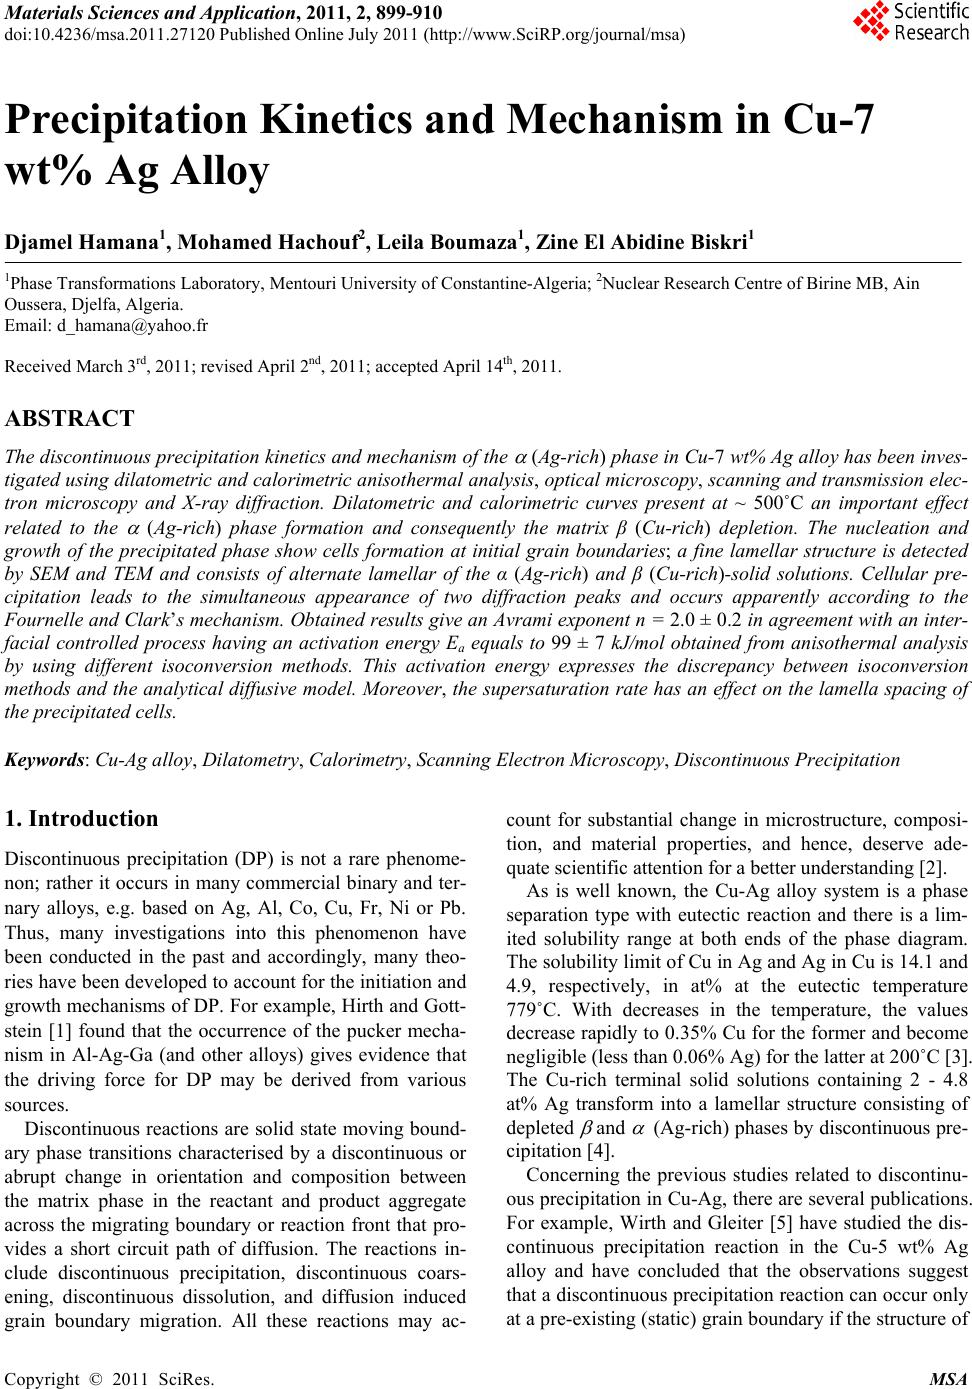
 Materials Sciences and Applicatio n, 2011, 2, 899-910 doi:10.4236/msa.2011.27120 Published Online July 2011 (http://www.SciRP.org/journal/msa) Copyright © 2011 SciRes. MSA 899 Precipitation Kinetics and Mechanism in Cu-7 wt% Ag Alloy Djamel Hamana1, Mohamed Hachouf2, Leila Boumaza1, Zine El Abidine Biskri1 1Phase Transformations Laboratory, Mentouri University of Constantine-Algeria; 2Nuclear Research Centre of Birine MB, Ain Oussera, Djelfa, Algeria. Email: d_hamana@yahoo.fr Received March 3rd, 2011; revised April 2nd, 2011; accepted April 14th, 2011. ABSTRACT The discontinuous precipitation kinetics and mechanism of the (Ag-rich) phase in Cu-7 wt% Ag alloy has been inves- tigated using dilatometric and calorimetric anisothermal analysis, optical microscopy, scanning and transmission elec- tron microscopy and X-ray diffraction. Dilatometric and calorimetric curves present at ~ 500˚C an important effect related to the (Ag-rich) phase formation and consequently the matrix β (Cu-rich) depletion. The nucleation and growth of the precipitated phase show cells formation at initial grain boundaries; a fine lamellar structure is detected by SEM and TEM and consists of alternate lamellar of the α (Ag-rich) and β (Cu-rich)-solid solutions. Cellular pre- cipitation leads to the simultaneous appearance of two diffraction peaks and occurs apparently according to the Fournelle and Clark’s mechanism. Obtained results give an Avrami exponent n = 2.0 ± 0.2 in agreement with an inter- facial controlled process having an activation energy Ea equals to 99 ± 7 kJ/mol obtained from anisothermal analysis by using different isoconversion methods. This activation energy expresses the discrepancy between isoconversion methods and the analytical diffusive model. Moreover, the supersaturation rate has an effect on the lamella spacing of the precipitated cells. Keywords: Cu-Ag alloy, Dilatometry, Calorimetry, Scanning Electron Microscopy, Discontinuous Precipitation 1. Introduction Discontinuous precipitation (DP) is not a rare phenome- non; rather it occurs in many commercial binary and ter- nary alloys, e.g. based on Ag, Al, Co, Cu, Fr, Ni or Pb. Thus, many investigations into this phenomenon have been conducted in the past and accordingly, many theo- ries have been developed to account for the initiation and growth mechanisms of DP. For example, Hirth and Gott- stein [1] found that the occurrence of the pucker mecha- nism in Al-Ag-Ga (and other alloys) gives evidence that the driving force for DP may be derived from various sources. Discontinuous reactions are solid state moving bound- ary phase transitions characterised by a discontinuous or abrupt change in orientation and composition between the matrix phase in the reactant and product aggregate across the migrating boundary or reaction front that pro- vides a short circuit path of diffusion. The reactions in- clude discontinuous precipitation, discontinuous coars- ening, discontinuous dissolution, and diffusion induced grain boundary migration. All these reactions may ac- count for substantial change in microstructure, composi- tion, and material properties, and hence, deserve ade- quate scientific attention for a better understanding [2]. As is well known, the Cu-Ag alloy system is a phase separation type with eutectic reaction and there is a lim- ited solubility range at both ends of the phase diagram. The solubility limit of Cu in Ag and Ag in Cu is 14.1 and 4.9, respectively, in at% at the eutectic temperature 779˚C. With decreases in the temperature, the values decrease rapidly to 0.35% Cu for the former and become negligible (less than 0.06% Ag) for the latter at 200˚C [3]. The Cu-rich terminal solid solutions containing 2 - 4.8 at% Ag transform into a lamellar structure consisting of depleted and (Ag-rich) phases by discontinuous pre- cipitation [4]. Concerning the previous studies related to discontinu- ous precipitation in Cu-Ag, there are several publications. For example, Wirth and Gleiter [5] have studied the dis- continuous precipitation reaction in the Cu-5 wt% Ag alloy and have concluded that the observations suggest that a discontinuous precipitation reaction can occur only at a pre-existing (static) grain boundary if the structure of 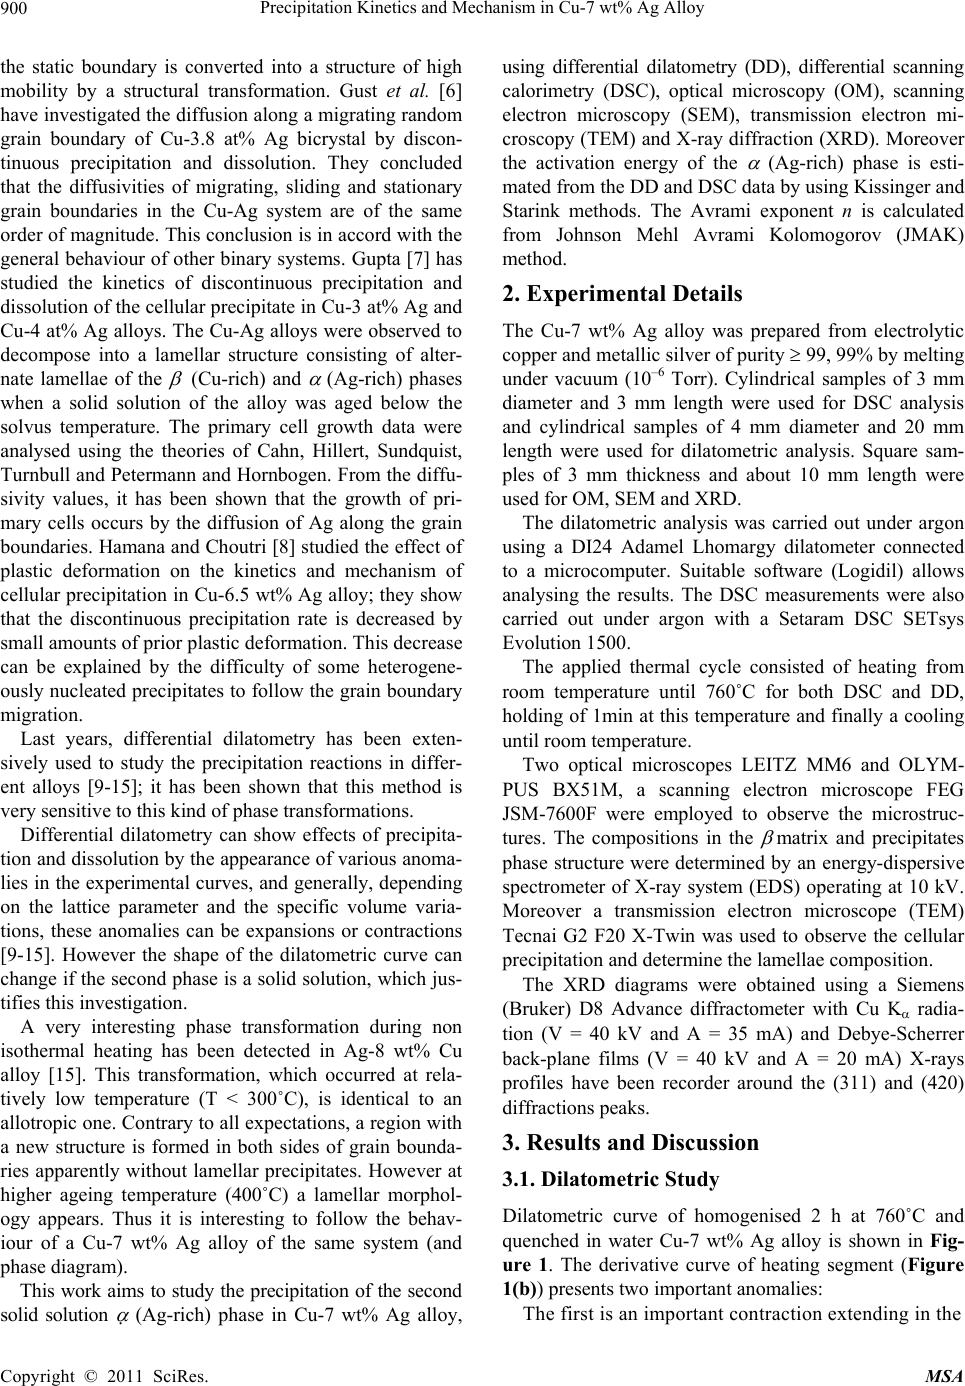 Precipitation Kinetics and Mechanism in Cu-7 wt% Ag Alloy 900 the static boundary is converted into a structure of high mobility by a structural transformation. Gust et al. [6] have investigated the diffusion along a migrating random grain boundary of Cu-3.8 at% Ag bicrystal by discon- tinuous precipitation and dissolution. They concluded that the diffusivities of migrating, sliding and stationary grain boundaries in the Cu-Ag system are of the same order of magnitude. This conclusion is in accord with the general behaviour of other binary systems. Gupta [7] has studied the kinetics of discontinuous precipitation and dissolution of the cellular precipitate in Cu-3 at% Ag and Cu-4 at% Ag alloys. The Cu-Ag alloys were observed to decompose into a lamellar structure consisting of alter- nate lamellae of the (Cu-rich) and (Ag-rich) phases when a solid solution of the alloy was aged below the solvus temperature. The primary cell growth data were analysed using the theories of Cahn, Hillert, Sundquist, Turnbull and Petermann and Hornbogen. From the diffu- sivity values, it has been shown that the growth of pri- mary cells occurs by the diffusion of Ag along the grain boundaries. Hamana and Choutri [8] studied the effect of plastic deformation on the kinetics and mechanism of cellular precipitation in Cu-6.5 wt% Ag alloy; they show that the discontinuous precipitation rate is decreased by small amounts of prior plastic deformation. This decrease can be explained by the difficulty of some heterogene- ously nucleated precipitates to follow the grain boundary migration. Last years, differential dilatometry has been exten- sively used to study the precipitation reactions in differ- ent alloys [9-15]; it has been shown that this method is very sensitive to this kind of phase transformations. Differential dilatometry can show effects of precipita- tion and dissolution by the appearance of various anoma- lies in the experimental curves, and generally, depending on the lattice parameter and the specific volume varia- tions, these anomalies can be expansions or contractions [9-15]. However the shape of the dilatometric curve can change if the second phase is a solid solution, which jus- tifies this investigation. A very interesting phase transformation during non isothermal heating has been detected in Ag-8 wt% Cu alloy [15]. This transformation, which occurred at rela- tively low temperature (T < 300˚C), is identical to an allotropic one. Contrary to all expectations, a region with a new structure is formed in both sides of grain bounda- ries apparently without lamellar precipitates. However at higher ageing temperature (400˚C) a lamellar morphol- ogy appears. Thus it is interesting to follow the behav- iour of a Cu-7 wt% Ag alloy of the same system (and phase diagram). This work aims to study the precipitation of the second solid solution (Ag-rich) phase in Cu-7 wt% Ag alloy, using differential dilatometry (DD), differential scanning calorimetry (DSC), optical microscopy (OM), scanning electron microscopy (SEM), transmission electron mi- croscopy (TEM) and X-ray diffraction (XRD). Moreover the activation energy of the (Ag-rich) phase is esti- mated from the DD and DSC data by using Kissinger and Starink methods. The Avrami exponent n is calculated from Johnson Mehl Avrami Kolomogorov (JMAK) method. 2. Experimental Details The Cu-7 wt% Ag alloy was prepared from electrolytic copper and metallic silver of purity 99, 99% by melting under vacuum (10–6 Torr). Cylindrical samples of 3 mm diameter and 3 mm length were used for DSC analysis and cylindrical samples of 4 mm diameter and 20 mm length were used for dilatometric analysis. Square sam- ples of 3 mm thickness and about 10 mm length were used for OM, SEM and XRD. The dilatometric analysis was carried out under argon using a DI24 Adamel Lhomargy dilatometer connected to a microcomputer. Suitable software (Logidil) allows analysing the results. The DSC measurements were also carried out under argon with a Setaram DSC SETsys Evolution 1500. The applied thermal cycle consisted of heating from room temperature until 760˚C for both DSC and DD, holding of 1min at this temperature and finally a cooling until room temperature. Two optical microscopes LEITZ MM6 and OLYM- PUS BX51M, a scanning electron microscope FEG JSM-7600F were employed to observe the microstruc- tures. The compositions in the matrix and precipitates phase structure were determined by an energy-dispersive spectrometer of X-ray system (EDS) operating at 10 kV. Moreover a transmission electron microscope (TEM) Tecnai G2 F20 X-Twin was used to observe the cellular precipitation and determine the lamellae composition. The XRD diagrams were obtained using a Siemens (Bruker) D8 Advance diffractometer with Cu K radia- tion (V = 40 kV and A = 35 mA) and Debye-Scherrer back-plane films (V = 40 kV and A = 20 mA) X-rays profiles have been recorder around the (311) and (420) diffractions peaks. 3. Results and Discussion 3.1. Dilatometric Study Dilatometric curve of homogenised 2 h at 760˚C and quenched in water Cu-7 wt% Ag alloy is shown in Fig- ure 1. The derivative curve of heating segment (Figure 1(b)) presents two important anomalies: The first is an important contraction extending in the Copyright © 2011 SciRes. MSA 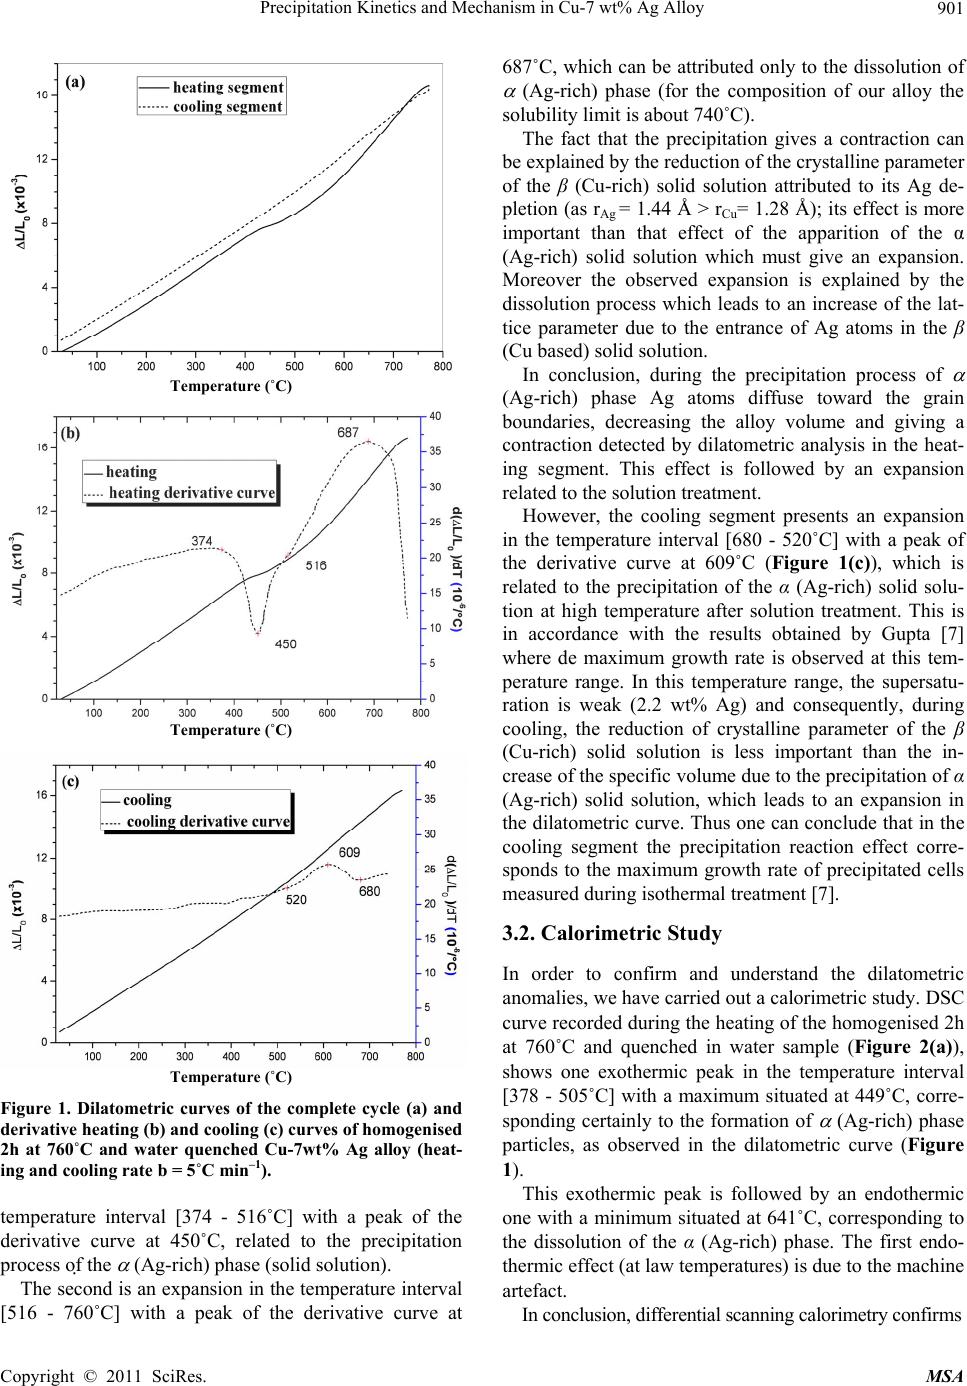 Precipitation Kinetics and Mechanism in Cu-7 wt% Ag Alloy901 Temperature (˚C) Temperature (˚C) Temperature (˚C) Figure 1. Dilatometric curves of the complete cycle (a) and derivative heating (b) and cooling (c) curves of homogenised 2h at 760˚C and water quenched Cu-7wt% Ag alloy (heat- ing and cooling rate b = 5˚C min–1). temperature interval [374 - 516˚C] with a peak of the derivative curve at 450˚C, related to the precipitation process of the (Ag-rich) phase (solid solution). The second is an expansion in the temperature interval [516 - 760˚C] with a peak of the derivative curve at 687˚C, which can be attributed only to the dissolution of (Ag-rich) phase (for the composition of our alloy the solubility limit is about 740˚C). The fact that the precipitation gives a contraction can be explained by the reduction of the crystalline parameter of the β (Cu-rich) solid solution attributed to its Ag de- pletion (as rAg = 1.44 Å > rCu= 1.28 Å); its effect is more important than that effect of the apparition of the α (Ag-rich) solid solution which must give an expansion. Moreover the observed expansion is explained by the dissolution process which leads to an increase of the lat- tice parameter due to the entrance of Ag atoms in the β (Cu based) solid solution. In conclusion, during the precipitation process of (Ag-rich) phase Ag atoms diffuse toward the grain boundaries, decreasing the alloy volume and giving a contraction detected by dilatometric analysis in the heat- ing segment. This effect is followed by an expansion related to the solution treatment. However, the cooling segment presents an expansion in the temperature interval [680 - 520˚C] with a peak of the derivative curve at 609˚C (Figure 1(c)), which is related to the precipitation of the α (Ag-rich) solid solu- tion at high temperature after solution treatment. This is in accordance with the results obtained by Gupta [7] where de maximum growth rate is observed at this tem- perature range. In this temperature range, the supersatu- ration is weak (2.2 wt% Ag) and consequently, during cooling, the reduction of crystalline parameter of the β (Cu-rich) solid solution is less important than the in- crease of the specific volume due to the precipitation of α (Ag-rich) solid solution, which leads to an expansion in the dilatometric curve. Thus one can conclude that in the cooling segment the precipitation reaction effect corre- sponds to the maximum growth rate of precipitated cells measured during isothermal treatment [7]. 3.2. Calorimetric Study In order to confirm and understand the dilatometric anomalies, we have carried out a calorimetric study. DSC curve recorded during the heating of the homogenised 2h at 760˚C and quenched in water sample (Figure 2(a)), shows one exothermic peak in the temperature interval [378 - 505˚C] with a maximum situated at 449˚C, corre- sponding certainly to the formation of (Ag-rich) phase particles, as observed in the dilatometric curve (Figure 1). This exothermic peak is followed by an endothermic one with a minimum situated at 641˚C, corresponding to the dissolution of the α (Ag-rich) phase. The first endo- thermic effect (at law temperatures) is due to the machine artefact. In conclusion, differential scanning calorimetry confirms Copyright © 2011 SciRes. MSA 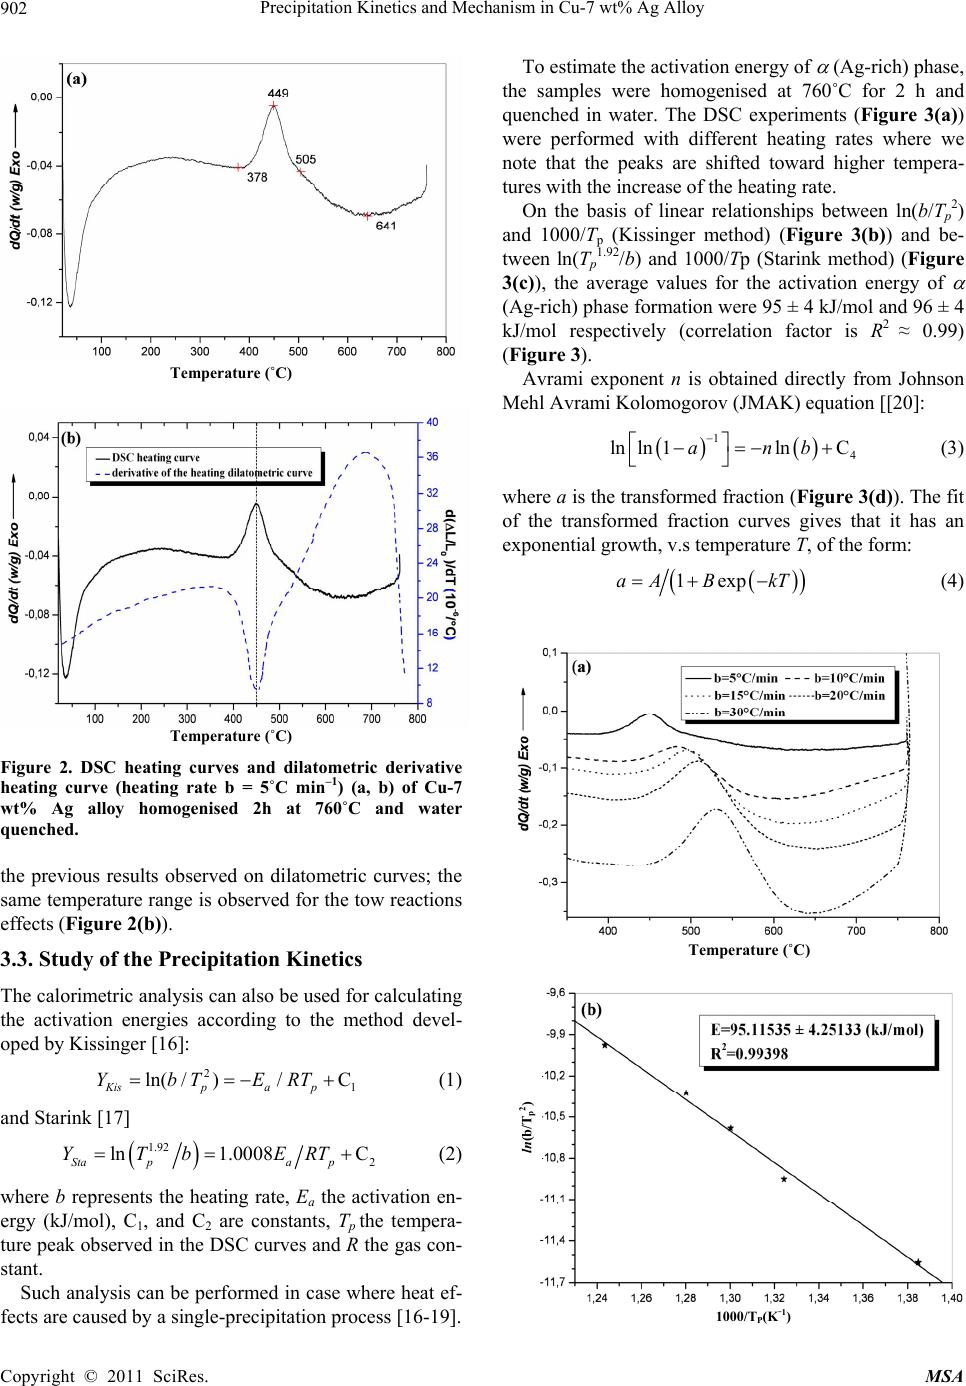 Precipitation Kinetics and Mechanism in Cu-7 wt% Ag Alloy 902 Temperature (˚C) Temperature (˚C) Figure 2. DSC heating curves and dilatometric derivative heating curve (heating rate b = 5˚C min–1) (a, b) of Cu-7 wt% Ag alloy homogenised 2h at 760˚C and water quenched. the previous results observed on dilatometric curves; the same temperature range is observed for the tow reactions effects (Figure 2(b)). 3.3. Study of the Precipitation Kinetics The calorimetric analysis can also be used for calculating the activation energies according to the method devel- oped by Kissinger [16]: 2 1 ln( /)/C Kispap YbTERT (1) and Starink [17] 1.92 2 ln1.0008 C Stapa p YTb ERT (2) where b represents the heating rate, Ea the activation en- ergy (kJ/mol), C1, and C2 are constants, Tp the tempera- ture peak observed in the DSC curves and R the gas con- stant. Such analysis can be performed in case where heat ef- fects are caused by a single-precipitation process [16-19]. To estimate the activation energy of (Ag-rich) phase, the samples were homogenised at 760˚C for 2 h and quenched in water. The DSC experiments (Figure 3(a)) were performed with different heating rates where we note that the peaks are shifted toward higher tempera- tures with the increase of the heating rate. On the basis of linear relationships between ln(b/Tp 2) and 1000/Tp (Kissinger method) (Figure 3(b)) and be- tween ln(Tp 1.92/b) and 1000/Tp (Starink method) (Figure 3(c)), the average values for the activation energy of (Ag-rich) phase formation were 95 ± 4 kJ/mol and 96 ± 4 kJ/mol respectively (correlation factor is R2 ≈ 0.99) (Figure 3). Avrami exponent n is obtained directly from Johnson Mehl Avrami Kolomogorov (JMAK) equation [[20]: 1 4 lnln 1lnCanb (3) where a is the transformed fraction (Figure 3(d)). The fit of the transformed fraction curves gives that it has an exponential growth, v.s temperature T, of the form: 1expaA BkT (4) Temperature (˚C) ln(b/Tp2) 1000/TP(K-1) Copyright © 2011 SciRes. MSA 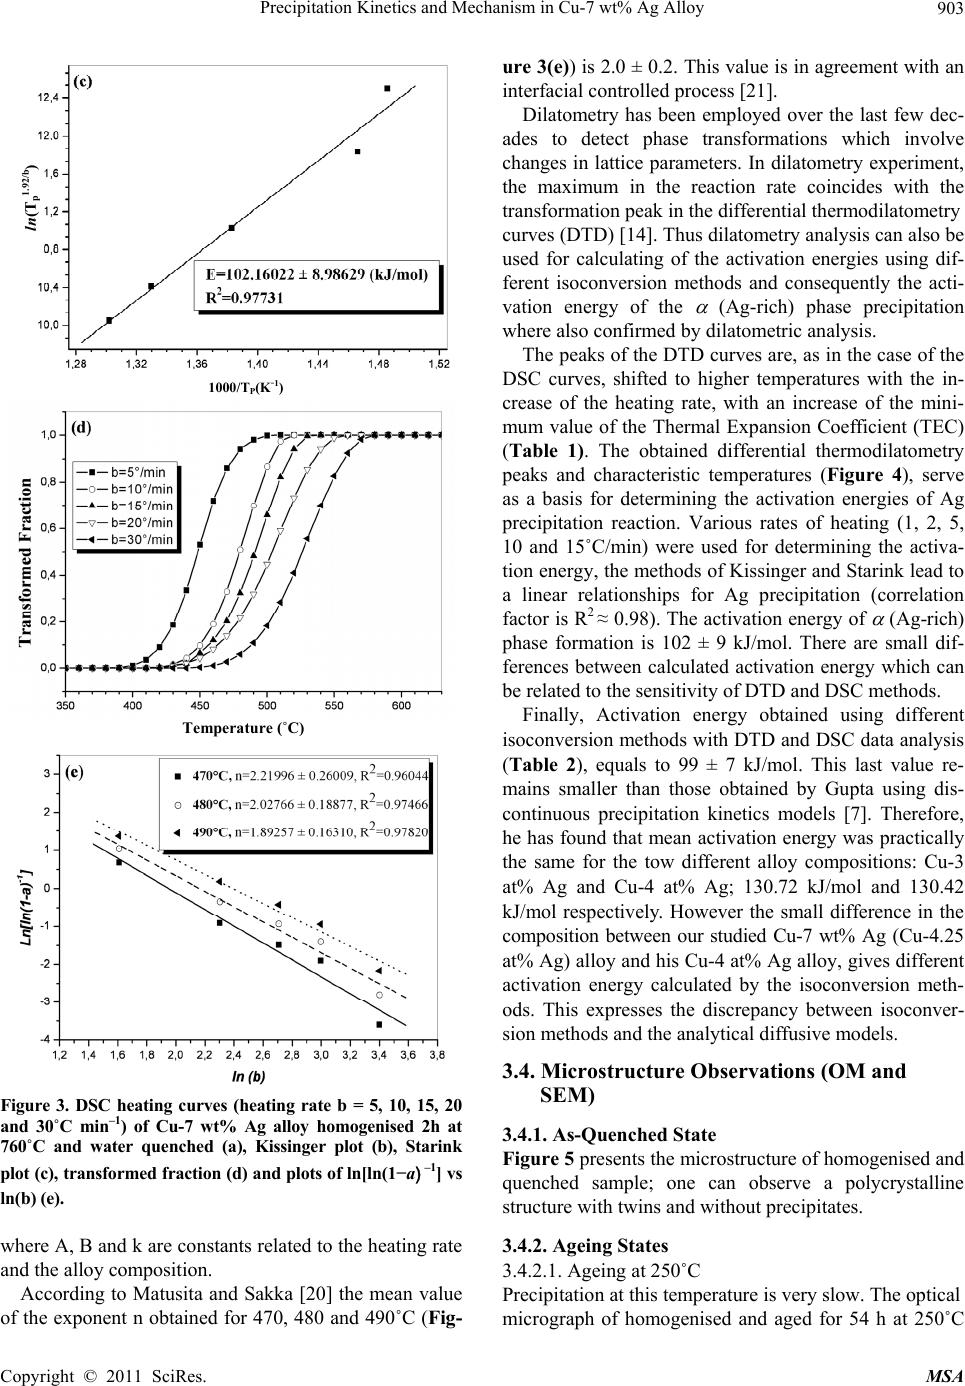 Precipitation Kinetics and Mechanism in Cu-7 wt% Ag Alloy Copyright © 2011 SciRes. MSA 903 Temperature (˚C) Figure 3. DSC heating curves (heating rate b = 5, 10, 15, 20 and 30˚C min–1) of Cu-7 wt% Ag alloy homogenised 2h at 760˚C and water quenched (a), Kissinger plot (b), Starink plot (c), transformed fraction (d) and plots of ln[ln(1−a) –1] vs ln(b) (e). where A, B and k are constants related to the heating rate and the alloy composition. According to Matusita and Sakka [20] the mean value of the exponent n obtained for 470, 480 and 490˚C (Fig- ure 3(e)) is 2.0 ± 0.2. This value is in agreement with an interfacial controlled process [21]. Dilatometry has been employed over the last few dec- ades to detect phase transformations which involve changes in lattice parameters. In dilatometry experiment, the maximum in the reaction rate coincides with the transformation peak in the differential thermodilatometry ln(Tp 1.92/b) curves (DTD) [14]. Thus dilatometry analysis can also be used for calculating of the activation energies using dif- ferent isoconversion methods and consequently the acti- vation energy of the (Ag-rich) phase precipitation where also confirmed by dilatometric analysis. The peaks of the DTD curves are, as in the case of the DSC curves, shifted to higher temperatures with the in- crease of the heating rate, with an increase of the mini- mum value of the Thermal Expansion Coefficient (TEC) (Table 1). The obtained differential thermodilatometry peaks and characteristic temperatures (Figure 4), serve as a basis for determining the activation energies of Ag precipitation reaction. Various rates of heating (1, 2, 5, 10 and 15˚C/min) were used for determining the activa- tion energy, the methods of Kissinger and Starink lead to a linear relationships for Ag precipitation (correlation factor is R2 ≈ 0.98). The activation energy of (Ag-rich) phase formation is 102 ± 9 kJ/mol. There are small dif- ferences between calculated activation energy which can be related to the sensitivity of DTD and DSC methods. 1000/TP(K-1) Finally, Activation energy obtained using different isoconversion methods with DTD and DSC data analysis (Table 2), equals to 99 ± 7 kJ/mol. This last value re- mains smaller than those obtained by Gupta using dis- continuous precipitation kinetics models [7]. Therefore, he has found that mean activation energy was practically the same for the tow different alloy compositions: Cu-3 at% Ag and Cu-4 at% Ag; 130.72 kJ/mol and 130.42 kJ/mol respectively. However the small difference in the composition between our studied Cu-7 wt% Ag (Cu-4.25 at% Ag) alloy and his Cu-4 at% Ag alloy, gives different activation energy calculated by the isoconversion meth- ods. This expresses the discrepancy between isoconver- sion methods and the analytical diffusive models. 3.4. Microstructure Observations (OM and SEM) 3.4.1. As-Quenched State Figure 5 presents the microstructure of homogenised and quenched sample; one can observe a polycrystalline structure with twins and without precipitates. 3.4.2. Ageing States 3.4.2.1. Ageing at 250˚C Precipitation at this temperature is very slow. The optical micrograph of homogenised and aged for 54 h at 250˚C 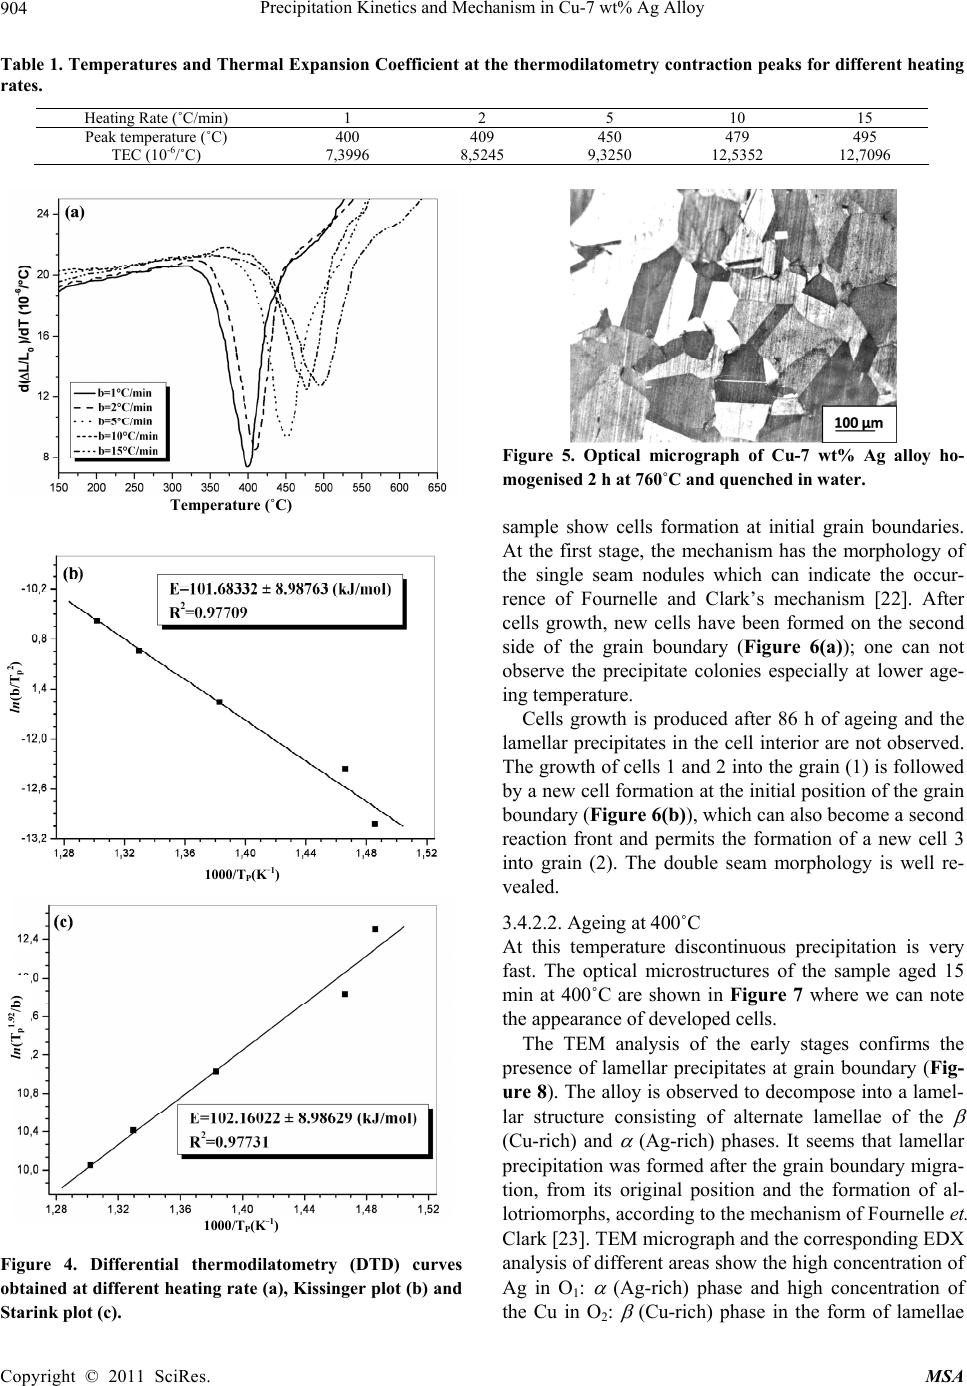 Precipitation Kinetics and Mechanism in Cu-7 wt% Ag Alloy 904 Table 1. Temperatures and Thermal Expansion Coefficient at the thermodilatometry contraction peaks for different heating rates. Heating Rate (˚C/min) 1 2 5 10 15 Peak temperature (˚C) 400 409 450 479 495 TEC (10-6/˚C) 7,3996 8,5245 9,3250 12,5352 12,7096 Temperature (˚C) Figure 4. Differential thermodilatometry (DTD) curves obtained at different heating rate (a), Kissinger plot (b) and Starink plot (c). Figure 5. Optical micrograph of Cu-7 wt% Ag alloy ho- mogenised 2 h at 760˚C and quenched in water. sample show cells formation at initial grain boundaries. At the first stage, the mechanism has the morphology of the single seam nodules which can indicate the occur- rence of Fournelle and Clark’s mechanism [22]. After cells growth, new cells have been formed on the second side of the grain boundary (Figure 6(a)); one can not observe the precipitate colonies especially at lower age- ing temperature. ln(b/Tp2) Cells growth is produced after 86 h of ageing and the lamellar precipitates in the cell interior are not observed. The growth of cells 1 and 2 into the grain (1) is followed by a new cell formation at the initial position of the grain boundary (Figure 6(b)), which can also become a second reaction front and permits the formation of a new cell 3 into grain (2). The double seam morphology is well re- vealed. 1000/TP(K-1) 3.4.2.2. Ageing at 400˚C At this temperature discontinuous precipitation is very fast. The optical microstructures of the sample aged 15 min at 400˚C are shown in Figure 7 where we can note the appearance of developed cells. ln(Tp1.92/b) The TEM analysis of the early stages confirms the presence of lamellar precipitates at grain boundary (Fig- ure 8). The alloy is observed to decompose into a lamel- lar structure consisting of alternate lamellae of the (Cu-rich) and (Ag-rich) phases. It seems that lamellar precipitation was formed after the grain boundary migra- tion, from its original position and the formation of al- lotriomorphs, according to the mechanism of Fournelle et. Clark [23]. TEM micrograph and the corresponding EDX analysis of different areas show the high concentration of Ag in O1: (Ag-rich) phase and high concentration of the Cu in O2: (Cu-rich) phase in the form of lamellae 1000/TP(K-1) Copyright © 2011 SciRes. MSA  Precipitation Kinetics and Mechanism in Cu-7 wt% Ag Alloy 905 Table 2. Average activation energy obtained using Kissinger and Starink methods and DTD and DSC data analysis. Kissinger method Starink method Obtained DSC curves activation energy (kJ/mol) 95 ± 4 96 ± 4 Obtained DTD curves activation energy (kJ/mol) 102 ± 9 102 ± 9 Average activation energy (kJ/mol) 99 ± 7 99 ± 7 Figure 6. Microstructures evolution at a grain boundary of a sample homogenised 2 h at 760˚C, quenched then aged at 250˚C for 54 h (a) and 86 h (b). Figure 7. Microstructures of a sample homogenised 2 h at 760˚C, quenched then aged at 400˚C for 15 min (a and b). Figure 8. TEM micrographs showing the early stages of discontinuous reaction with lamellar precipitates in Cu-7 wt% Ag alloy after ageing at 400˚C for 15 min. OGBP : original grain boundary position, RF: reaction front and GB : grain boundary. (Figure 9). The two regions O3 and O4 which correspond to the supersaturated matrix have the same composition. Moreover, the SEM analysis of three regions shows that the concentration of Ag is higher in the cell composed of fine lamellar precipitates and lower in the supersaturated solid solution (Figure 10(a)). A much larger magnific- Copyright © 2011 SciRes. MSA 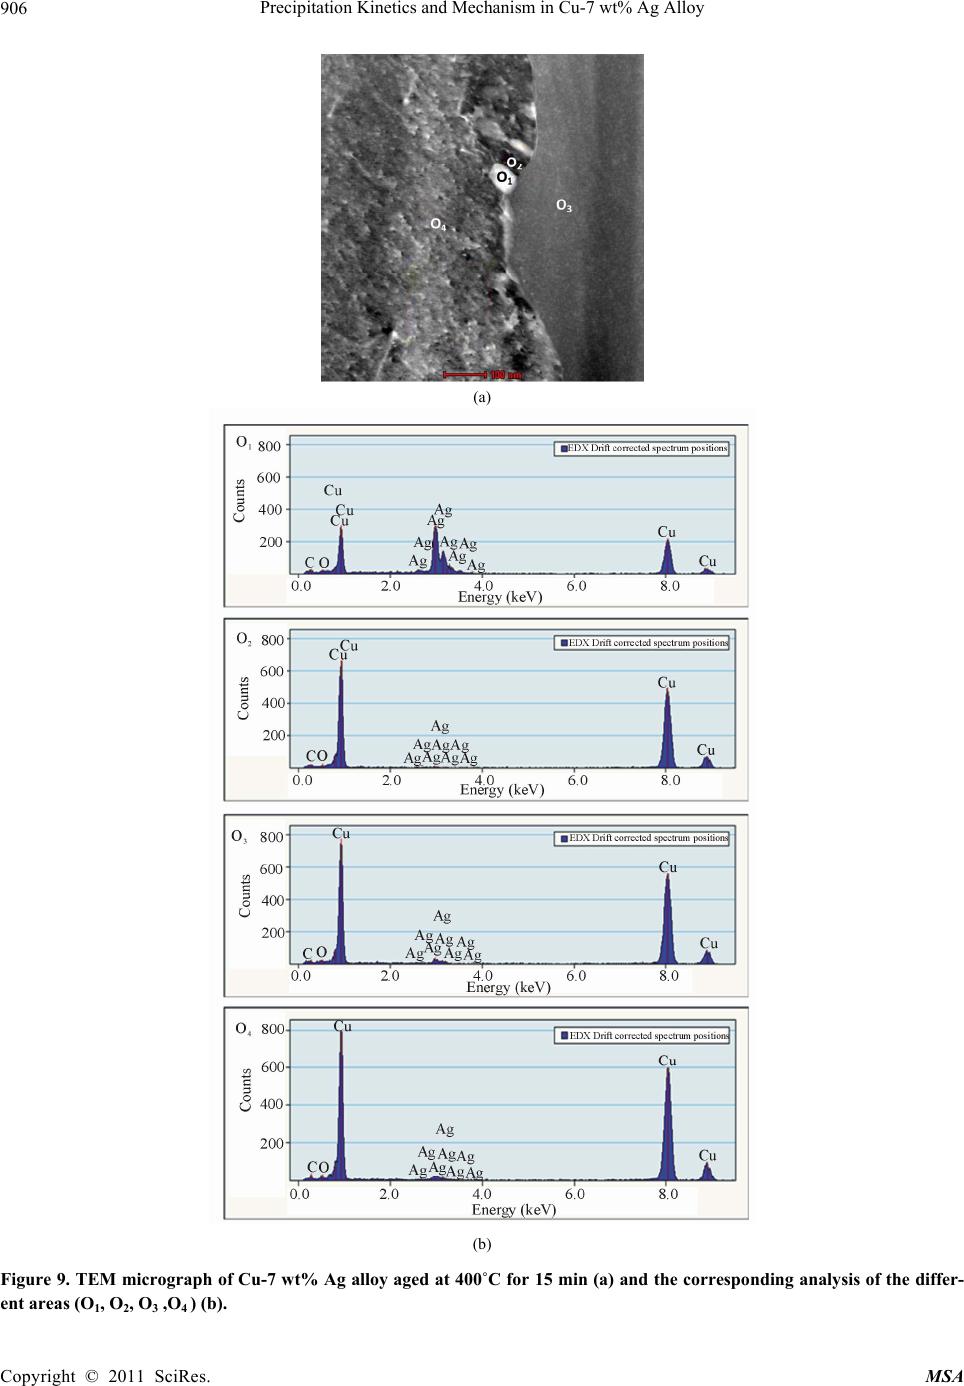 Precipitation Kinetics and Mechanism in Cu-7 wt% Ag Alloy 906 (a) (b) Figure 9. TEM micrograph of Cu-7 wt% Ag alloy aged at 400˚C for 15 min (a) and the corresponding analysis of the differ- ent areas (O1, O2, O3 ,O4 ) (b). Copyright © 2011 SciRes. MSA 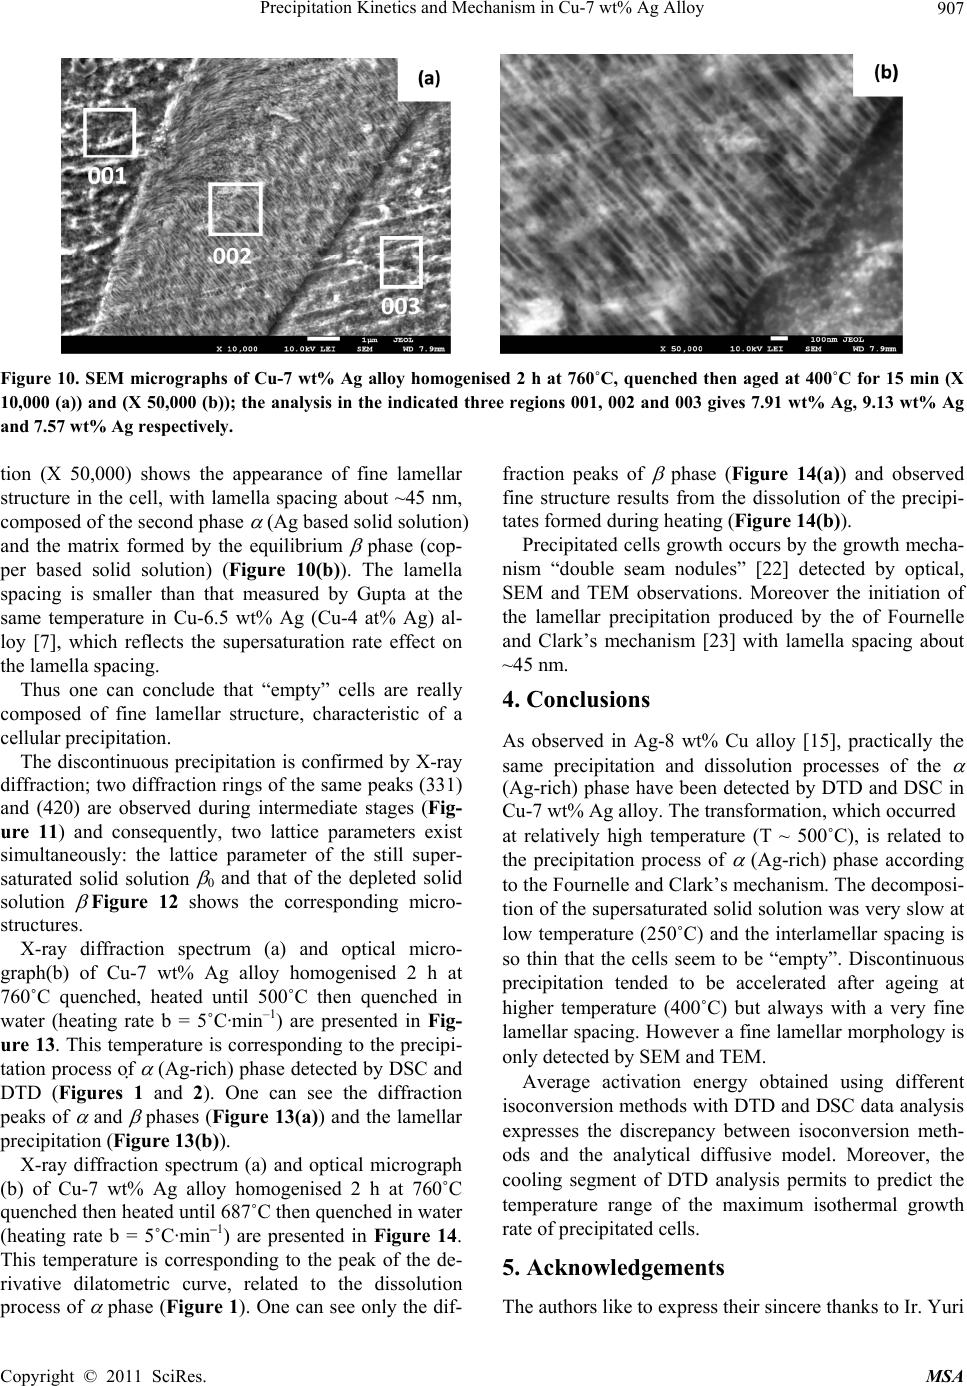 Precipitation Kinetics and Mechanism in Cu-7 wt% Ag Alloy Copyright © 2011 SciRes. MSA 907 Figure 10. SEM micrographs of Cu-7 wt% Ag alloy homogenised 2 h at 760˚C, quenched then aged at 400˚C for 15 min (X 10,000 (a)) and (X 50,000 (b)); the analysis in the indicated three regions 001, 002 and 003 gives 7.91 wt% Ag, 9.13 wt% Ag and 7.57 wt% Ag respectively. tion (X 50,000) shows the appearance of fine lamellar structure in the cell, with lamella spacing about ~45 nm, composed of the second phase (Ag based solid solution) and the matrix formed by the equilibrium phase (cop- per based solid solution) (Figure 10(b)). The lamella spacing is smaller than that measured by Gupta at the same temperature in Cu-6.5 wt% Ag (Cu-4 at% Ag) al- loy [7], which reflects the supersaturation rate effect on the lamella spacing. Thus one can conclude that “empty” cells are really composed of fine lamellar structure, characteristic of a cellular precipitation. The discontinuous precipitation is confirmed by X-ray diffraction; two diffraction rings of the same peaks (331) and (420) are observed during intermediate stages (Fig- ure 11) and consequently, two lattice parameters exist simultaneously: the lattice parameter of the still super- saturated solid solution 0 and that of the depleted solid solution Figure 12 shows the corresponding micro- structures. X-ray diffraction spectrum (a) and optical micro- graph(b) of Cu-7 wt% Ag alloy homogenised 2 h at 760˚C quenched, heated until 500˚C then quenched in water (heating rate b = 5˚C·min –1) are presented in Fig- ure 13. This temperature is corresponding to the precipi- tation process of (Ag-rich) phase detected by DSC and DTD (Figures 1 and 2). One can see the diffraction peaks of and phases (Figure 13(a)) and the lamellar precipitation (Figure 13(b)). X-ray diffraction spectrum (a) and optical micrograph (b) of Cu-7 wt% Ag alloy homogenised 2 h at 760˚C quenched then heated until 687˚C then quenched in water (heating rate b = 5˚C·min–1) are presented in Figure 14. This temperature is corresponding to the peak of the de- rivative dilatometric curve, related to the dissolution process of phase (Figure 1). One can see only the dif- fraction peaks of phase (Figure 14(a)) and observed fine structure results from the dissolution of the precipi- tates formed during heating (Figure 14(b)). Precipitated cells growth occurs by the growth mecha- nism “double seam nodules” [22] detected by optical, SEM and TEM observations. Moreover the initiation of the lamellar precipitation produced by the of Fournelle and Clark’s mechanism [23] with lamella spacing about ~45 nm. 4. Conclusions As observed in Ag-8 wt% Cu alloy [15], practically the same precipitation and dissolution processes of the (Ag-rich) phase have been detected by DTD and DSC in Cu-7 wt% Ag alloy. The transformation, which occurred at relatively high temperature (T ~ 500˚C), is related to the precipitation process of (Ag-rich) phase according to the Fournelle and Clark’s mechanism. The decomposi- tion of the supersaturated solid solution was very slow at low temperature (250˚C) and the interlamellar spacing is so thin that the cells seem to be “empty”. Discontinuous precipitation tended to be accelerated after ageing at higher temperature (400˚C) but always with a very fine lamellar spacing. However a fine lamellar morphology is only detected by SEM and TEM. Average activation energy obtained using different isoconversion methods with DTD and DSC data analysis expresses the discrepancy between isoconversion meth- ods and the analytical diffusive model. Moreover, the cooling segment of DTD analysis permits to predict the temperature range of the maximum isothermal growth rate of precipitated cells. 5. Acknowledgements The authors like to express their sincere thanks to Ir. Yuri 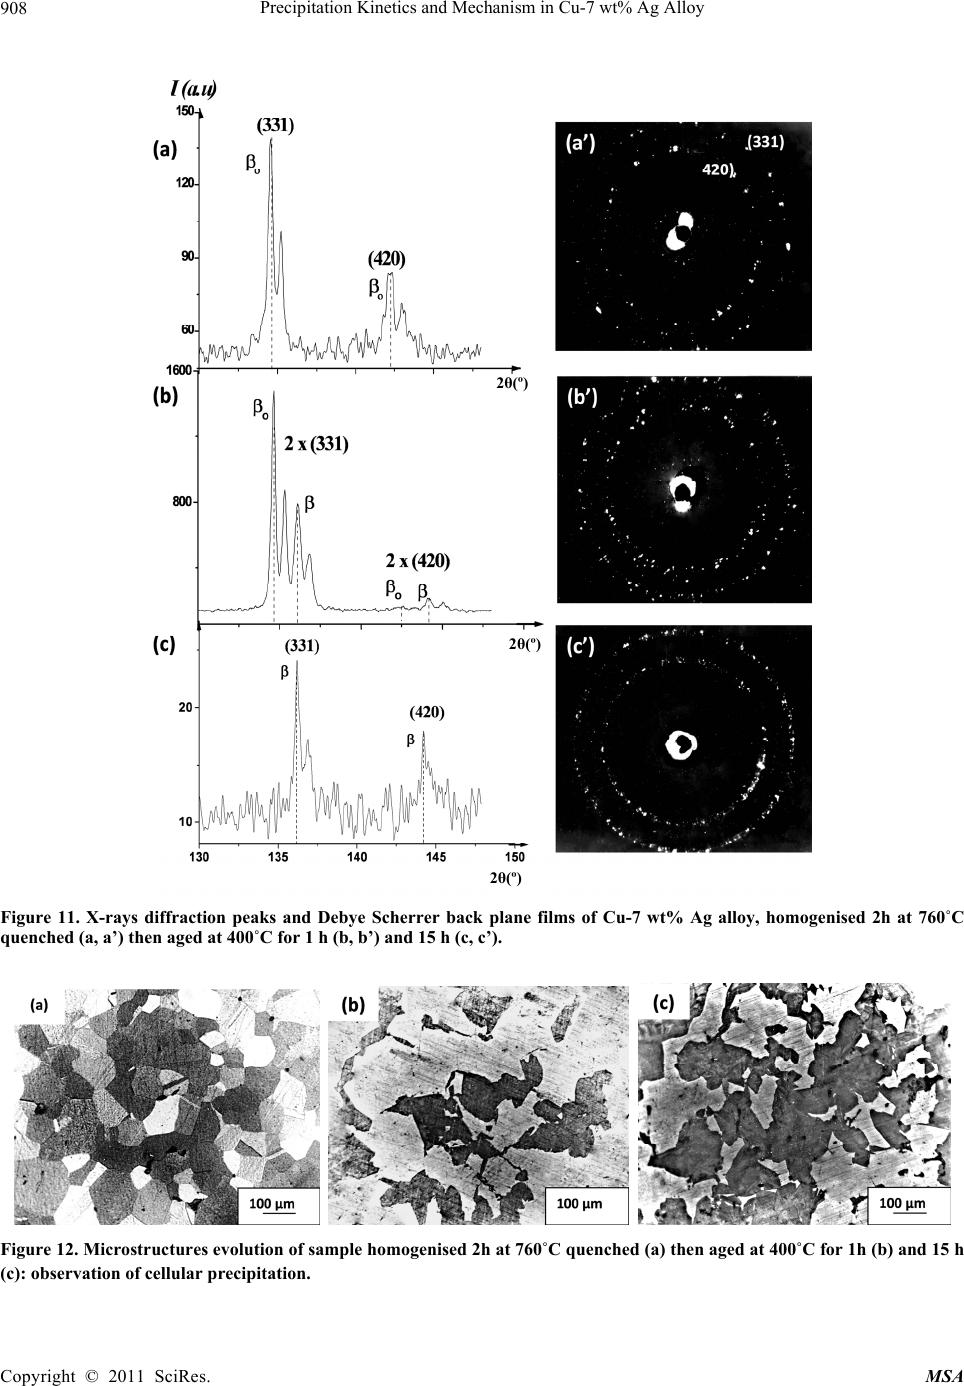 Precipitation Kinetics and Mechanism in Cu-7 wt% Ag Alloy 908 2θ(º) 2θ(º) 2θ(º) Figure 11. X-rays diffraction peaks and Debye Scherrer back plane films of Cu-7 wt% Ag alloy, homogenised 2h at 760˚C quenched (a, a’) then aged at 400˚C for 1 h (b, b’) and 15 h (c, c’). Figure 12. Microstructures evolution of sample homogenised 2h at 760˚C quenched (a) then aged at 400˚C for 1h (b) and 15 h (c): observation of cellular precipitation. Copyright © 2011 SciRes. MSA 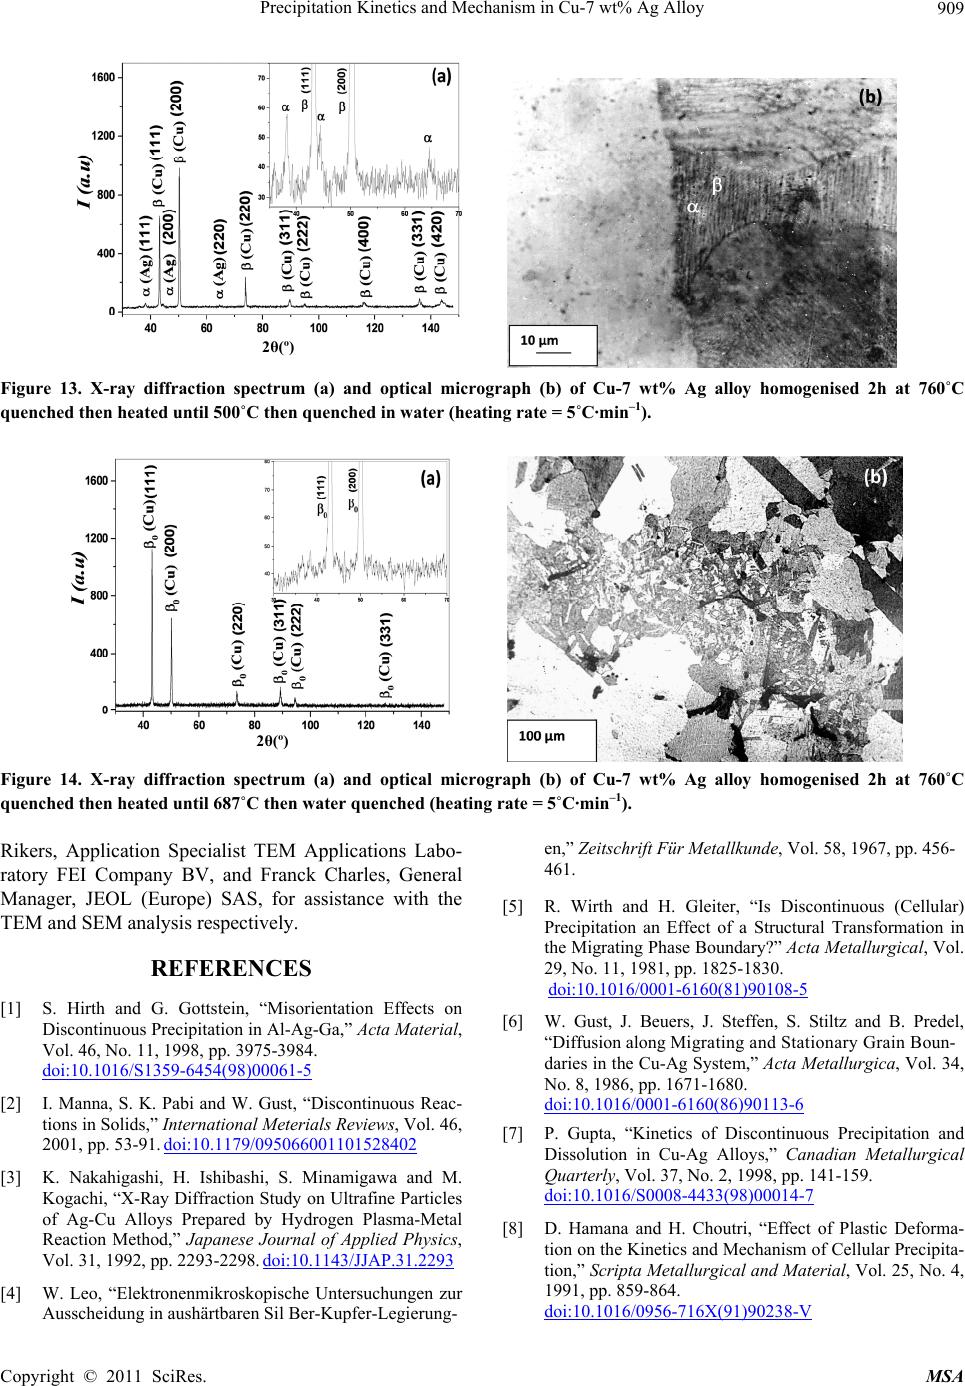 Precipitation Kinetics and Mechanism in Cu-7 wt% Ag Alloy Copyright © 2011 SciRes. MSA 909 2θ(º) Figure 13. X-ray diffraction spectrum (a) and optical micrograph (b) of Cu-7 wt% Ag alloy homogenised 2h at 760˚C quenched then heated until 500˚C then quenched in water (heating rate = 5˚C·min–1). 2θ(º) Figure 14. X-ray diffraction spectrum (a) and optical micrograph (b) of Cu-7 wt% Ag alloy homogenised 2h at 760˚C quenched then heated until 687˚C then water quenched (heating rate = 5˚C·min–1). Rikers, Application Specialist TEM Applications Labo- ratory FEI Company BV, and Franck Charles, General Manager, JEOL (Europe) SAS, for assistance with the TEM and SEM analysis respectively. REFERENCES [1] S. Hirth and G. Gottstein, “Misorientation Effects on Discontinuous Precipitation in Al-Ag-Ga,” Acta Material, Vol. 46, No. 11, 1998, pp. 3975-3984. doi:10.1016/S1359-6454(98)00061-5 [2] I. Manna, S. K. Pabi and W. Gust, “Discontinuous Reac- tions in Solids,” International Meterials Reviews, Vol. 46, 2001, pp. 53-91. doi:10.1179/095066001101528402 [3] K. Nakahigashi, H. Ishibashi, S. Minamigawa and M. Kogachi, “X-Ray Diffraction Study on Ultrafine Particles of Ag-Cu Alloys Prepared by Hydrogen Plasma-Metal Reaction Method,” Japanese Journal of Applied Physics, Vol. 31, 1992, pp. 2293-2298. doi:10.1143/JJAP.31.2293 [4] W. Leo, “Elektronenmikroskopische Untersuchungen zur Ausscheidung in aushärtbaren Sil Ber-Kupfer-Legierung- en,” Zeitschrift Für Metallkunde, Vol. 58, 1967, pp. 456- 461. [5] R. Wirth and H. Gleiter, “Is Discontinuous (Cellular) Precipitation an Effect of a Structural Transformation in the Migrating Phase Boundary?” Acta Metallurgical, Vol. 29, No. 11, 1981, pp. 1825-1830. doi:10.1016/0001-6160(81)90108-5 [6] W. Gust, J. Beuers, J. Steffen, S. Stiltz and B. Predel, “Diffusion along Migrating and Stationary Grain Boun- daries in the Cu-Ag System,” Acta Metallurgica, Vol. 34, No. 8, 1986, pp. 1671-1680. doi:10.1016/0001-6160(86)90113-6 [7] P. Gupta, “Kinetics of Discontinuous Precipitation and Dissolution in Cu-Ag Alloys,” Canadian Metallurgical Quarterly, Vol. 37, No. 2, 1998, pp. 141-159. doi:10.1016/S0008-4433(98)00014-7 [8] D. Hamana and H. Choutri, “Effect of Plastic Deforma- tion on the Kinetics and Mechanism of Cellular Precipita- tion,” Scripta Metallurgical and Material, Vol. 25, No. 4, 1991, pp. 859-864. doi:10.1016/0956-716X(91)90238-V 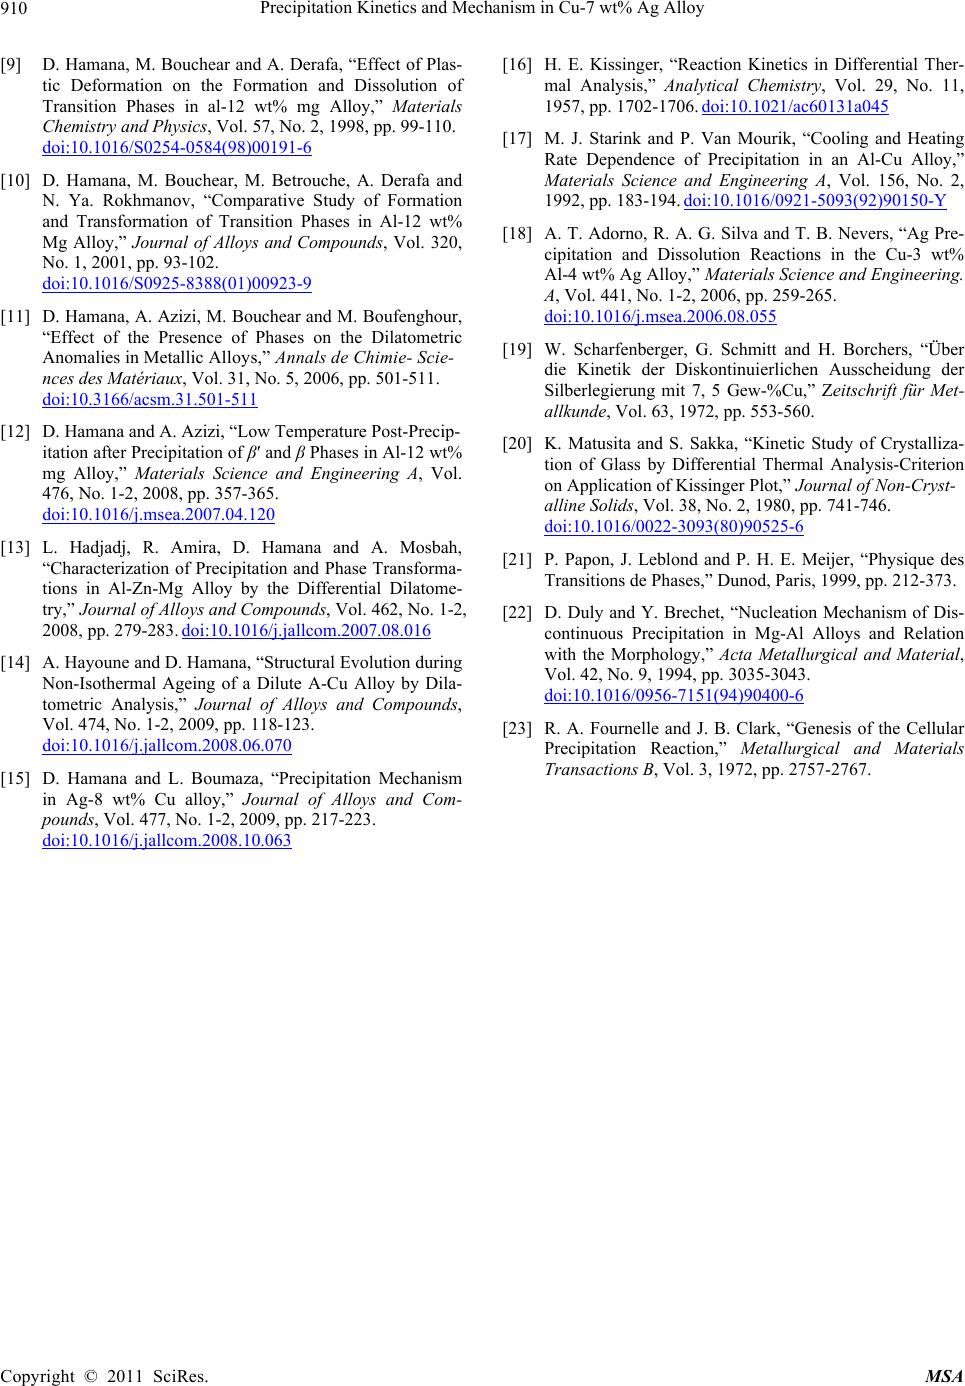 Precipitation Kinetics and Mechanism in Cu-7 wt% Ag Alloy 910 [9] D. Hamana, M. Bouchear and A. Derafa, “Effect of Plas- tic Deformation on the Formation and Dissolution of Transition Phases in al-12 wt% mg Alloy,” Materials Chemistry and Physics, Vol. 57, No. 2, 1998, pp. 99-110. doi:10.1016/S0254-0584(98)00191-6 [10] D. Hamana, M. Bouchear, M. Betrouche, A. Derafa and N. Ya. Rokhmanov, “Comparative Study of Formation and Transformation of Transition Phases in Al-12 wt% Mg Alloy,” Journal of Alloys and Compounds, Vol. 320, No. 1, 2001, pp. 93-102. doi:10.1016/S0925-8388(01)00923-9 [11] D. Hamana, A. Azizi, M. Bouchear and M. Boufenghour, “Effect of the Presence of Phases on the Dilatometric Anomalies in Metallic Alloys,” Annals de Chimie- Scie- nces des Matériaux, Vol. 31, No. 5, 2006, pp. 501-511. doi:10.3166/acsm.31.501-511 [12] D. Hamana and A. Azizi, “Low Temperature Post-Precip- itation after Precipitation of β′ and β Phases in Al-12 wt% mg Alloy,” Materials Science and Engineering A, Vol. 476, No. 1-2, 2008, pp. 357-365. doi:10.1016/j.msea.2007.04.120 [13] L. Hadjadj, R. Amira, D. Hamana and A. Mosbah, “Characterization of Precipitation and Phase Transforma- tions in Al-Zn-Mg Alloy by the Differential Dilatome- try,” Journal of Alloys and Compounds, Vol. 462, No. 1-2, 2008, pp. 279-283. doi:10.1016/j.jallcom.2007.08.016 [14] A. Hayoune and D. Hamana, “Structural Evolution during Non-Isothermal Ageing of a Dilute A-Cu Alloy by Dila- tometric Analysis,” Journal of Alloys and Compounds, Vol. 474, No. 1-2, 2009, pp. 118-123. doi:10.1016/j.jallcom.2008.06.070 [15] D. Hamana and L. Boumaza, “Precipitation Mechanism in Ag-8 wt% Cu alloy,” Journal of Alloys and Com- pounds, Vol. 477, No. 1-2, 2009, pp. 217-223. doi:10.1016/j.jallcom.2008.10.063 [16] H. E. Kissinger, “Reaction Kinetics in Differential Ther- mal Analysis,” Analytical Chemistry, Vol. 29, No. 11, 1957, pp. 1702-1706. doi:10.1021/ac60131a045 [17] M. J. Starink and P. Van Mourik, “Cooling and Heating Rate Dependence of Precipitation in an Al-Cu Alloy,” Materials Science and Engineering A, Vol. 156, No. 2, 1992, pp. 183-194. doi:10.1016/0921-5093(92)90150-Y [18] A. T. Adorno, R. A. G. Silva and T. B. Nevers, “Ag Pre- cipitation and Dissolution Reactions in the Cu-3 wt% Al-4 wt% Ag Alloy,” Materials Science and Engineering. A, Vol. 441, No. 1-2, 2006, pp. 259-265. doi:10.1016/j.msea.2006.08.055 [19] W. Scharfenberger, G. Schmitt and H. Borchers, “Über die Kinetik der Diskontinuierlichen Ausscheidung der Silberlegierung mit 7, 5 Gew-%Cu,” Zeitschrift für Met- allkunde, Vol. 63, 1972, pp. 553-560. [20] K. Matusita and S. Sakka, “Kinetic Study of Crystalliza- tion of Glass by Differential Thermal Analysis-Criterion on Application of Kissinger Plot,” Journal of Non-Cryst- alline Solids, Vol. 38, No. 2, 1980, pp. 741-746. doi:10.1016/0022-3093(80)90525-6 [21] P. Papon, J. Leblond and P. H. E. Meijer, “Physique des Transitions de Phases,” Dunod, Paris, 1999, pp. 212-373. [22] D. Duly and Y. Brechet, “Nucleation Mechanism of Dis- continuous Precipitation in Mg-Al Alloys and Relation with the Morphology,” Acta Metallurgical and Material, Vol. 42, No. 9, 1994, pp. 3035-3043. doi:10.1016/0956-7151(94)90400-6 [23] R. A. Fournelle and J. B. Clark, “Genesis of the Cellular Precipitation Reaction,” Metallurgical and Materials Transactions B, Vol. 3, 1972, pp. 2757-2767. Copyright © 2011 SciRes. MSA
|