 Materials Sciences and Applicatio n, 2011, 2, 848-858 doi:10.4236/msa.2011.27115 Published Online July 2011 (http://www.SciRP.org/journal/msa) Copyright © 2011 SciRes. MSA An Experimental Study of the Physicochemical Properties of a Cement Matrix Containing Dredged Materials Hongseob Oh1*, Juwon Lee1, N. Banthia2, S. Talukdar2 1Department of Civil Engineering, Gyeongnam National University of Science and Technology, Jinju, Kyeongnam, South Korea; 2Department of Civil Engineering, The University of British Columbia, Vancouver, Canada. Email: *opera69@chol.com Received April 7th, 2011; revised May 16th, 2011; accepted June 1st, 2011. ABSTRACT Recently, the amount of dredged soil material (DM) has been rapidly increasing in Korea due to four major river maintenance projects and new harbor construction. DM waste is mostly dumped into the ocean, while only a small part of it has been utilized fo r coastal reclaiming, or as filling and backfilling material. This study carried out physical and chemical tests to map out a specific plan for utilizing DM in a mortar mixture. The co mpressive strength tests and mi- crostructure analysis using XRD and SEM of cement mortar contained DM were performed as a replacement for fine aggregate or as a filler material of mortar matrix. The study measured the impact of contaminants contained in DM and how silt and clay influenced the compressive strength of the mortar. Keywords: Dre dged Soil Material , Mortar, X-Ray Diffraction, Cement Mortar, Compressive Strength, SEM 1. Introduction Recently, the amount of dredged soil material (DM) has been rapidly increasing in Korea due to four major river maintenance projects and new harbor construction. The amount of DM disposed of in the domestic designated dumping area in the sea in 2008 was approximately 1056 million tons, 2.6 times more than in 20 07. Moreover, the amount of DM is still increasing. The amounts of waste and generated DM for the past three years are shown in Figure 1. In China, 100 million m3 of DM is generated each year. In Germany, 60 million m3 of sediments contained in DM have been generated each year. In France, 3 million m3 of river sediments have been dredged for the past fifteen years [1-3]. When disposed of in a designated dumping area, DM may cause serious environmental problems in the nearby seawater. DM is an erosion deposit composed of sand, silt, clay, fishes, shells, heavy metals, and all kinds of contami- nants. The expansion of designated dumping areas and stockyards for DM has become a serious environmental issue. Although deposits of silt and clay, and many con- taminants, are difficult to reuse, the sand component of DM can be reused in various ways. A good number of research studies have been carried out in many countries to find suitable ways to reuse DM containing silt and clay components and contaminants. DM can be reused in material for cement composites [4], road construction [5], and brick production through proc- essing the deposit [6]. It can also be used to manufacture artificial aggregates [7], and in stability research as back- fill material [8]. The development of DM processing technology for eliminating contaminants contained in deposits has been actively carried out as well [3,9]. Other studies of DM utilization are in progress in Ko- rea, such as developing a flowing backfill material [10], developing a lightweight soil mixed with cement [11], processing suspended particles of DM using an agglom- eration—precipitation process [12], and processing of oyster shells to create solidification material [13]. How- ever, research of DM utilization as a concrete material is still insufficient. In the present study, mortar compressive strength tests were conducted from the lab results of physical and chemical tests to map out a specific plan for utilizing DM as a concrete mixture. The compressive strength tests were carried out based on an evaluation of the DM’s contamination level and by increasing the quantity of substituted material. We measured the impact of contami- 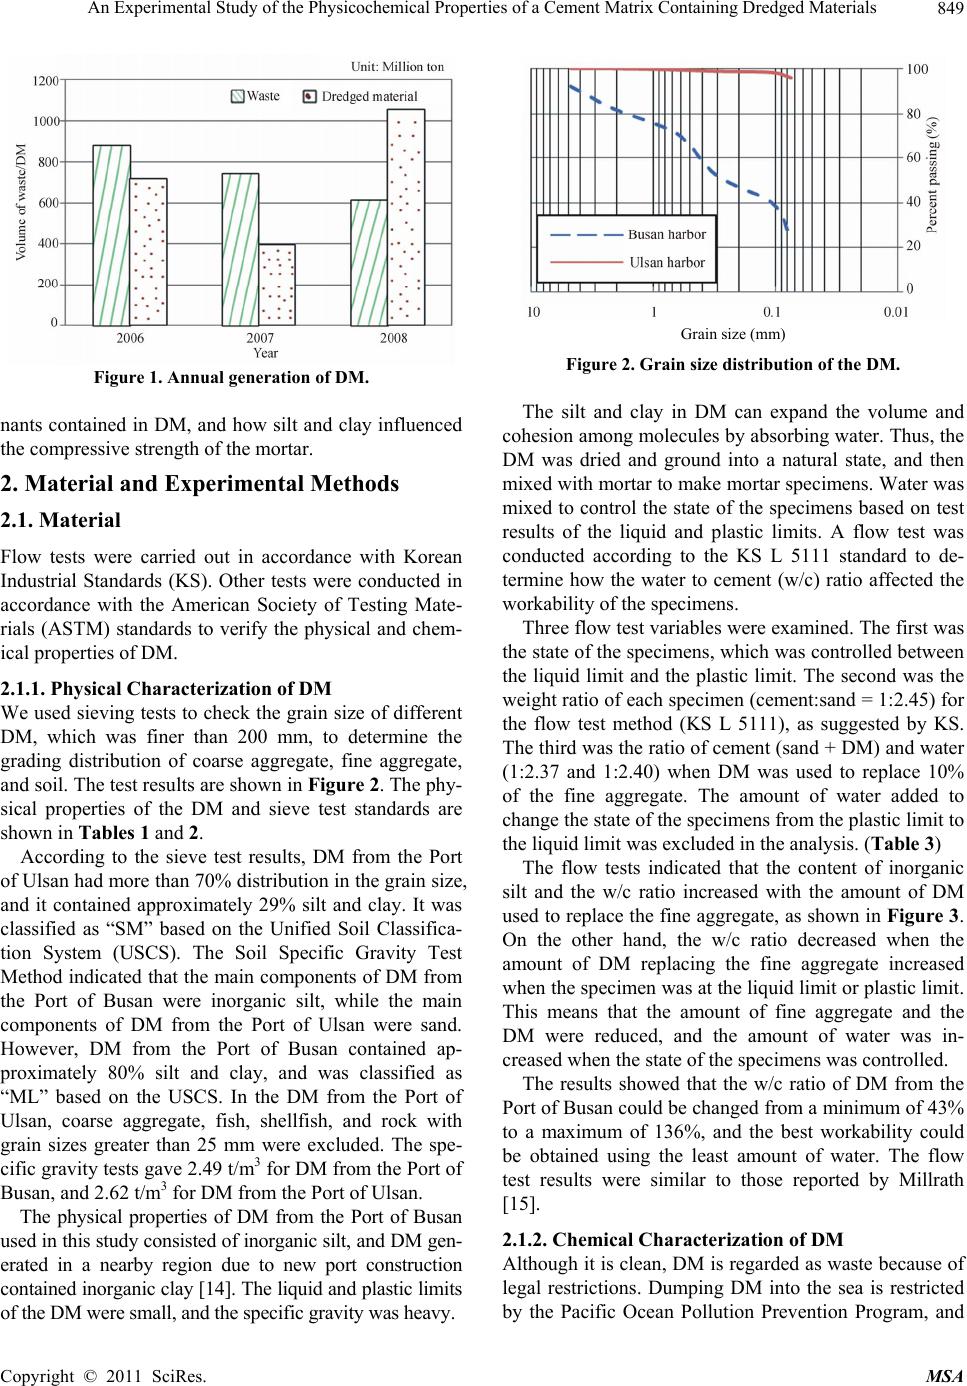 An Experimental Study of the Physicochemical Prope rties of a Cement Matrix Containing Dredged Materials849 Figure 1. Annual generation of DM. nants contained in DM, and how silt and clay influenced the compressive strength of the mortar. 2. Material and Experimental Methods 2.1. Material Flow tests were carried out in accordance with Korean Industrial Standards (KS). Other tests were conducted in accordance with the American Society of Testing Mate- rials (ASTM) standards to verify the physical and chem- ical properties of DM. 2.1.1. Physical Characterization of DM We used sieving tests to check the grain size of different DM, which was finer than 200 mm, to determine the grading distribution of coarse aggregate, fine aggregate, and soil. The test resu lts are shown in Figure 2. The phy- sical properties of the DM and sieve test standards are shown in Tables 1 and 2. According to the sieve test results, DM from the Port of Ulsan had more than 70% distribution in the grain size, and it contained approximately 29% silt and clay. It was classified as “SM” based on the Unified Soil Classifica- tion System (USCS). The Soil Specific Gravity Test Method indicated that the main components of DM from the Port of Busan were inorganic silt, while the main components of DM from the Port of Ulsan were sand. However, DM from the Port of Busan contained ap- proximately 80% silt and clay, and was classified as “ML” based on the USCS. In the DM from the Port of Ulsan, coarse aggregate, fish, shellfish, and rock with grain sizes greater than 25 mm were excluded. The spe- cific gravity tests gave 2.49 t/m3 for DM from the Port of Busan, and 2.62 t/m3 for DM from the Port of Ulsan. The physical properties of DM from the Port of Busan used in this study consisted of inorganic silt, and DM gen- erated in a nearby region due to new port construction contained inorganic clay [14]. The liquid and plastic limits of the DM were small, and the specific gravity was heavy. Grain size (mm) Figure 2. Grain size distribution of the DM. The silt and clay in DM can expand the volume and cohesion among molecules by absorbing water. Thus, the DM was dried and ground into a natural state, and then mixed with mortar to make mortar specimens. Water was mixed to control the state of the specimens based on test results of the liquid and plastic limits. A flow test was conducted according to the KS L 5111 standard to de- termine how the water to cement (w/c) ratio affected the workability of the specimens. Three flow test variables were examined. The first was the state of the specimens, which was controlled between the liquid limit and the plastic limit. The second was the weight ratio of each specimen (cement:sand = 1:2.45) for the flow test method (KS L 5111), as suggested by KS. The third was the ratio of cement (sand + DM) and water (1:2.37 and 1:2.40) when DM was used to replace 10% of the fine aggregate. The amount of water added to change the state of the specimens from the plastic limit to the liquid limit was excluded in the analysis. (Table 3) The flow tests indicated that the content of inorganic silt and the w/c ratio increased with the amount of DM used to replace the fine aggregate, as shown in Figure 3. On the other hand, the w/c ratio decreased when the amount of DM replacing the fine aggregate increased when the specimen was at the liqu id limit or p lastic limit. This means that the amount of fine aggregate and the DM were reduced, and the amount of water was in- creased when the state of the specimens was controlled. The results showed that the w/c ratio of DM from the Port of Busan could be changed from a minimum of 43% to a maximum of 136%, and the best workability could be obtained using the least amount of water. The flow test results were similar to those reported by Millrath [15]. 2.1.2. Chemical Characterization of DM Although it is clean, DM is regarded as waste because of legal restrictions. Dumping DM into the sea is restricted by the Pacific Ocean Pollution Prevention Program, and Copyright © 2011 SciRes. MSA 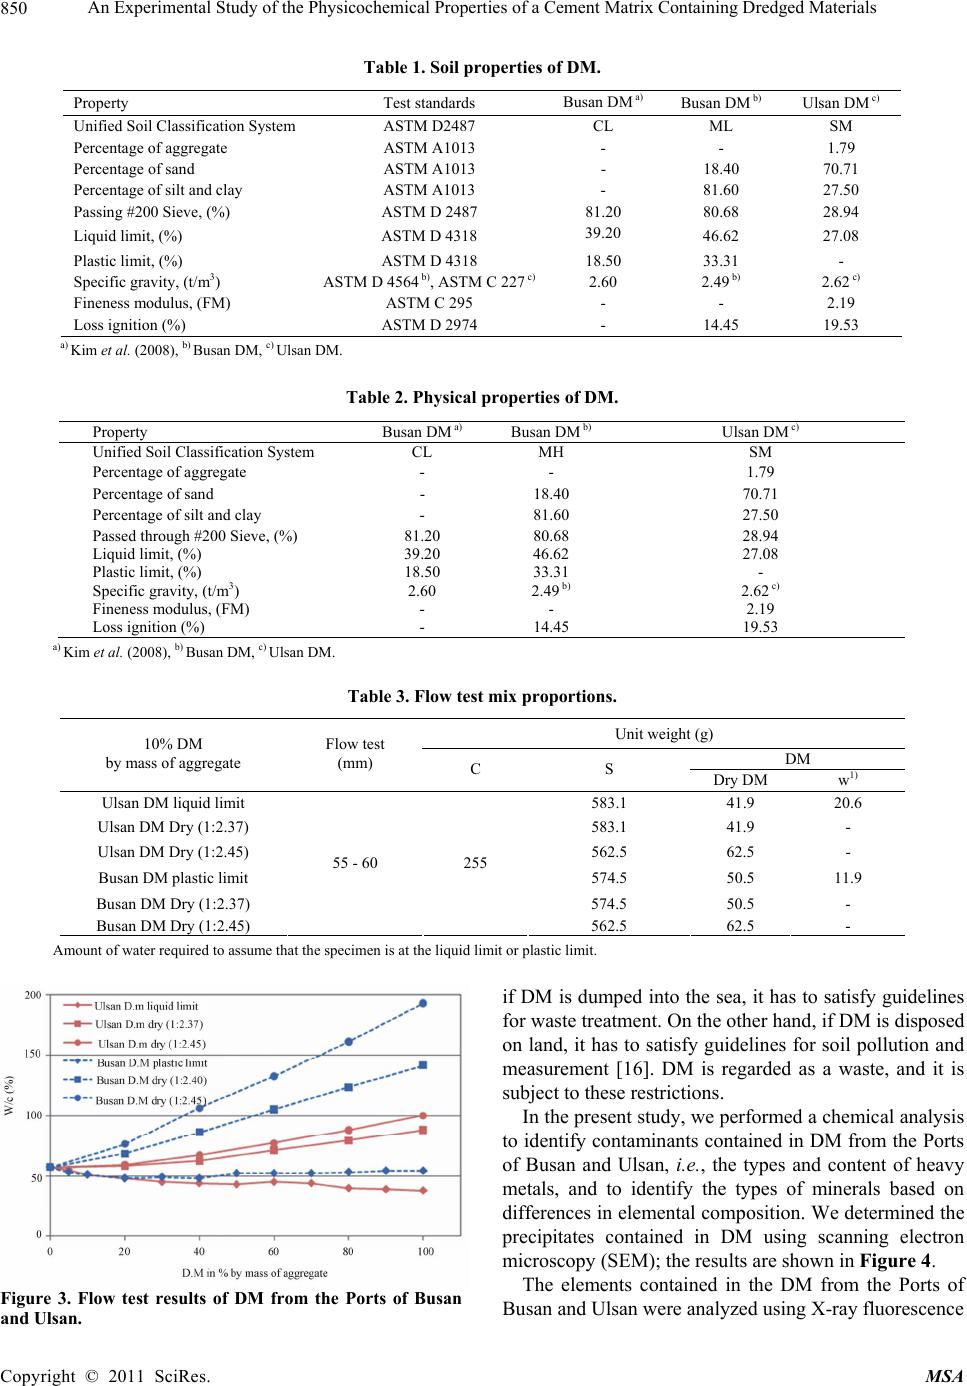 An Experimental Study of the Physicochemical Prope rties of a Cement Matrix Containing Dredged Materials 850 Table 1. Soil properties of DM. Property Test standards Busan DM a) Busan DM b) Ulsan DM c) Unified Soil Classification System ASTM D2487 CL ML SM Percentage of aggregate ASTM A1013 - - 1.79 Percentage of sand ASTM A1013 - 18.40 70.71 Percentage of silt and clay ASTM A1013 - 81.60 27.50 Passing #200 Sieve, (%) ASTM D 2487 81.20 80.68 28.94 Liquid limit, (%) ASTM D 4318 39.20 46.62 27.08 Plastic limit, (%) ASTM D 4318 18.50 33.31 - Specific gravity, (t/m3) ASTM D 4564 b), ASTM C 227 c)2.60 2.49 b) 2.62 c) Fineness modulus, (FM) ASTM C 295 - - 2.19 Loss ignition (%) ASTM D 2974 - 14.45 19.53 a) Kim et al. (2008), b) Busan DM, c) Ulsan DM. Table 2. Physical properties of DM. Property Busan DM a) Busan DM b) Ulsan DM c) Unified Soil Classification System CL MH SM Percentage of aggregate - - 1.79 Percentage of sand - 18.40 70.71 Percentage of silt and clay - 81.60 27.50 Passed through #200 Sieve, (%) 81.20 80.68 28.94 Liquid limit, (%) 39.20 46.62 27.08 Plastic limit, (%) 18.50 33.31 - Specific gravity, (t/m3) 2.60 2.49 b) 2.62 c) Fineness modulus, (FM) - - 2.19 Loss ignition (%) - 14.45 19.53 a) Kim et al. (2008), b) Busan DM, c) Ulsan DM. Table 3. Flow test mix proportions. Unit weight (g) DM 10% DM by mass of aggregate Flow test (mm) C S Dry DM w1) Ulsan DM liquid limit 583.1 41.9 20.6 Ulsan DM Dry (1:2.37) 583.1 41.9 - Ulsan DM Dry (1:2.45) 562.5 62.5 - Busan DM plastic limit 574.5 50.5 11.9 Busan DM Dry (1:2.37) 574.5 50.5 - Busan DM Dry (1:2.45) 55 - 60 255 562.5 62.5 - Amount of water required to assume that the specimen is at the liquid limit or plastic limit. Figure 3. Flow test results of DM from the Ports of Busan and Ulsan. if DM is dumped into the sea, it has to satisfy guidelines for waste treatment. On the other hand, if DM is disposed on land, it has to satisfy guidelines for soil pollution and measurement [16]. DM is regarded as a waste, and it is subject to these restrictions. In the present study, we performed a chemical analysis to identify conta minants contained in DM from the Ports of Busan and Ulsan, i.e., the types and content of heavy metals, and to identify the types of minerals based on differences in elemental comp osition. We determined the precipitates contained in DM using scanning electron microscopy (SEM); the results are shown in Figure 4. The elements contained in the DM from the Ports of Busan and Ulsan were analyzed using X-ray fluorescence Copyright © 2011 SciRes. MSA 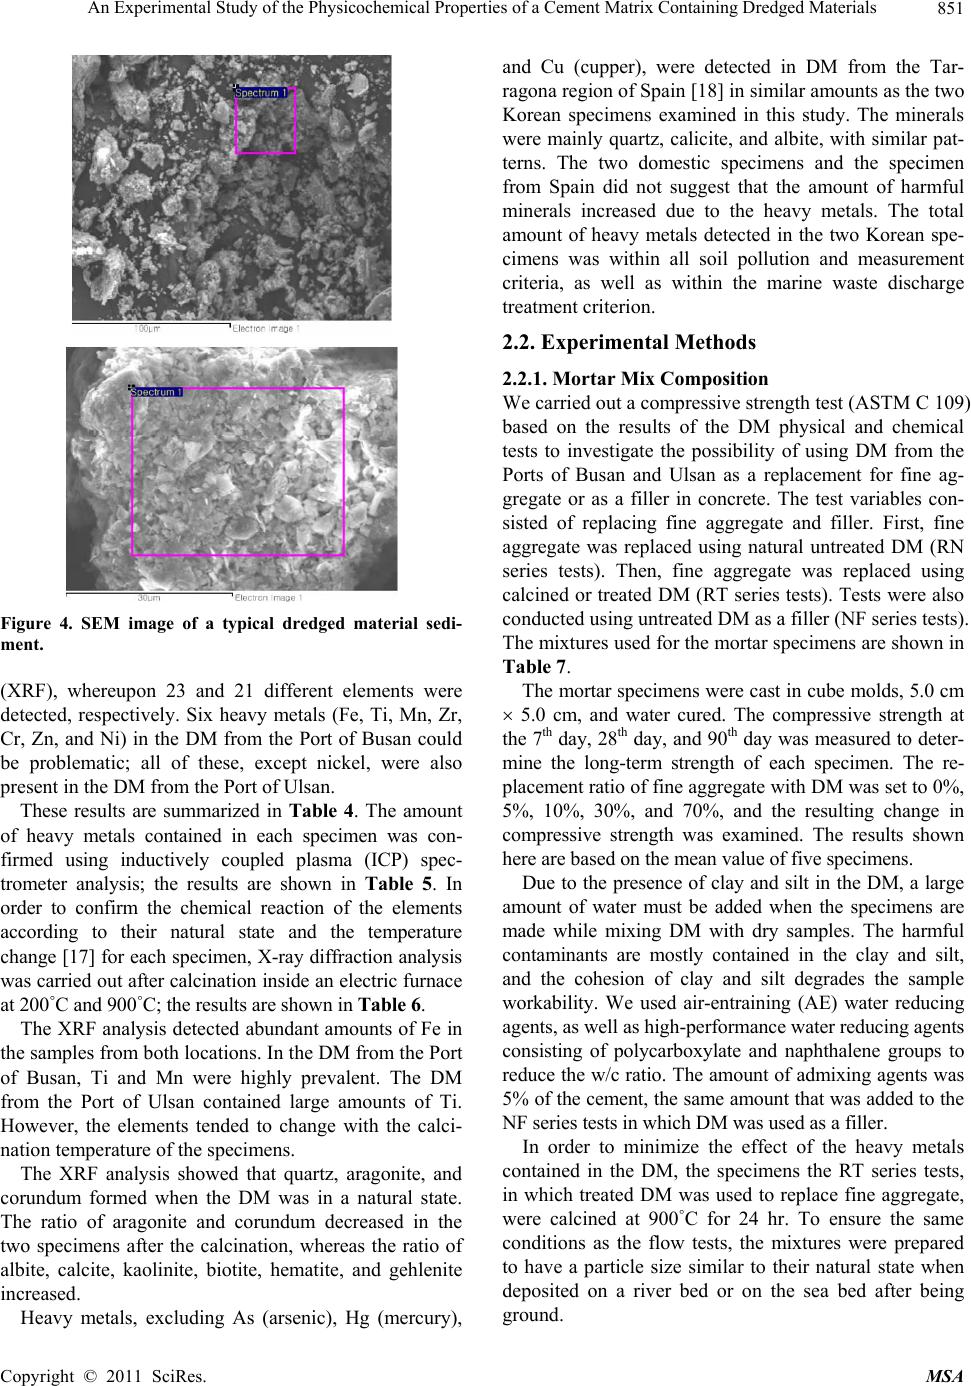 An Experimental Study of the Physicochemical Prope rties of a Cement Matrix Containing Dredged Materials851 Figure 4. SEM image of a typical dredged material sedi- ment. (XRF), whereupon 23 and 21 different elements were detected, respectively. Six heavy metals (Fe, Ti, Mn, Zr, Cr, Zn, and Ni) in the DM from the Port of Busan could be problematic; all of these, except nickel, were also present in the DM from the Port of Ulsan. These results are summarized in Table 4. The amount of heavy metals contained in each specimen was con- firmed using inductively coupled plasma (ICP) spec- trometer analysis; the results are shown in Table 5. In order to confirm the chemical reaction of the elements according to their natural state and the temperature change [17] for each specimen, X-ray diffraction analysis was carried out after calcination inside an electric furnace at 200˚C and 900˚C; the results are shown in Table 6. The XRF analysis detected abundant amounts of Fe in the samples from both locations. In the DM from the Port of Busan, Ti and Mn were highly prevalent. The DM from the Port of Ulsan contained large amounts of Ti. However, the elements tended to change with the calci- nation temperature of the specimens. The XRF analysis showed that quartz, aragonite, and corundum formed when the DM was in a natural state. The ratio of aragonite and corundum decreased in the two specimens after the calcination, whereas the ratio of albite, calcite, kaolinite, biotite, hematite, and gehlenite increased. Heavy metals, excluding As (arsenic), Hg (mercury), and Cu (cupper), were detected in DM from the Tar- ragona region of Spain [18] in similar amounts as the two Korean specimens examined in this study. The minerals were mainly quartz, calicite, and albite, with similar pat- terns. The two domestic specimens and the specimen from Spain did not suggest that the amount of harmful minerals increased due to the heavy metals. The total amount of heavy metals detected in the two Korean spe- cimens was within all soil pollution and measurement criteria, as well as within the marine waste discharge treatment criterion. 2.2. Experimental Methods 2.2.1. Mortar Mix Composition We carried out a compressive strength test (ASTM C 109) based on the results of the DM physical and chemical tests to investigate the possibility of using DM from the Ports of Busan and Ulsan as a replacement for fine ag- gregate or as a filler in concrete. The test variables con- sisted of replacing fine aggregate and filler. First, fine aggregate was replaced using natural untreated DM (RN series tests). Then, fine aggregate was replaced using calcined or treated DM (RT series tests). Tests were also conducted using untreated DM as a filler (NF series tests). The mixtures used for the mortar specimens are shown in Table 7. The mortar specimens were cast in cube molds, 5.0 cm 5.0 cm, and water cured. The compressive strength at the 7th day, 28th day, and 90th day was measured to deter- mine the long-term strength of each specimen. The re- placement ratio of fine aggregate with DM was set to 0%, 5%, 10%, 30%, and 70%, and the resulting change in compressive strength was examined. The results shown here are based on the m ean val ue of fi ve s pecimens. Due to the presence of clay and silt in the DM, a large amount of water must be added when the specimens are made while mixing DM with dry samples. The harmful contaminants are mostly contained in the clay and silt, and the cohesion of clay and silt degrades the sample workability. We used air-entraining (AE) water reducing agents, as well as high-performance water reducing agents consisting of polycarboxylate and naphthalene groups to reduce the w/c ratio. The amount of admixing agents was 5% of the cement, the same amount that was added to the NF series tests in which DM was used as a filler. In order to minimize the effect of the heavy metals contained in the DM, the specimens the RT series tests, in which treated DM was used to replace fine aggregate, were calcined at 900˚C for 24 hr. To ensure the same conditions as the flow tests, the mixtures were prepared to have a particle size similar to their natural state when deposited on a river bed or on the sea bed after being ground. Copyright © 2011 SciRes. MSA  An Experimental Study of the Physicochemical Prope rties of a Cement Matrix Containing Dredged Materials 852 Table 4. Heavy metals (%) in DM samples, as determined by X-ray fluorescence. Element Iron Fe Titan Ti Managnese Mn Zirconium Zr Chromium Cr Zinc Zn Nickel Ni Busan DM1) 7.31 0.62 1.10 0.04 0.02 0.03 0.01 Busan DM2) 7.87 0.09 0.11 0.04 0.03 0.02 0.01 Ulsan DM1) 2.21 0.27 0.05 0.02 0.04 0.01 - Ulsan DM2) 3.11 0.32 0.06 0.04 0.02 0.02 - 1)Natural DM. 2)900˚C plastic. Table 5. ICP spectrometer analysis results. Natural DM 900˚C plastic DM Element (Unit : mg/kg) Busan DM Ulsan DM Busan DM Ulsan DM Cr, <41), <102), <803) 0.03 0.13 0.18 0.03 Zn, <3001), <7002), <4103) 89.90 66.67 13.75 62.25 Ni, <401), <1002), <353) 24.63 8.27 21.35 7.00 1)Soil pollution concern criterion, 2)Soil pollution measurem ent criterion, 3)Marine waste discharge treatment criterion. Table 6. Mineralogical identification of DM samples, by X-ray diffraction. Mineral Spain4) Busan1) Busan2) Busan3) Ulsan1) Ulsan2) Ulsan3) Quartz SiO2 xxx xxx xxx xxx xxx xxx xxx Aragonite CaCO3 xx xx Corundum Al2O3 x x Albite NaAlSi3O8 x x xx xx Xx Calcite CaCO3 xx x x x Kaolinite Al2Si2O5(OH) 4 x x Biotite K(Mg,Fe) 3AlSi3O10(OH) 2 x Hematite Fe2O3 x x x Gehlenite Ca2Al2SiO7 x 1)Natural DM. 2)200˚C pl astic. 3)900˚C pl astic. 4)Spanish dredged marin [17]; Note: xxx, major components; xx, secondary components; x, minority components or possible. Table 7. Compressive strength test mix proportions. Sand (%) Unit weight (g) w DM + w Series Flow (mm) Sand DM Busan c s Ulsan DMUlsan wBusan w Admix. remarks RN-B,U-B0 100 - 0 0 625- - - RN-B,U-B51) 95 5 25 21 59431 5.98 10.31 RN-B,U-B10 90 10 51 42 562 63 11.95 20.62 RN-B,U-B30 70 30 15212643718835.85 61.85 RN-B,U-B50 50 50 25120931263 61.48 103.09 RN-B,U-B70 30 70 35429318718883.62 144.32 - natural condi- tion RN-B,U-C10 90 10 51 42 562 63 11.95 20.62 RN-B,U-C30 70 30 15212643718835.85 61.85 Polycar boxylate RN-B,U-D10 90 10 51 42 562 63 11.95 20.62 RN-B,U-D30 70 30 15212643763 35.85 61.85 naphthalene RN-B,U-E10 90 10 51 42 56263 11.95 20.62 RN-B,U-E30 70 30 15212643718835.85 61.85 naphthalene RN-B,U-F10 90 10 51 42 56263 11.95 20.62 RN-B,U-F30 70 30 15212643718835.85 61.85 Polycar boxylate RT-B,U-A10 90 10 51 42 56263 11.95 20.62 Replacement Material RT-B,U-A30 70 30 15212643718835.85 61.85 12.75 900˚C calcination NF-B,U-A5 95 5 14014012.8 NF-B,U-A10 90 10 14014325.5 Filler Material NF-B,U-A30 55 - 60 70 30 150171 255 625 76.5 - natural condi- tion Copyright © 2011 SciRes. MSA  An Experimental Study of the Physicochemical Prope rties of a Cement Matrix Containing Dredged Materials 853 Authors assumed that the state of the specimens from the Port of Ulsan was at the liquid limit, and the state of the specimens from the Port of Busan was at the plastic limit. The specimens were mixed according to th e weight ratio (cement:fine aggregates = 1:2.45). The mortar spe- cimens were made by adjusting the w/c ratio so that the flow test value for obtaining the optimal workability sat- isfied a range of 55 - 60 mm. 3. Experimental Results The compressive strength of mortar specimens made by mixing DM from the Ports of Busan and Ulsan at a fixed ratio is shown in Figure 5. The RN-B, U-A series, as explained at Table 7, were performed by fixing the w/c ratio at 45%. In contrast to the RN-B series, the flow test results of U-B series in- creased as the replacement of fine aggregate with DM increased. The compressive strength was excluded from the present analysis since it was very small. Also, the mix proportion of dredged material was the best when the ratio of DM used to replace fine aggregate and the ratio mixed with DM filler were 10%. A comparative analysis was carried out using a 10% mixing ratio. The results of the compressive strength tests for the RN-B-B series as the amount of DM from the Port of Busan used to replace fine aggregate increased showed that the compressive streng th tended to decrease until the amount of DM was 10%, but it increased by 1.63 MPa when the amount of DM was 30%. Beyond this point, the compressive strength decreased as the amount of DM continued increased. On the other hand, the RN-U-B series showed maximum compressive strength of 32.31 MPa when the amount of DM was 10%. As the amount of DM increased, the compressive strength decreased by 3.34 MPa, which was considerably less than the 16.26 MPa reduction observed for the Port of Busan DM. On the other hand, in the flow tests, the reduction range for the Port of Ulsan DM was 23 mm. This increased with the amount of DM. However, the Port of Busan DM flow test value was 12 mm, or about 50% less than that of the Port of Ulsan DM. The inor- ganic silt, which was the main component of the Port of Busan DM, absorbs water and causes cohesion between molecules. This may have lowered the flow test results, as shown in Figure 5. The test results for specimens with added AE and high-performance water reducing agents to limit the in- crease of the w/c ratio when using DM in the mixture are shown in Figures 6(a) and (b). RN-B-C10 mixed with a polycarboxylate water reducing agent showed that the effect on the compressive strength was minimal after 7 days. However, the compressive strength increased by 4.08 MPa after 28 days. On the other hand, RN-B-D10 mixed with a water reducing agent from the naphthalene group showed the same w/c reduction rate of 8% as RN-B-C10, but the overall compressive strength was high after 7 and 28 days. Accordingly, a naphthalene water reducing agent appeared to be more efficient than a polycarboxylate water reducing agent when used with DM containing inorganic silt ingredients. The 28-day compressive strength of RN-U-C mixed with a polycarboxylate water reducing agent increased by 0.18 MPa, in the same way as RN-B-C10. However, it had a w/c ratio of 11%, a reduction of 4% compared with RN-U-D10 mixed with a naphthalene water reducing agent. The overall compressive strength at each test day increased in the same way as RN-B-D10. Therefore, a polycarboxylate water reducing agent is more efficient Figure 5. RN-B,U series compressive strength test result. Copyright © 2011 SciRes. MSA  An Experimental Study of the Physicochemical Prope rties of a Cement Matrix Containing Dredged Materials 854 (a) (b) Figure 6. RN-B,U-B,C,D,E,F series compressive strength test results. (a) RN-B-B,C,D,E,F series; (b) RN-U-B,C,D,E, F series. than a naphthalene water reducing agent for DM from the Port of Ulsan. The compressive strength test results for specimens made using a high-performance water reducing agent to reduce the w/c ratio and increase the compressive strength are shown in Figures 6(a) and (b). RN-B-E10 mixed with a naphthalene high-performance water re- ducing showed a 10% reduction in the w/c ratio and an increase in the overall compressive strength over all test days. RN-B-F10 mixed with a polycarboxylate high- performance water reducing agent also showed an in- crease in overall compressive strength and a 12% reduc- tion in the w/c ration over all test days. The RN-B-E10 strength increased by 0.48 MPa for the initial 7-day test compared to RN-B-F10, and by 0.38 MPa for the 28-day test. However, RN-B-F10 increased by 4.12 MPa for the 90-day compressive strength test with a 12% reduction in the w/c ratio. Thus, a naphthalene high-performance wa- ter reducing agent was more efficient than a polcarboxy- late high-performance water reducing agent for the Port of Busan DM. Overall, a w/c ratio reduction and an increase in com- pressive strength wer e confirmed for RN-U-E10 and F10. RN-B-F10 mixed with a polycarboxylate high-perfor- mance water reducing agent showed a 13% reduction in the w/c ratio and an increase of 8.46 MPa in compressive strength. RN-U-B10 showed a 79% increase in compres- sive strength. Accordingly, it was verified that a poly- carboxylate high-performance water reducing agent is more efficient as an admixing agent for Port of Ulsan DM. The compressive strength test results for the NF series, in which DM was used as a filler, and the RT series, in which DM was calcined at 900˚C to remove impurities and reduce the effect of heavy metals using the principle that the particle diameter of clay and silt contained in Copyright © 2011 SciRes. MSA  An Experimental Study of the Physicochemical Prope rties of a Cement Matrix Containing Dredged Materials855 DM is smaller than the particle size of fine aggregate, is shown in Figures 7(a) and (b). RT-B-A10 and A30 used to replace fine aggregate af- ter calcination for the Port of Busan DM showed a 1% - 2% reduction of the w/c ratio, and their compressive strength was also reduced. The NF-B-A series using DM as a filler also had a redu ced co mpressive strength. When the specimens were dry, the w/c ratio tended to increase with the amount of DM. The w/c ratio increased by 1% when 10% DM was used as a filler, while the w/c ratio increased by 12% for RN-B-B0 when 10% DM was used as a filler. RT-U-A10 and A30, in which Port of Ulsan DM was used as a filler, showed the same percentage reductions in the w/c ratio and compressive strength as the RT-B-A series. We hypothesize that the reduction in compressive strength was due to th e reduction of aragonite and albite, leading to a positive influence on the strength and dura- bility of concrete due to the calcinations of the two specimens as well as an increase in the amount of harm- ful hematite, albite, and calcite. Port of Busan DM had a content limit for clay and silt. As a result, a clear stan- (a) (b) Figure 7. RN, RT, NF-B, U-A10, A30 series compressive strength te st results. (a) RN, RT, NF-B-A10, A30 series; (b) RN, RT, NF-U-A10, A30 series. Copyright © 2011 SciRes. MSA  An Experimental Study of the Physicochemical Prope rties of a Cement Matrix Containing Dredged Materials 856 dard for the mixture must be prepared when DM is re- used as a material for concrete. The results of SEM analysis at 28 days are depicted in Figure 8. The combi- nation of cement and salt accelerate the hydration of C3S hydration and then the setting of cement matrix and the initial strength caused by vigorous precipitation (crystalli- zation) of calcium silicate hydrate are actively promoting and increasing, respectively. In the case of RN-B-C10 Specimen Busan Dredged Material Ulsan Dredged Material RN-B-B10 RN-U-B10 RN-B-C10 RN-U-C10 RN-B-D10 RN-U-D10 RN-B-E10 RN-U-E10 RN-B-F10 RN-U-F10 RT-B-A10 RT-U-A10 RT-B-B10 RT-U-B10 NF-B-A10 NF-U-A10 Figure 8. SEM analysis result. Copyright © 2011 SciRes. MSA  An Experimental Study of the Physicochemical Prope rties of a Cement Matrix Containing Dredged Materials 857 be used polycarboxylate water-reducing agent, the agent rapidly react with Albite and Corundum contained in dredged material and then generate the ettringite and then the ettringite generated around the cement and dredged material controls the hydration reaction of cement matrix. RN-U-D10, E10 used naphthalene reducing agent and superplasticizer, respectively, show what the products of the rosette morphology by alkali - silica reaction was formed. 4. Conclusions Physical and chemical test results were conducted on DM to investigate its possible reuse as concrete mixing material. The particle size analysis for the two types of material, DM from the Ports of Busan and Ulsan, showed that the Port of Ulsan DM contained approximately 70% fine aggregates, and was classified as “SM” by the Uni- fied Soil Classification System, while the Port of Busan DM contained 80% inorganic silt, and was classified as “ML”. In the flow tests, as the amount of DM increased, the w/c ratio increased for the DM from the Ports of Busan and Ulsan in a dried natural state. The w/c ratio de- creased when the state of the specimens was at their liq- uid or plastic limits, although the amount of DM in- creased. The w/c ratio increased with the amount of DM because the silt and clay compositions contained in the DM absorb water, expanding the volume material and generating cohesion power. The w/c ratio could be re- duced to a minimum of 43% or a maximum of 136%, and the optimal workability of the material could be ob- tained using DM in the liq uid state at the plastic limit. The heavy metals contained in the Port of Busan DM were Fe, Ti, Mn, Zr, Cr, Zn, and Ni. The Port of Ulsan DM also contained these heavy metals, except for Ni. Among these heavy metals, the content of Cr, Zn, and Ni satisfied the marine discharge treatment criterion and the soil pollution co ncern and measurement criteria. The X-ray diffraction analysis showed that the miner- als contained in the DM when it was in its natural state were mostly quartz, aragonite, and corundum. After calination of specimens, the ratio of aragonite and co- rundum decreased whereas the ratio of albite, calcite, kaolinite, biotite, hematite, and gehlenite increased. As the amount of aragonite and corundum, which are bene- ficial to concrete, decreased, the compressive strength of the RT-B,U-A10, A30 series mixed after calcination also decreased. The compressive strength was the highest when the amount of DM used to replace fine aggregate was 10%. The compressive strength of concrete increased when DM from the Port of Busan was used to replace up to 39% of the fine aggregates. Therefore, the amount of fine aggregate replaced by DM can be increased beyond 10%. When DM was used as a replacement material for fine aggregate, a lot of water was required due to the water absorption force of the clay and silt. Accordingly, AE or high-performance water reducing agents were used to reduce the w/c ratio by up to 13%, and to increase the compressive strength by approximately 70%. This study demonstrated the possibility of using DM as a mixing material for concrete. An additional study is now in progress to examine the amount of DM permissi- ble in concrete mixtures and the states of DM that are acceptable. Studies are also investigating efficient ways to treat contaminants in DM. 5. Acknowledgments This research was supported by Basic Science Research Program through the National Research Foundation of Korea (NRF) funded by the Ministry of Education, Sci- ence and Technology. (2009-0064233, 313-2007-2- D00793) REFERENCES [1] H. Q. Zhang, J. Xie, W. Zhu, Y. Z. Huang and P. Shi, “Present Situation of Dredged Materials Dumping and the Study of Transforming Dredged Mud into Regenerative Resources—Difficulties of Refuses Dumping in China Seas and Countermeasures to Deal with These Problems,” Marine Science Bulletin, Vol. 23, No. 6, 2004, pp. 54-60. [2] K. Hamer and V. Karius, “Brick Production with Dredged Harbour Sediments: An Industrial-Scale Experiment,” Waste Management, Vol. 22, No. 5, 2002, pp. 521-530. doi:10.1016/S0956-053X(01)00048-4 [3] Z. Lafhaj, M. Samara, F. Agostini, L. Boucard, F. Skoc- zlas and G. Depelsenaire, “Polluted River Sediments from the North Region of France: Treatment with Novosol Process and Valorization in Clay Bricks,” Construction and Building Materials, Vol. 22, No. 5, 2008, pp. 755-762. doi:10.1016/j.conbuildmat.2007.01.023 [4] F. Agostini, F. Skoczylas and Z. Lafhaj, “About a Possi- ble Valorization in Cementitious Materials of Polluted Sediments after Treatment,” Cement and Concrete Com- posites, Vol. 29, No. 4, 2007, pp. 270-278. doi:10.1016/j.cemconcomp.2006.11.012 [5] R. Zentar, V. Dubois and N. E. Abriak, “Mechanical Be- havior and Environmental Impacts of a Test Road Built with Marine Dredged Sediments,” Resources, Conserva- tion and Recycling, Vol. 52, No. 6, 2008, pp. 947-954. doi:10.1016/j.resconrec.2008.02.002 [6] M. Samara, Z. Lafhaj and C. Chapiseau, “Valorization of Stabilized River Sediments in Fired Clay Bricks: Factory Scale Experiment,” Journal of Hazardous Materials, Vol. 163, No. 2-3, 2009, pp. 701-710. doi:10.1016/j.jhazmat.2008.07.153 [7] C. Huang, J. R. Pan and Y. Liu, “Mixing Water Treat- ment Residual with Excavation Waste Soil in Brick and Copyright © 2011 SciRes. MSA  An Experimental Study of the Physicochemical Prope rties of a Cement Matrix Containing Dredged Materials Copyright © 2011 SciRes. MSA 858 Artificial Aggregate Making,” Journal of Environmental Engineering, Vol. 131, No. 2, 2005, pp. 272-278. doi:10.1061/(ASCE)0733-9372(2005)131:2(272) [8] A. Maher, W. S. Douglas and F. Jafari, “Field Placement And Evaluation of Stabilized Dredged Material(SDM) from the New York/New Jersey Harbor,” Marine Geore- sources and Geotechnology, Vol. 24, No. 4, 2006, pp. 251-263. doi:10.1080/10641190600788460 [9] P. K. Ndiba and L. Axe, “Sequential Extraction Phos- phate- and Thermal-Treated New York/New Jersey Har- bor Dredged Sediments,” Environmental Engineering Sci- ence, Vol. 26, No. 12, 2009, pp. 1755-1764. doi:10.1089/ees.2009.0215 [10] J.-D. Kim, K.-H. Lee and B.-S. Lee, “Mechanical Proper- ties of Controlled Low Strength Materials,” Korea Soci- ety of Hazard Mitigation, Vol. 2, No. 2, 2007, pp. 35-44. [11] Y.-T. Kim, H.-J. Kim and Y.-K. Kwon, “Compressive Strength Characteristics of Cement Mixing Lightweight Soil for Recycling of Dredged Soil in Nakdong River Es- tuary,” Journal of Ocean Engineering and Technnology, Korea Society of Civil Engineering. Vol. 20, No. 1, 2006, 7-15. [12] C.-Y. Lee and B.-U. Bae, “Treatment of Suspened Soilds in Dredged Material Using Coagulation-Sedimentation Processes,” Korea Society of Civil Engineering, Vol. 2003, No. 10, 2003. [13] G. L. Yoon, K. S. Chae, S. C. Baek and J. K. Kim, “Strength Characteristics of Dredged Clay Treated by Oyster Sheel-Binder,” Korea Society of Civil Engineering. Vol. 2004, No. 10, 2004, pp. 1386-1391. [14] Y. T. Kim, H. J. Kim and G. H. Lee, “Mechanical Be- havior of Lightweight Soil Reinforced with Waste Fish- ing Net,” Geotextiles and Geomembranes, Vol. 26, No. 6, 2008, pp. 512-518. doi:10.1016/j.geotexmem.2008.05.004 [15] K. Millrath, “Modifying Concrete Material with Benefi- ciated Dredged Material or Other Clayey Constituents,” Columbia University, New York, 2003. [16] J. T. Park, “A Study on Compositions Utilization of Ma- rine Sediments (dredged material) in Major Harbor,” KwangWoon University, Seoul, 2007. [17] J. H. Ham and C. G. Yoon, “Thermal Treatment of Dredged Material and Reuse,” Journal of Agricultural Resources Development, Vol. 21, 1999, pp. 7-13. [18] J. Limeira, L. Agullo and M. Etxeberria, “Dredged Ma- rine Sand in Concrete: An Experimental Section of a Har- bor Pavement,” Construction and Building Materials, Vol. 24, No. 6, 2009, pp. 863-870. doi:10.1016/j.conbuildmat.2009.12.011 [19] V. Bart, De Vos Bruno and M. G. Tack Filip, “Heavy Metal Contents in Surface Soil along the Upper Scheldt river(Belgium) Affected by Historical Upland Disposal of Dredged Materials,” The Science of the Total Environ- ment, Vol. 290, No. 1-3, 2002, pp. 1-14. doi:10.1016/S0048-9697(01)00966-4
|