Paper Menu >>
Journal Menu >>
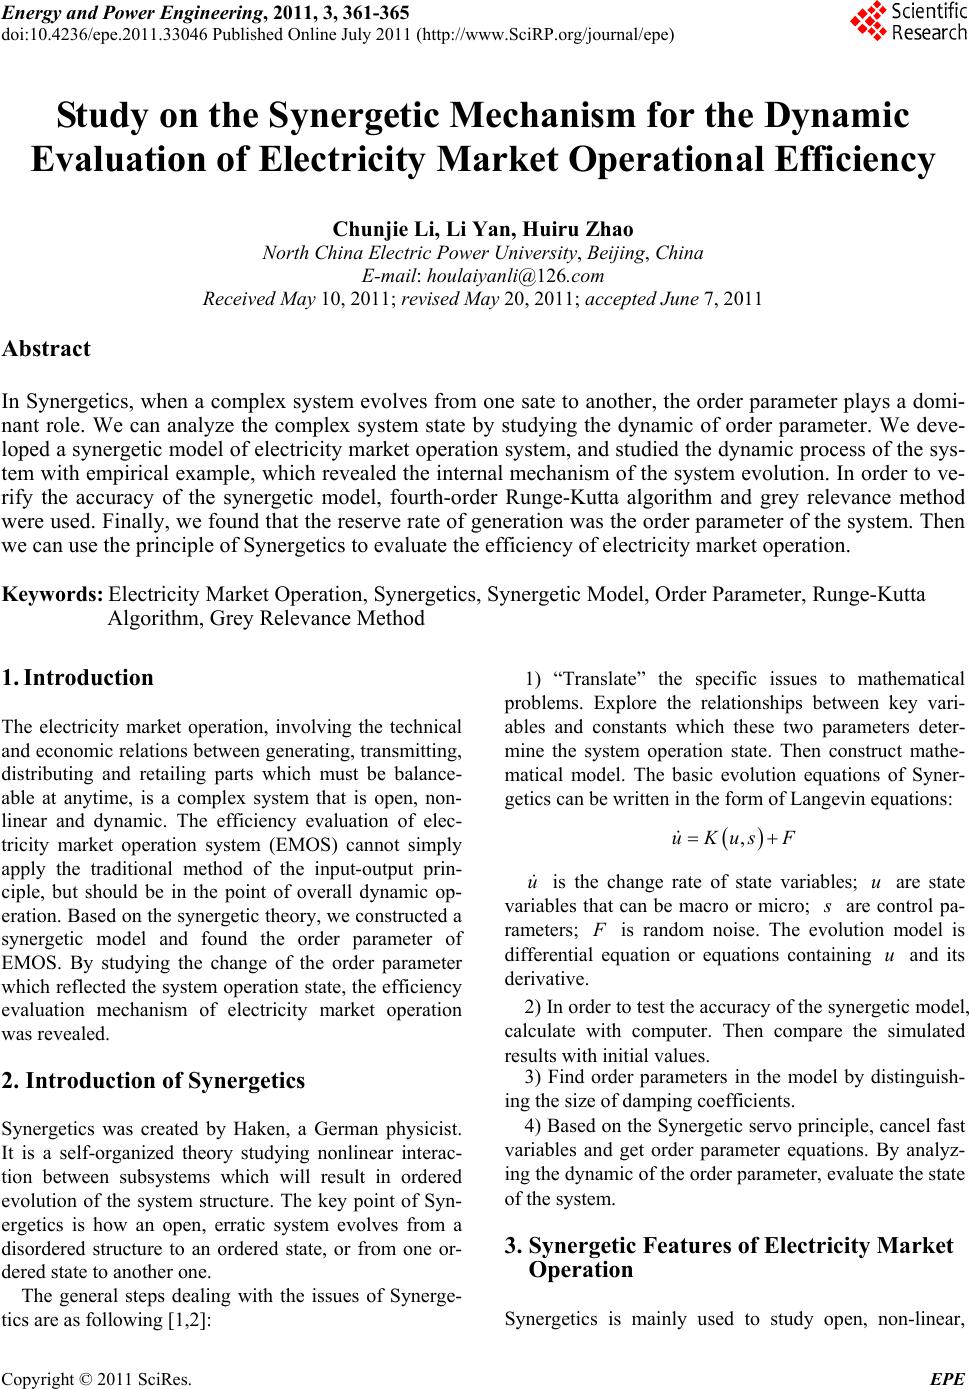 Energy and Power En gi neering, 2011, 3, 361-365 doi:10.4236/epe.2011.33046 Published Online July 2011 (http://www.SciRP.org/journal/epe) Copyright © 2011 SciRes. EPE Study on the Synergetic Mechanism for the Dynamic Evaluation of Electricity Market Operational Efficiency Chunjie Li, Li Yan, Huiru Zhao North China Electric Power University, Beijing, China E-mail: houlaiyanli@126.com Received May 10, 2011; revised May 20, 2011; accepted June 7, 2011 Abstract In Synergetics, when a complex system evolves from one sate to another, the order parameter plays a domi- nant role. We can analyze the complex system state by studying the dynamic of order parameter. We deve- loped a synergetic model of electricity market operation system, and studied the dynamic process of the sys- tem with empirical example, which revealed the internal mechanism of the system evolution. In order to ve- rify the accuracy of the synergetic model, fourth-order Runge-Kutta algorithm and grey relevance method were used. Finally, we found that the reserve rate of generation was the order parameter of the system. Then we can use the principle of Synergetics to evaluate the efficiency of electricity market operation. Keywords: Electricity Market Operation, Synergetics, Synergetic Model, Order Parameter, Runge-Kutta Algorithm, Grey Relevance Method 1. Introduction The electricity market operation, involving the technical and economic relations b etween generating, tran smitting, distributing and retailing parts which must be balance- able at anytime, is a complex system that is open, non- linear and dynamic. The efficiency evaluation of elec- tricity market operation system (EMOS) cannot simply apply the traditional method of the input-output prin- ciple, but should be in the point of overall dynamic op- eration. Based on the synergetic theory, we constructed a synergetic model and found the order parameter of EMOS. By studying the change of the order parameter which reflected the system operation state, the efficiency evaluation mechanism of electricity market operation was revealed. 2. Introduction of Synergetics Synergetics was created by Haken, a German physicist. It is a self-organized theory studying nonlinear interac- tion between subsystems which will result in ordered evolution of the system structure. The key point of Syn- ergetics is how an open, erratic system evolves from a disordered structure to an ordered state, or from one or- dered state to another one. The general steps dealing with the issues of Synerge- tics are as following [1,2]: 1) “Translate” the specific issues to mathematical problems. Explore the relationships between key vari- ables and constants which these two parameters deter- mine the system operation state. Then construct mathe- matical model. The basic evolution equations of Syner- getics can be written in the form of Langevin equations: ,uKus F u is the change rate of state variables; are state variables that can be macro or micro; u s are control pa- rameters; F is random noise. The evolution model is differential equation or equations containing and its derivative. u 2) In order to test the accuracy of the synergetic model, calculate with computer. Then compare the simulated results with initial values. 3) Find order parameters in the model by distinguish- ing the size of damping coefficients. 4) Based on the Synergetic servo principle, cancel fast variables and get order parameter equations. By analyz- ing the dynamic of the order parameter, evaluate the state of the system. 3. Synergetic Features of Electricity Market Operation Synergetics is mainly used to study open, non-linear, 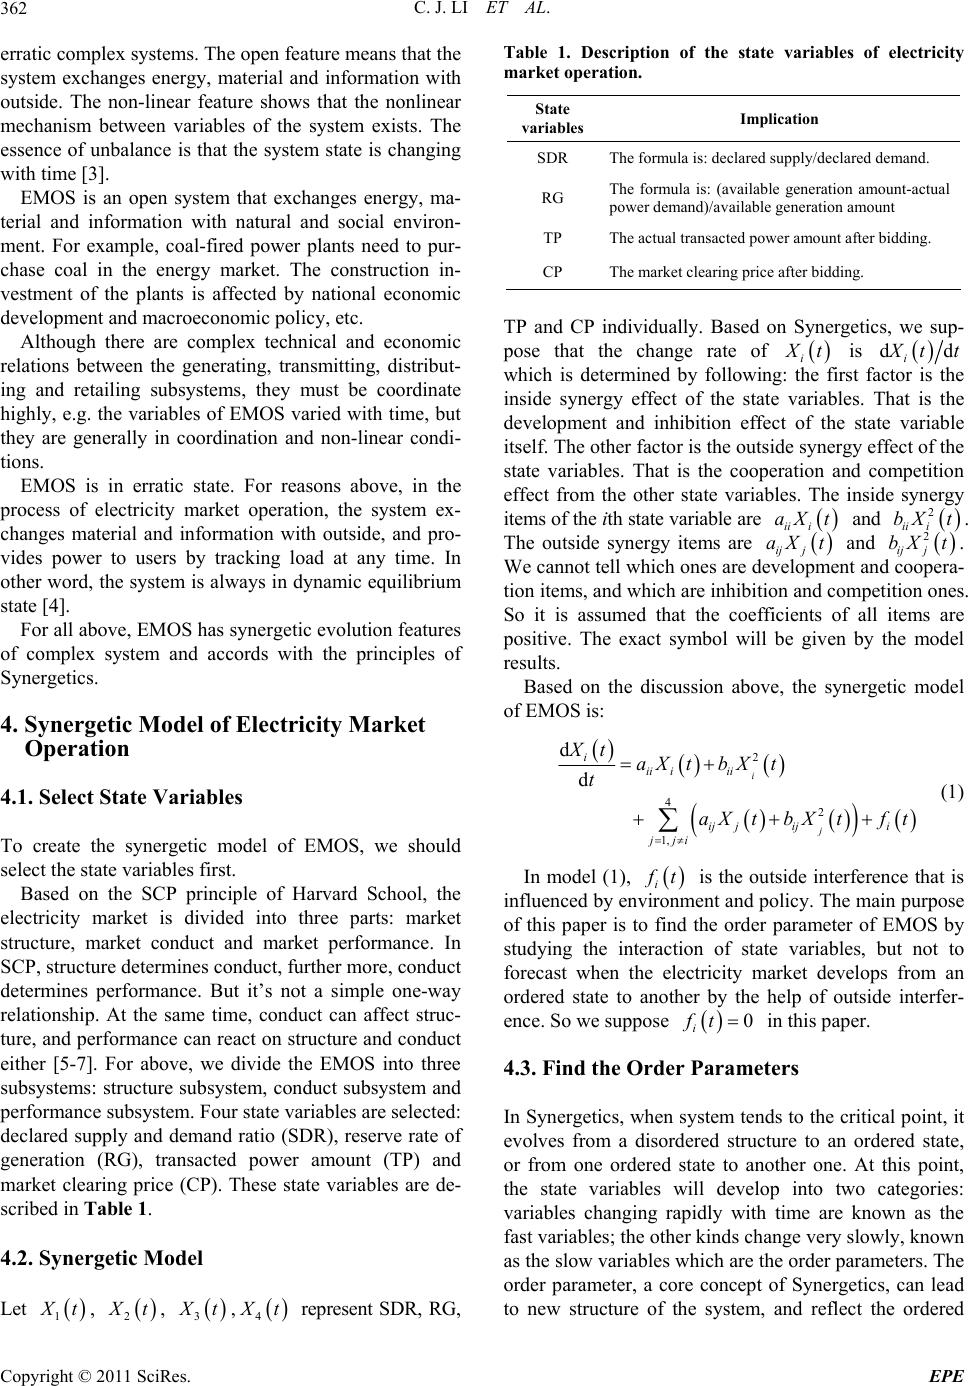 C. J. LI ET AL. 362 erratic complex systems. The open feature means that the system exchanges energy, material and information with outside. The non-linear feature shows that the nonlinear mechanism between variables of the system exists. The essence of unbalance is that the system state is changing with time [3]. EMOS is an open system that exchanges energy, ma- terial and information with natural and social environ- ment. For example, coal-fired power plants need to pur- chase coal in the energy market. The construction in- vestment of the plants is affected by national economic development and macroeconomic policy, etc. Although there are complex technical and economic relations between the generating, transmitting, distribut- ing and retailing subsystems, they must be coordinate highly, e.g. the variables of EMOS varied with time, but they are generally in coordination and non-linear condi- tions. EMOS is in erratic state. For reasons above, in the process of electricity market operation, the system ex- changes material and information with outside, and pro- vides power to users by tracking load at any time. In other word, the system is always in dynamic equilibrium state [4]. For all above, EMOS has synergetic evolution features of complex system and accords with the principles of Synergetics. 4. Synergetic Model of E lectricit y Market Operation 4.1. Select State Variables To create the synergetic model of EMOS, we should select the state variables first. Based on the SCP principle of Harvard School, the electricity market is divided into three parts: market structure, market conduct and market performance. In SCP, structure determines conduct, further more, conduct determines performance. But it’s not a simple one-way relationship. At the same time, conduct can affect struc- ture, and performance can react on structure and conduct either [5-7]. For above, we divide the EMOS into three subsystems: structure subsystem, conduct subsystem and performance subsystem. Four state variables are selected: declared supply and demand ratio (SDR), reserve rate of generation (RG), transacted power amount (TP) and market clearing price (CP). These state variables are de- scribed in Table 1. 4.2. Synergetic Model Let 1 X t, 2 X t, 3 X t, 4 X t represent SDR, RG, Table 1. Description of the state variables of electricity market operation. State variables Implication SDR The formula is: de cl ared supply/declared demand. RG The formula is: (available generation amount-actual power demand)/available generation amount TP The actual transacted power amount after bidding. CP The market clearing price after bidding. TP and CP individually. Based on Synergetics, we sup- pose that the change rate of i X t is dd i X tt which is determined by following: the first factor is the inside synergy effect of the state variables. That is the development and inhibition effect of the state variable itself. The other factor is the outside synergy effect of the state variables. That is the cooperation and competition effect from the other state variables. The inside synergy items of the ith state variable are and ii i aX t 2 ii i bXt . The outside synergy items are and ij j aX t 2 ij j bXt . We cannot tell which ones are development and coopera- tion items, and which are inhibition and competition ones. So it is assumed that the coefficients of all items are positive. The exact symbol will be given by the model results. Based on the discussion above, the synergetic model of EMOS is: 2 42 1, d d i j iii iii ij jiji jji Xt aX tbXt t aXtbXtf t (1) In model (1), i f t is the outside interference that is influenced by environment and policy. The main purpose of this paper is to find the order parameter of EMOS by studying the interaction of state variables, but not to forecast when the electricity market develops from an ordered state to another by the help of outside interfer- ence. So we suppose 0ft i in this paper. 4.3. Find the Order Parameters In Synergetics, when system tends to the critical po int, it evolves from a disordered structure to an ordered state, or from one ordered state to another one. At this point, the state variables will develop into two categories: variables changing rapidly with time are known as the fast variables; the other kinds change very slowly, known as the slow variables which are the order parameters. The order parameter, a core concept of Synergetics, can lead to new structure of the system, and reflect the ordered Copyright © 2011 SciRes. EPE 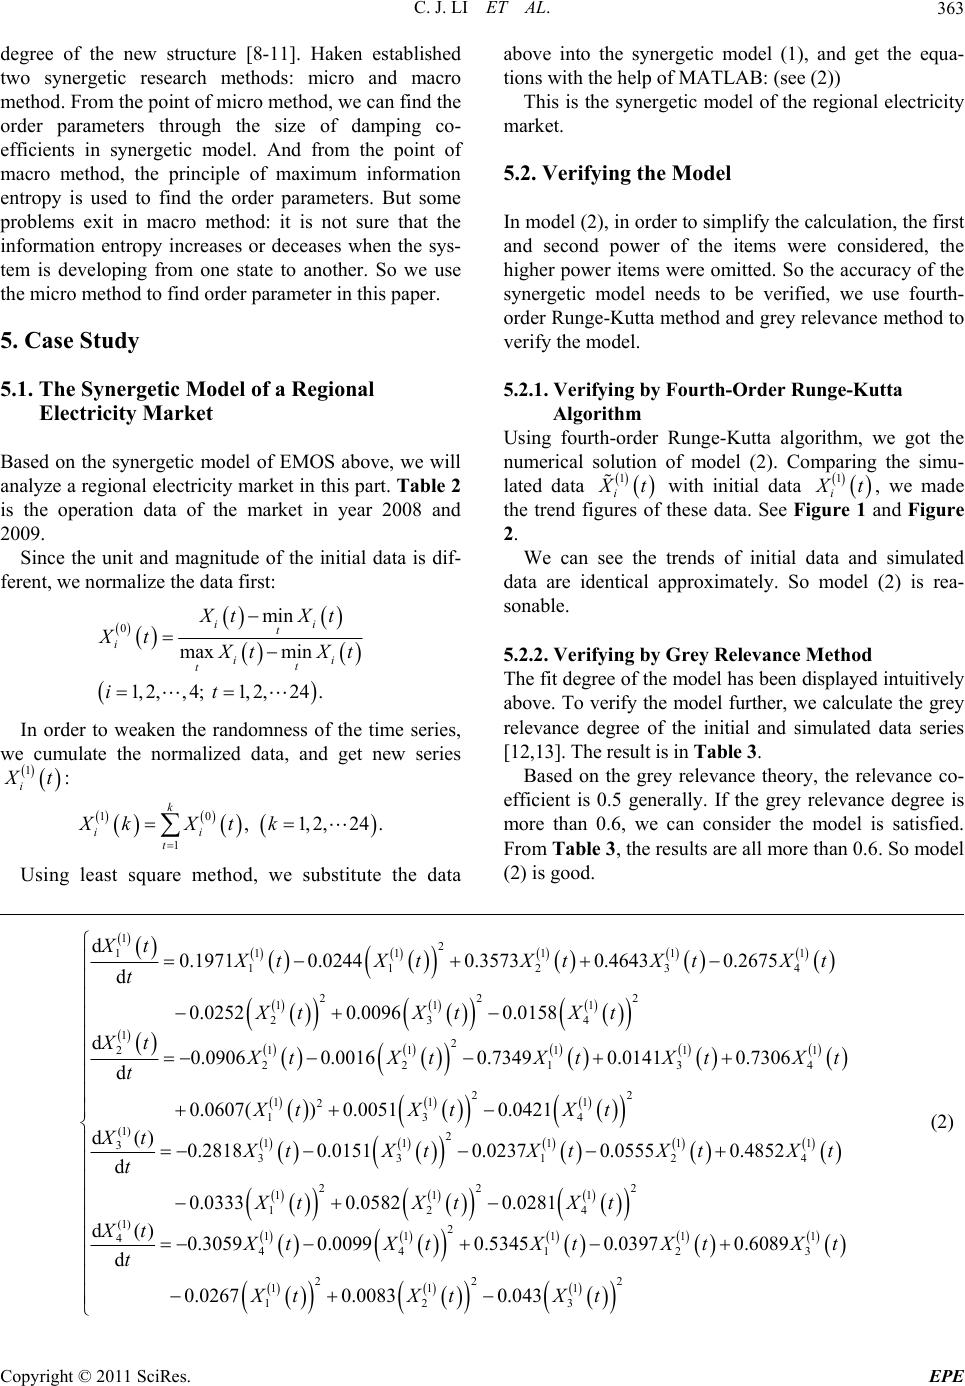 C. J. LI ET AL. Copyright © 2011 SciRes. EPE 363 degree of the new structure [8-11]. Haken established two synergetic research methods: micro and macro method. From the point of micro method, we can find the order parameters through the size of damping co- efficients in synergetic model. And from the point of macro method, the principle of maximum information entropy is used to find the order parameters. But some problems exit in macro method: it is not sure that the information entropy increases or deceases when the sys- tem is developing from one state to another. So we use the micro method to find order parameter in this paper. above into the synergetic model (1), and get the equa- tions with the help of MATLAB: (see (2)) This is the synergetic model of the regional electricity market. 5.2. Verifying the Model In model (2), in order to simplify the calculation, the first and second power of the items were considered, the higher power items were omitted. So the accuracy of the synergetic model needs to be verified, we use fourth- order Runge-Kutta method and grey relevance method to verify the model. 5. Case Study 5.1. The Synergetic Model of a Regional Electricity Market 5.2.1. Verifying by Fourth-Order Runge - Kutta Algorithm Using fourth-order Runge-Kutta algorithm, we got the numerical solution of model (2). Comparing the simu- lated data 1 i X t with initial data 1 i X t, we made the trend figures of these data. See Figure 1 and Figure 2. Based on the synergetic model of EMOS above, we will analyze a regional electricity market in this part. Table 2 is the operation data of the market in year 2008 and 2009. Since the unit and magnitude of the initial data is dif- ferent, we normalize the data first: 0min max min 1,2,,4; 1,2,24. ii t iii t t X tXt Xt X tX it We can see the trends of initial data and simulated data are identical approximately. So model (2) is rea- sonable. t 5.2.2. Verifyin g b y Grey Rel e va nce Met ho d The fit degree of the model has b een displayed intu itively above. To verify the model further, we calculate the grey relevance degree of the initial and simulated data series [12,13]. The result is in Table 3. In order to weaken the randomness of the time series, we cumulate the normalized data, and get new series 1 i X t: Based on the grey relevance theory, the relevance co- efficient is 0.5 generally. If the grey relevance degree is more than 0.6, we can consider the model is satisfied. From Table 3, the results are all more than 0.6. So model (2) is good. 10 1 , 1,2,24. k ii t XkXt k Using least square method, we substitute the data 12 11 11 111 23 222 111 234 12 11 11 222 13 d0.1971 0.02440.35730.46430.2675 d 0.02520.00960.0158 d0.09060.00160.73490.0141 0.7306 d 0.06 Xt 1 4 1 4 X tXt XtXtX t XtXt Xt Xt t X tXt XtXtX t t 22 111 2 134 (1) 2 11 11 333 12 222 111 124 (1) 2 11 1 444 1 07() 0.00510.0421 d()0.28180.01510.0237 0.05550.4852 d 0.03330.05820.0281 d()0.3059 0.00990.5345 d Xt Xt Xt Xt 1 4 X tXt XtXtX t XtXt Xt Xt Xt XtXt t 11 23 222 111 123 0.0397 0.6089 0.02670.00830.043 t X tX XtXt Xt t (2) 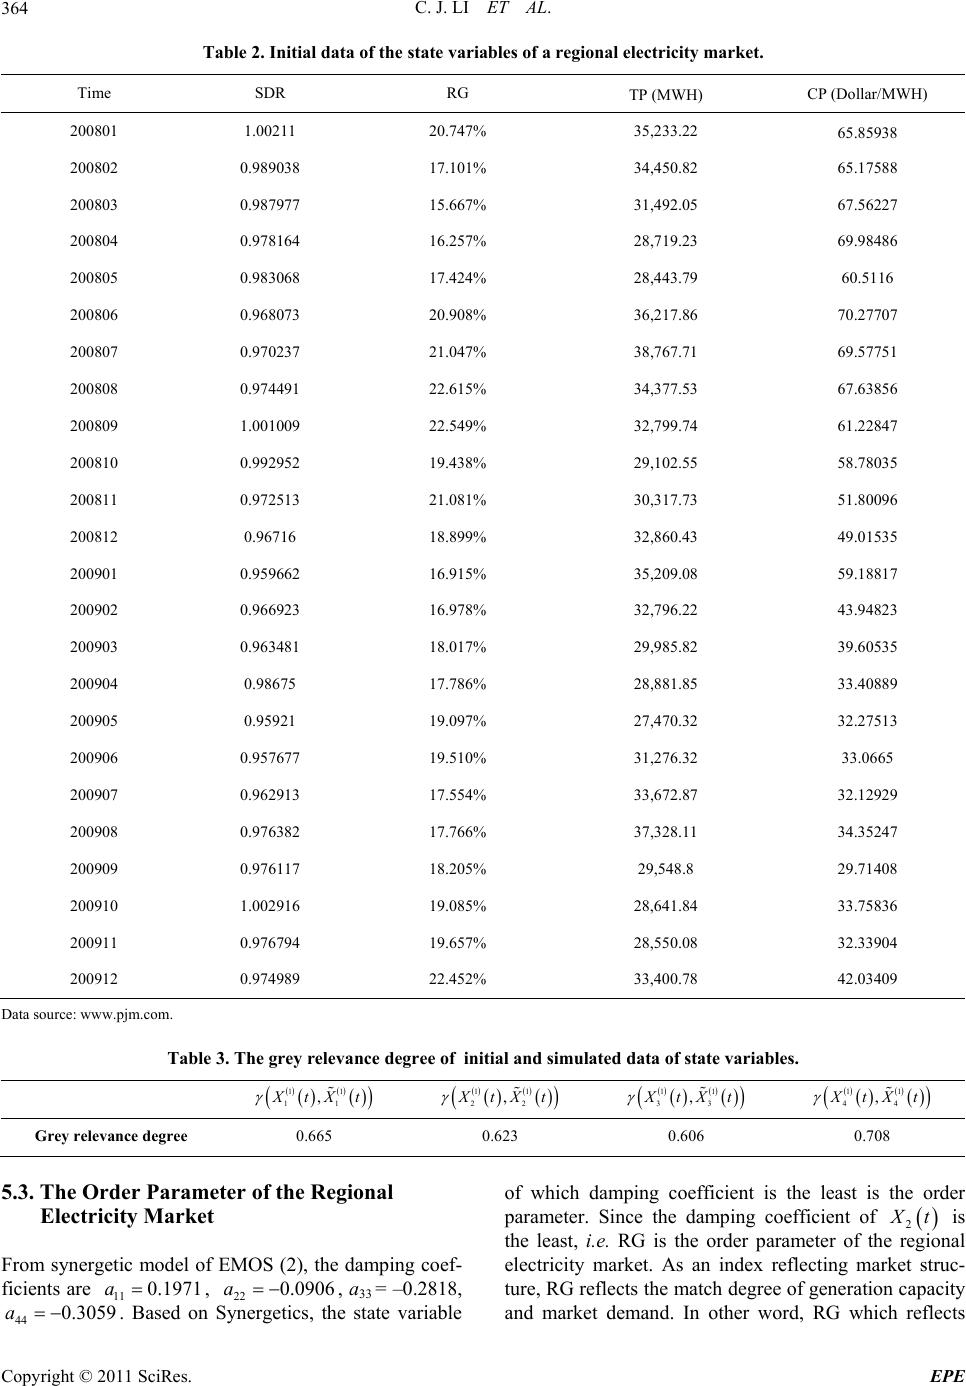 C. J. LI ET AL. 364 Table 2. Initial data of the state variables of a regional electricity market. Time SDR RG TP (MWH) CP (Dollar/MWH) 200801 1.00211 20.747% 35,233.22 65.85938 200802 0.989038 17.101% 34,450.82 65.17588 200803 0.987977 15.667% 31,492.05 67.56227 200804 0.978164 16.257% 28,719.23 69.98486 200805 0.983068 17.424% 28,443.79 60.5116 200806 0.968073 20.908% 36,217.86 70.27707 200807 0.970237 21.047% 38,767.71 69.57751 200808 0.974491 22.615% 34,377.53 67.63856 200809 1.001009 22.549% 32,799.74 61.22847 200810 0.992952 19.438% 29,102.55 58.78035 200811 0.972513 21.081% 30,317.73 51.80096 200812 0.96716 18.899% 32,860.43 49.01535 200901 0.959662 16.915% 35,209.08 59.18817 200902 0.966923 16.978% 32,796.22 43.94823 200903 0.963481 18.017% 29,985.82 39.60535 200904 0.98675 17.786% 28,881.85 33.40889 200905 0.95921 19.097% 27,470.32 32.27513 200906 0.957677 19.510% 31,276.32 33.0665 200907 0.962913 17.554% 33,672.87 32.12929 200908 0.976382 17.766% 37,328.11 34.35247 200909 0.976117 18.205% 29,548.8 29.71408 200910 1.002916 19.085% 28,641.84 33.75836 200911 0.976794 19.657% 28,550.08 32.33904 200912 0.974989 22.452% 33,400.78 42.03409 Data source: www.pjm.com. Table 3. The grey relevance degree of initial and simulated data of state variables. 11 11 ,XtXt 11 22 ,XtXt 11 33 ,XtXt 11 44 ,XtXt Grey relevance degree 0.665 0.623 0.606 0.708 5.3. The Order Parameter of the Regional Electricity Market From synergetic model of EMOS (2), the damping coef- ficients are , 2211 0.1971a0.0906a , a33 = –0.2818, . Based on Synergetics, the state variable of which damping coefficient is the least is the order parameter. Since the damping coefficient of 44 0.30a 59 2 X t is the least, i.e. RG is the order parameter of the regional electricity market. As an index reflecting market struc- ture, RG reflects the match degree of generation capacity and market demand. In other word, RG which reflects Copyright © 2011 SciRes. EPE  C. J. LI ET AL.365 Figure 1. The trend of initial data. Figure 2. The trend of simulated data. the situation of supply and demand in the electricity market implies whether the market power exits. 6. Conclusions The electricity market operation system which is open, non-linear and erratic, achieves to ordered operation state through continuous development. Therefore, the evolu- tion of EMOS accords with Synergetics theory. Based on Synergetics, we divided EMOS into structure, conduct and performance subsystems. Then we selected several state variables and constructed synergetic model of EMOS. Through empirical analysis, reserve rate of ge- neration was proofed the order parameter. Based on this paper, we can track the dynamic state of electricity mar- ket operation by studying the change of order parameter, and give the mechanism for the efficiency evaluation of electricity market operation. 7. References [1] Z. H. Song, “A Study on Integrated Mechanism of Met- allurgy Enterprise Technology Innovation Based on Syn- ergetic Theory,” Tianjin University, Tianjin, 2006. [2] T. Wu, “Theory of Cooperative Methods—Self-Organiza- tion and Its Application,” Inner Mongolia Social Science, Vol. 11, No. 6, 2000, pp. 19-26. [3] H. Hermann, “Advanced Synergetics,” Beijing Science Press, Beijing, 1989. [4] H. Hermann, “Information and Self-Organization,” Si- chuan Education Press, Chengdu, 1988. [5] Q. Wang, F. S. Wen and M. Liu, “Development of Evaluation Indices System for Power Market,” Electric Power Technology Economics, Vol. 20, No. 5, 2008, pp. 21-26. [6] H. F. Li, “Research of the Evaluation Index System and the Evaluation Model about Electric power Market in China,” North China Electric Power University, Beijing, 2008. [7] D. N. Liu, R. Q. Li and X. Q. Chen, “Regulatory Indica- tors and Market Assessment System of Electricity Mar- ket,” Automation of Electric Power Systems, Vol. 28, No. 9, 2004, pp. 16-21. [8] L. Jin, “Research on the Construction System Evolution- ary Development Based on Self-Organization Theory,” Harbin Institute of Technology, Harbin, 2007. [9] P. Y. Zhang and C. J. Li, “Study on Operational Effi- ciency of Electricity Market Based on Synergetic The- ory,” The International Conference on Electrical and Control Engineering, Wuhan, 25-27 June 2010, pp. 281-284. doi:10.1109/iCECE.2010.75 [10] J. B. Liu and B. Z. Li, “Study on the Order Parameters of the Enterprise Evolution System,” China Science and Technology Forum, Vol. 7, No. 4, 2005, pp. 85-87. [11] J. Z. Wang, “Technology Self-Organization Evolution Mechanism and the Order Parameter,” Dialectics of Na- ture, Vol. 23, No. 4, 2007, pp. 47-49. [12] C. Cheng and C. J. Li, “Application of Grey Incidence Analysis in the Regional Electricity Market Efficiency Evaluati on,” Journal of North China Electric Power University, Vol. 6, 2010, pp. 10-13. [13] S. Y. Wei and J. Y. Wu, “Short-Term Bus Load Fore- casting Based on Grey Model and Kalman Smoother,” Transactions of China Electrotechnical Society, Vol. 25, No. 2, 2010, pp. 158-162. Copyright © 2011 SciRes. EPE |