Paper Menu >>
Journal Menu >>
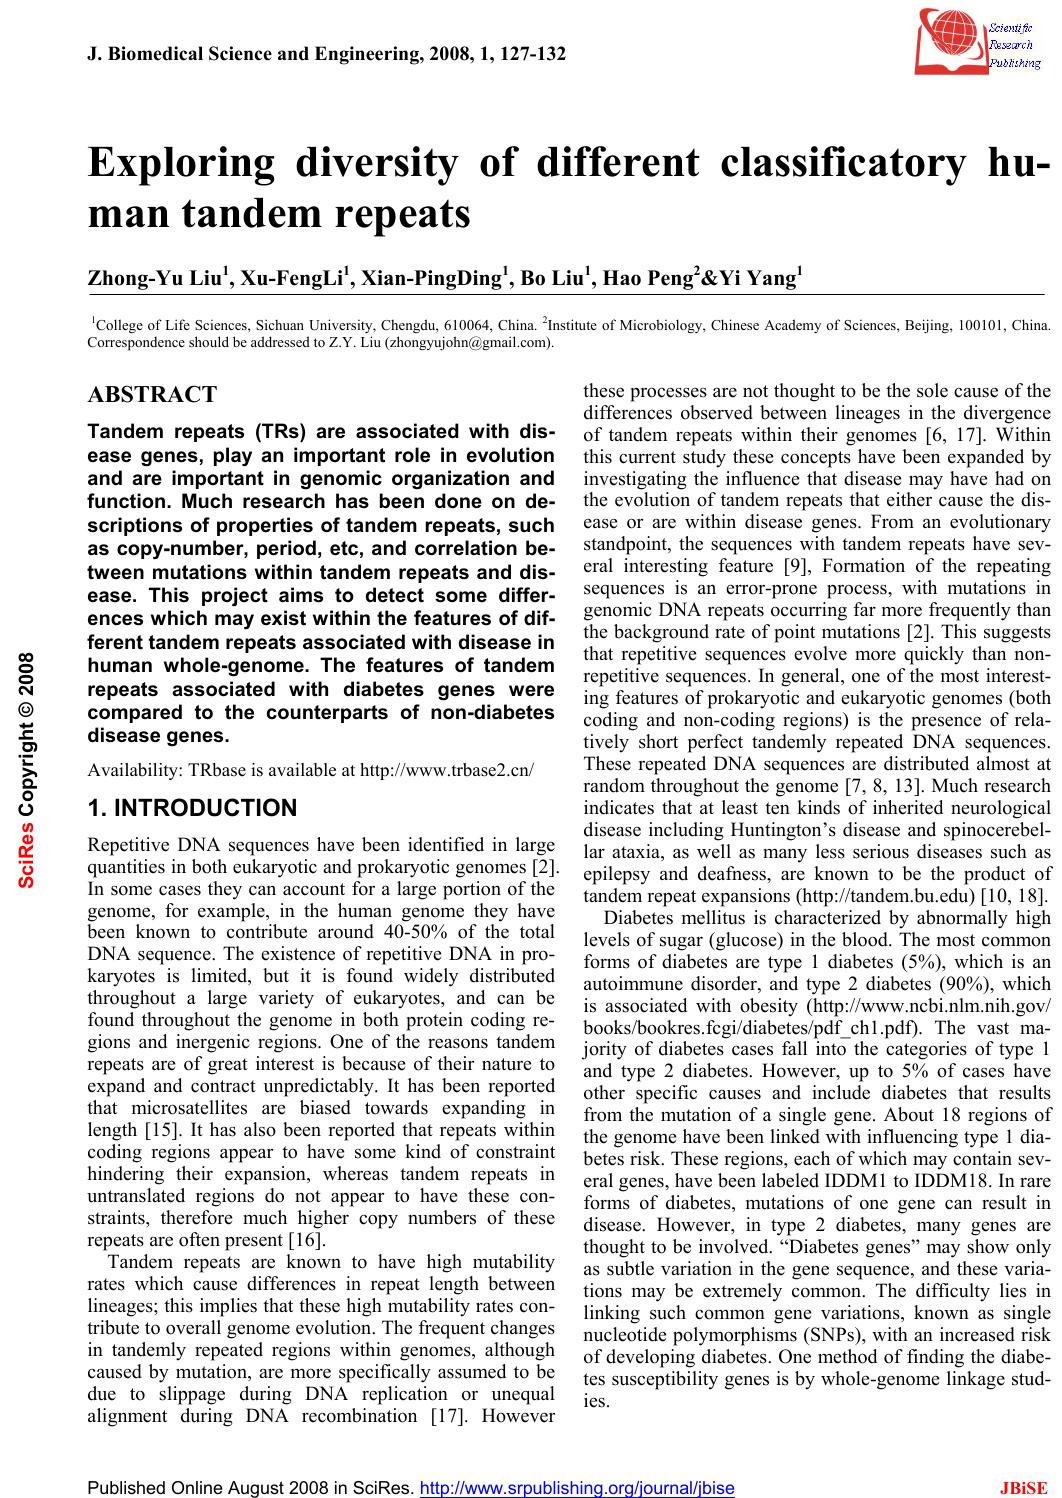 J. Biomedical Science and Engineering, 2008, 1, 127-132 Published Online August 2008 in SciRes. http://www.srpublishing.org/journal/jbise JBiSE Exploring diversity of different classificatory hu- man tandem repeats Zhong-Yu Liu1, Xu-FengLi1, Xian-PingDing1, Bo Liu1, Hao Peng2&Yi Yang1 1College of Life Sciences, Sichuan University, Chengdu, 610064, China. 2Institute of Microbiology, Chinese Academy of Sciences, Beijing, 100101, China. Correspondence should be addressed to Z.Y. Liu (zhongyujohn@gmail.com). ABSTRACT Tandem repeats (TRs) are associated with dis- ease genes, play an important role in evolution and are important in genomic organization and function. Much research has been done on de- scriptions of properties of tandem repeats, such as copy-number, period, etc, and correlation be- tween mutations within tandem repeats and dis- ease. This project aims to detect some differ- ences w hich may exist within the features of dif- ferent tandem repeats associated w ith disease in human whole-genome. The features of tandem repeats associated with diabetes genes were compared to the counterparts of non-diabetes disease genes. Availability: TRbase is available at http://www.trbase2.cn/ 1. INTRODUCTION Repetitive DNA sequences have been identified in large quantities in both eukaryotic and prokaryotic genomes [2]. In some cases they can account for a large portion of the genome, for example, in the human genome they have been known to contribute around 40-50% of the total DNA sequence. The existence of repetitive DNA in pro- karyotes is limited, but it is found widely distributed throughout a large variety of eukaryotes, and can be found throughout the genome in both protein coding re- gions and inergenic regions. One of the reasons tandem repeats are of great interest is because of their nature to expand and contract unpredictably. It has been reported that microsatellites are biased towards expanding in length [15]. It has also been reported that repeats within coding regions appear to have some kind of constraint hindering their expansion, whereas tandem repeats in untranslated regions do not appear to have these con- straints, therefore much higher copy numbers of these repeats are often present [16]. Tandem repeats are known to have high mutability rates which cause differences in repeat length between lineages; this implies that these high mutability rates con- tribute to overall genome evolution. The frequent changes in tandemly repeated regions within genomes, although caused by mutation, are more specifically assumed to be due to slippage during DNA replication or unequal alignment during DNA recombination [17]. However these processes are not thought to be the sole cause of the differences observed between lineages in the divergence of tandem repeats within their genomes [6, 17]. Within this current study these concepts have been expanded by investigating the influence that disease may have had on the evolution of tandem repeats that either cause the dis- ease or are within disease genes. From an evolutionary standpoint, the sequences with tandem repeats have sev- eral interesting feature [9], Formation of the repeating sequences is an error-prone process, with mutations in genomic DNA repeats occurring far more frequently than the background rate of point mutations [2]. This suggests that repetitive sequences evolve more quickly than non- repetitive sequences. In general, one of the most interest- ing features of prokaryotic and eukaryotic genomes (both coding and non-coding regions) is the presence of rela- tively short perfect tandemly repeated DNA sequences. These repeated DNA sequences are distributed almost at random throughout the genome [7, 8, 13]. Much research indicates that at least ten kinds of inherited neurological disease including Huntington’s disease and spinocerebel- lar ataxia, as well as many less serious diseases such as epilepsy and deafness, are known to be the product of tandem repeat expansions (http://tandem.bu.edu) [10, 18]. Diabetes mellitus is characterized by abnormally high levels of sugar (glucose) in the blood. The most common forms of diabetes are type 1 diabetes (5%), which is an autoimmune disorder, and type 2 diabetes (90%), which is associated with obesity (http://www.ncbi.nlm.nih.gov/ books/bookres.fcgi/diabetes/pdf_ch1.pdf). The vast ma- jority of diabetes cases fall into the categories of type 1 and type 2 diabetes. However, up to 5% of cases have other specific causes and include diabetes that results from the mutation of a single gene. About 18 regions of the genome have been linked with influencing type 1 dia- betes risk. These regions, each of which may contain sev- eral genes, have been labeled IDDM1 to IDDM18. In rare forms of diabetes, mutations of one gene can result in disease. However, in type 2 diabetes, many genes are thought to be involved. “Diabetes genes” may show only as subtle variation in the gene sequence, and these varia- tions may be extremely common. The difficulty lies in linking such common gene variations, known as single nucleotide polymorphisms (SNPs), with an increased risk of developing diabetes. One method of finding the diabe- tes susceptibility genes is by whole-genome linkage stud- ies. SciRes Copyright © 2008 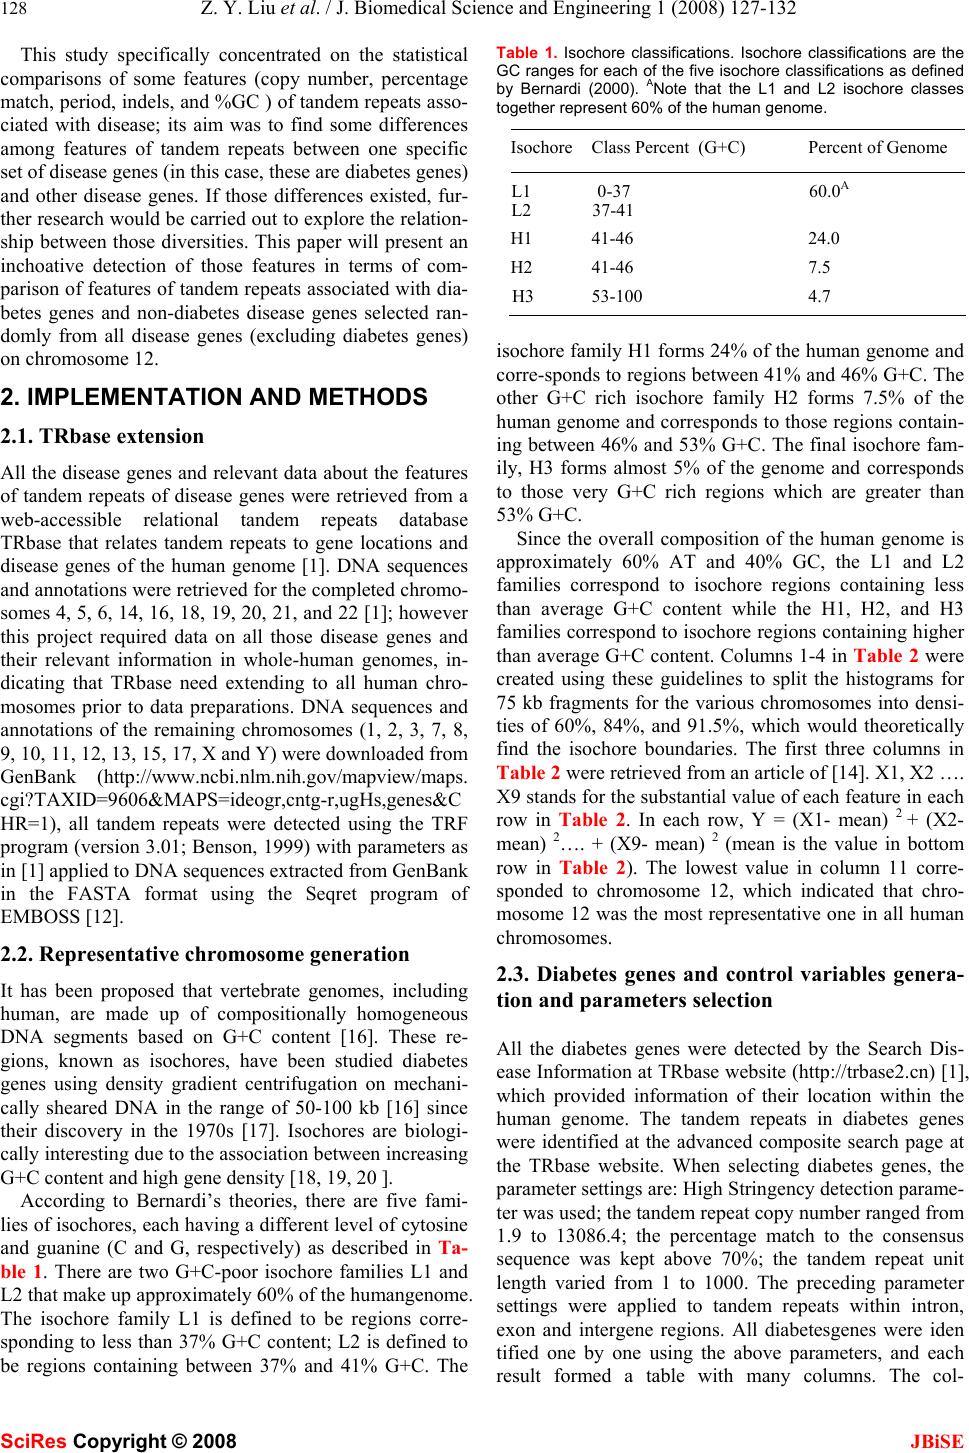 128 Z. Y. Liu et al. / J. Biomedical Science and Engineering 1 (2008) 127-132 SciRes Copyright © 2008 JBiSE This study specifically concentrated on the statistical comparisons of some features (copy number, percentage match, period, indels, and %GC ) of tandem repeats asso- ciated with disease; its aim was to find some differences among features of tandem repeats between one specific set of disease genes (in this case, these are diabetes genes) and other disease genes. If those differences existed, fur- ther research would be carried out to explore the relation- ship between those diversities. This paper will present an inchoative detection of those features in terms of com- parison of features of tandem repeats associated with dia- betes genes and non-diabetes disease genes selected ran- domly from all disease genes (excluding diabetes genes) on chromosome 12. 2. IMPLEMENTATION AND METHODS 2.1. TRbase extension All the disease genes and relevant data about the features of tandem repeats of disease genes were retrieved from a web-accessible relational tandem repeats database TRbase that relates tandem repeats to gene locations and disease genes of the human genome [1]. DNA sequences and annotations were retrieved for the completed chromo- somes 4, 5, 6, 14, 16, 18, 19, 20, 21, and 22 [1]; however this project required data on all those disease genes and their relevant information in whole-human genomes, in- dicating that TRbase need extending to all human chro- mosomes prior to data preparations. DNA sequences and annotations of the remaining chromosomes (1, 2, 3, 7, 8, 9, 10, 11, 12, 13, 15, 17, X and Y) were downloaded from GenBank (http://www.ncbi.nlm.nih.gov/mapview/maps. cgi?TAXID=9606&MAPS=ideogr,cntg-r,ugHs,genes&C HR=1), all tandem repeats were detected using the TRF program (version 3.01; Benson, 1999) with parameters as in [1] applied to DNA sequences extracted from GenBank in the FASTA format using the Seqret program of EMBOSS [12]. 2.2. Representative chromosome generation It has been proposed that vertebrate genomes, including human, are made up of compositionally homogeneous DNA segments based on G+C content [16]. These re- gions, known as isochores, have been studied diabetes genes using density gradient centrifugation on mechani- cally sheared DNA in the range of 50-100 kb [16] since their discovery in the 1970s [17]. Isochores are biologi- cally interesting due to the association between increasing G+C content and high gene density [18, 19, 20 ]. According to Bernardi’s theories, there are five fami- lies of isochores, each having a different level of cytosine and guanine (C and G, respectively) as described in Ta- ble 1. There are two G+C-poor isochore families L1 and L2 that make up approximately 60% of the humangenome. The isochore family L1 is defined to be regions corre- sponding to less than 37% G+C content; L2 is defined to be regions containing between 37% and 41% G+C. The Table 1. Isochore classifications. Isochore classifications are the GC ranges for each of the five isochore classifications as defined by Bernardi (2000). ANote that the L1 and L2 isochore classes together represent 60% of the human genome. Isochore Class Percent (G+C) Percent of Genome L1 0-37 L2 37-41 60.0A H1 41-46 24.0 H2 41-46 7.5 H3 53-100 4.7 isochore family H1 forms 24% of the human genome and corre-sponds to regions between 41% and 46% G+C. The other G+C rich isochore family H2 forms 7.5% of the human genome and corresponds to those regions contain- ing between 46% and 53% G+C. The final isochore fam- ily, H3 forms almost 5% of the genome and corresponds to those very G+C rich regions which are greater than 53% G+C. Since the overall composition of the human genome is approximately 60% AT and 40% GC, the L1 and L2 families correspond to isochore regions containing less than average G+C content while the H1, H2, and H3 families correspond to isochore regions containing higher than average G+C content. Columns 1-4 in Table 2 were created using these guidelines to split the histograms for 75 kb fragments for the various chromosomes into densi- ties of 60%, 84%, and 91.5%, which would theoretically find the isochore boundaries. The first three columns in Table 2 were retrieved from an article of [14]. X1, X2 …. X9 stands for the substantial value of each feature in each row in Table 2. In each row, Y = (X1- mean) 2 + (X2- mean) 2…. + (X9- mean) 2 (mean is the value in bottom row in Table 2). The lowest value in column 11 corre- sponded to chromosome 12, which indicated that chro- mosome 12 was the most representative one in all human chromosomes. 2.3. Diabetes genes and control variables genera- tion and parameters selection All the diabetes genes were detected by the Search Dis- ease Information at TRbase website (http://trbase2.cn) [1], which provided information of their location within the human genome. The tandem repeats in diabetes genes were identified at the advanced composite search page at the TRbase website. When selecting diabetes genes, the parameter settings are: High Stringency detection parame- ter was used; the tandem repeat copy number ranged from 1.9 to 13086.4; the percentage match to the consensus sequence was kept above 70%; the tandem repeat unit length varied from 1 to 1000. The preceding parameter settings were applied to tandem repeats within intron, exon and intergene regions. All diabetesgenes were iden tified one by one using the above parameters, and each result formed a table with many columns. The col- 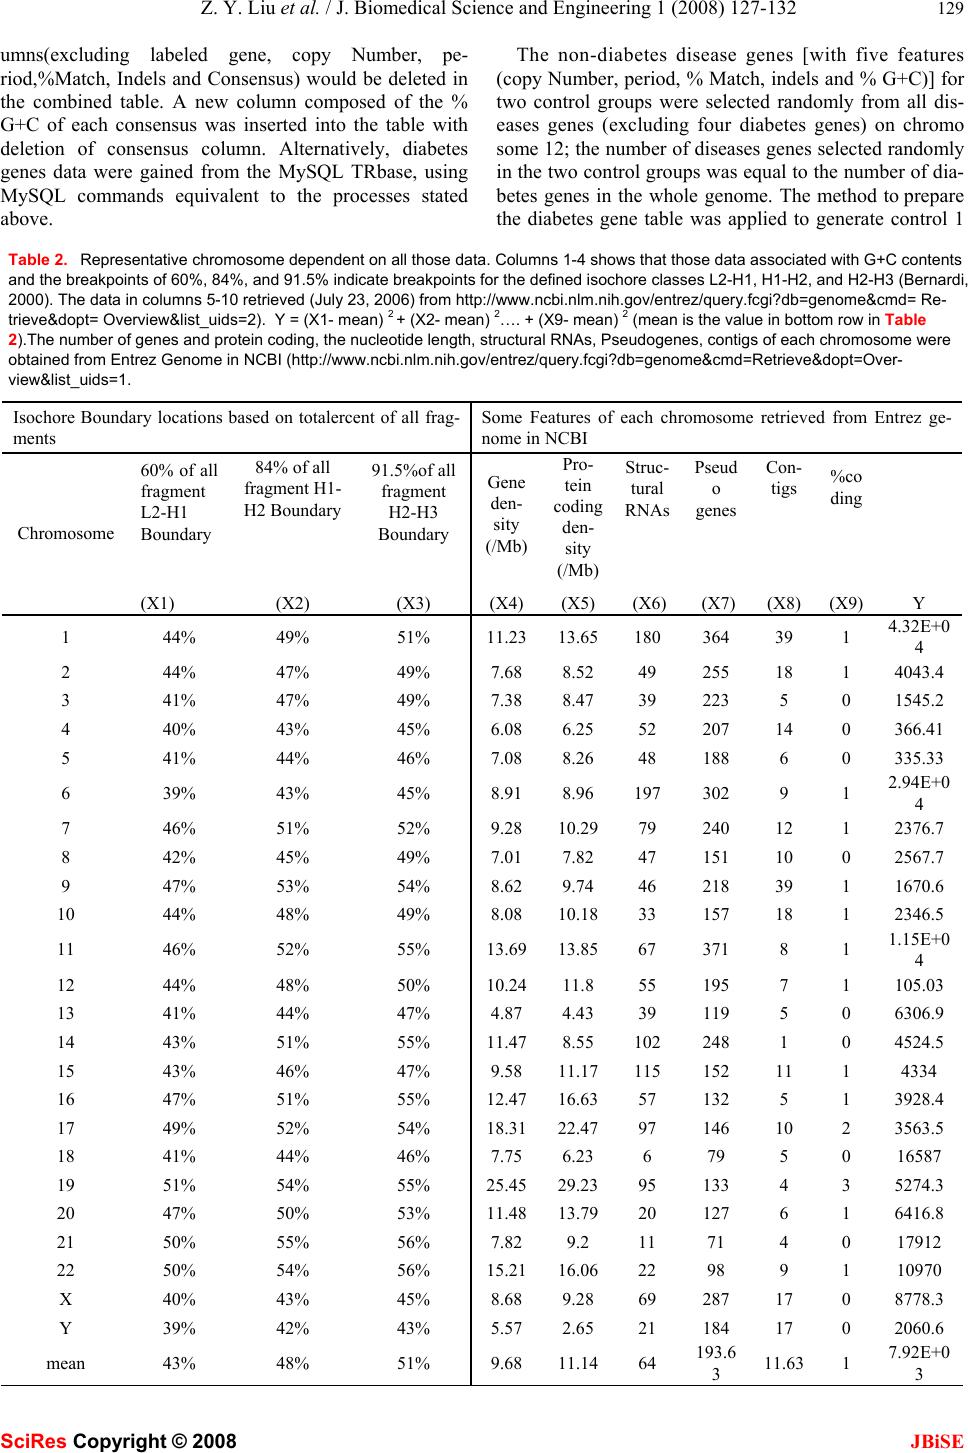 Z. Y. Liu et al. / J. Biomedical Science and Engineering 1 (2008) 127-132 129 SciRes Copyright © 2008 JBiSE umns(excluding labeled gene, copy Number, pe- riod,%Match, Indels and Consensus) would be deleted in the combined table. A new column composed of the % G+C of each consensus was inserted into the table with deletion of consensus column. Alternatively, diabetes genes data were gained from the MySQL TRbase, using MySQL commands equivalent to the processes stated above. The non-diabetes disease genes [with five features (copy Number, period, % Match, indels and % G+C)] for two control groups were selected randomly from all dis- eases genes (excluding four diabetes genes) on chromo some 12; the number of diseases genes selected randomly in the two control groups was equal to the number of dia- betes genes in the whole genome. The method to prepare the diabetes gene table was applied to generate control 1 Table 2. Representative chromosome dependent on all those data. Columns 1-4 shows that those data associated with G+C contents and the breakpoints of 60%, 84%, and 91.5% indicate breakpoints for the defined isochore classes L2-H1, H1-H2, and H2-H3 (Bernardi, 2000). The data in columns 5-10 retrieved (July 23, 2006) from http://www.ncbi.nlm.nih.gov/entrez/query.fcgi?db=genome&cmd= Re- trieve&dopt= Overview&list_uids=2). Y = (X1- mean) 2 + (X2- mean) 2…. + (X9- mean) 2 (mean is the value in bottom row in Table 2).The number of genes and protein coding, the nucleotide length, structural RNAs, Pseudogenes, contigs of each chromosome were obtained from Entrez Genome in NCBI (http://www.ncbi.nlm.nih.gov/entrez/query.fcgi?db=genome&cmd=Retrieve&dopt=Over- view&list_uids=1. Isochore Boundary locations based on totalercent of all frag- ments Some Features of each chromosome retrieved from Entrez ge- nome in NCBI Chromosome 60% of all fragment L2-H1 Boundary (X1) 84% of all fragment H1- H2 Boundary (X2) 91.5%of all fragment H2-H3 Boundary (X3) Gene den- sity (/Mb) (X4) Pro- tein coding den- sity (/Mb) (X5) Struc- tural RNAs (X6) Pseud o genes (X7) Con- tigs (X8) %co ding (X9) Y 1 44% 49% 51% 11.2313.65180 364 39 1 4.32E+0 4 2 44% 47% 49% 7.68 8.52 49 255 18 1 4043.4 3 41% 47% 49% 7.38 8.47 39 223 5 0 1545.2 4 40% 43% 45% 6.08 6.25 52 207 14 0 366.41 5 41% 44% 46% 7.08 8.26 48 188 6 0 335.33 6 39% 43% 45% 8.91 8.96 197 302 9 1 2.94E+0 4 7 46% 51% 52% 9.28 10.2979 240 12 1 2376.7 8 42% 45% 49% 7.01 7.82 47 151 10 0 2567.7 9 47% 53% 54% 8.62 9.74 46 218 39 1 1670.6 10 44% 48% 49% 8.08 10.1833 157 18 1 2346.5 11 46% 52% 55% 13.6913.8567 371 8 1 1.15E+0 4 12 44% 48% 50% 10.2411.8 55 195 7 1 105.03 13 41% 44% 47% 4.87 4.43 39 119 5 0 6306.9 14 43% 51% 55% 11.478.55 102 248 1 0 4524.5 15 43% 46% 47% 9.58 11.17115 152 11 1 4334 16 47% 51% 55% 12.4716.6357 132 5 1 3928.4 17 49% 52% 54% 18.3122.4797 146 10 2 3563.5 18 41% 44% 46% 7.75 6.23 6 79 5 0 16587 19 51% 54% 55% 25.4529.2395 133 4 3 5274.3 20 47% 50% 53% 11.4813.7920 127 6 1 6416.8 21 50% 55% 56% 7.82 9.2 11 71 4 0 17912 22 50% 54% 56% 15.2116.0622 98 9 1 10970 X 40% 43% 45% 8.68 9.28 69 287 17 0 8778.3 Y 39% 42% 43% 5.57 2.65 21 184 17 0 2060.6 mean 43% 48% 51% 9.68 11.1464 193.6 3 11.63 1 7.92E+0 3 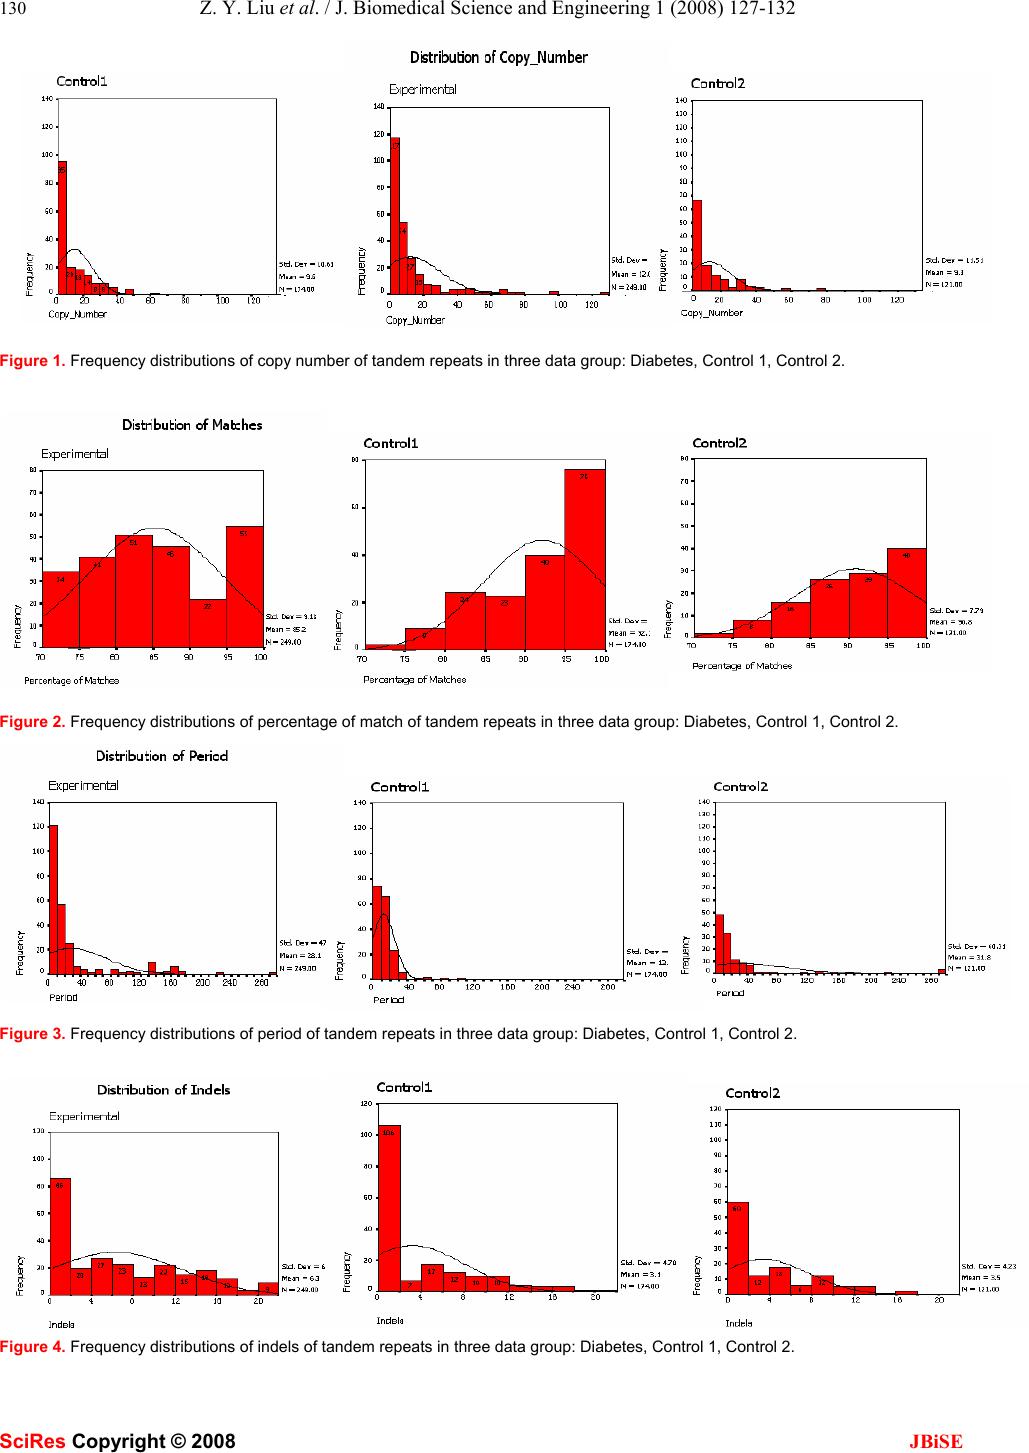 130 Z. Y. Liu et al. / J. Biomedical Science and Engineering 1 (2008) 127-132 SciRes Copyright © 2008 JBiSE Figure 1. Frequency distributions of copy number of tandem repeats in three data group: Diabetes, Control 1, Control 2. Figure 2. Frequency distributions of percentage of match of tandem repeats in three data group: Diabetes, Control 1, Control 2. Figure 3. Frequency distributions of period of tandem repeats in three data group: Diabetes, Control 1, Control 2. Figure 4. Frequency distributions of indels of tandem repeats in three data group: Diabetes, Control 1, Control 2. 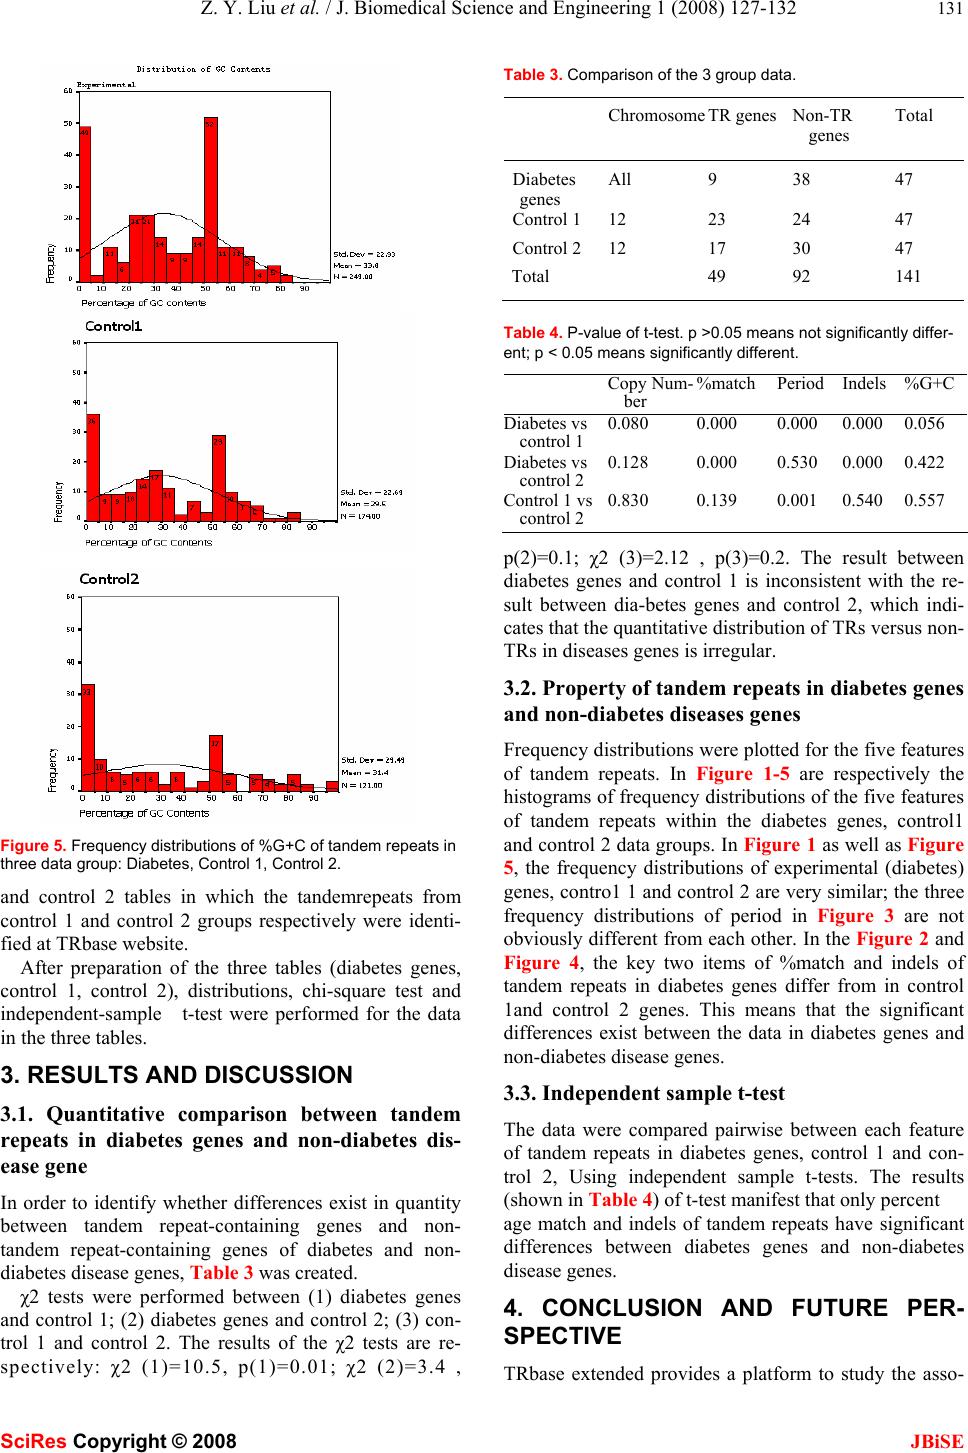 Z. Y. Liu et al. / J. Biomedical Science and Engineering 1 (2008) 127-132 131 SciRes Copyright © 2008 JBiSE Figure 5. Frequency distributions of %G+C of tandem repeats in three data group: Diabetes, Control 1, Control 2. and control 2 tables in which the tandemrepeats from control 1 and control 2 groups respectively were identi- fied at TRbase website. After preparation of the three tables (diabetes genes, control 1, control 2), distributions, chi-square test and independent-sample t-test were performed for the data in the three tables. 3. RESULTS AND DISCUSSION 3.1. Quantitative comparison between tandem repeats in diabetes genes and non-diabetes dis- ease gene In order to identify whether differences exist in quantity between tandem repeat-containing genes and non- tandem repeat-containing genes of diabetes and non- diabetes disease genes, Table 3 was created. χ2 tests were performed between (1) diabetes genes and control 1; (2) diabetes genes and control 2; (3) con- trol 1 and control 2. The results of the χ2 tests are re- spectively: χ2 (1)=10.5, p(1)=0.01; χ2 (2)=3.4 , Table 3. Comparison of the 3 group data. ChromosomeTR genes Non-TR genes Total Diabetes genes All 9 38 47 Control 1 12 23 24 47 Control 2 12 17 30 47 Total 49 92 141 Table 4. P-value of t-test. p >0.05 means not significantly differ- ent; p < 0.05 means significantly different. Copy Num- ber %match Period Indels %G+C Diabetes vs control 1 0.080 0.000 0.000 0.000 0.056 Diabetes vs control 2 0.128 0.000 0.530 0.000 0.422 Control 1 vs control 2 0.830 0.139 0.001 0.540 0.557 p(2)=0.1; χ2 (3)=2.12 , p(3)=0.2. The result between diabetes genes and control 1 is inconsistent with the re- sult between dia-betes genes and control 2, which indi- cates that the quantitative distribution of TRs versus non- TRs in diseases genes is irregular. 3.2. Property of tandem repeats in diabetes genes and non-diabetes diseases genes Frequency distributions were plotted for the five features of tandem repeats. In Figure 1-5 are respectively the histograms of frequency distributions of the five features of tandem repeats within the diabetes genes, control1 and control 2 data groups. In Figure 1 as well as Figure 5, the frequency distributions of experimental (diabetes) genes, contro1 1 and control 2 are very similar; the three frequency distributions of period in Figure 3 are not obviously different from each other. In the Figure 2 and Figure 4, the key two items of %match and indels of tandem repeats in diabetes genes differ from in control 1and control 2 genes. This means that the significant differences exist between the data in diabetes genes and non-diabetes disease genes. 3.3. Independent sample t-test The data were compared pairwise between each feature of tandem repeats in diabetes genes, control 1 and con- trol 2, Using independent sample t-tests. The results (shown in Table 4) of t-test manifest that only percent age match and indels of tandem repeats have significant differences between diabetes genes and non-diabetes disease genes. 4. CONCLUSION AND FUTURE PER- SPECTIVE TRbase extended provides a platform to study the asso-  132 Z. Y. Liu et al. / J. Biomedical Science and Engineering 1 (2008) 127-132 SciRes Copyright © 2008 JBiSE ciations between disease genes and previously uncharac- terized tandem repeats in whole human genomes. In all features (copy number, percentage match, period, indels, %G+C) of tandem repeats associated with disease genes, statistically significant differences only exist for %match and indels features of tandems repeats associated with different disease genes. Currently, just a very prelimi- nary research work has been done in mining of those differences, further investigations are being conducted, for example, correlations, regressions and modelling of the differences will be performed, and use machine learning methods to train and test the model. ACKNOWLEDGEMENTS The authors wish to express sincere appreciation to Dr. A.-M. Patch for instruction in extending TRbase. In addition, special thanks are due to Dr S. J. Aves, whose critical eye, and enlightened mentoring were instrumental and inspiring. I wish to acknowledge my gratitude to Dr Z. R. Yang, whose instructions and inspiration to me were helpful throughout the whole project. I also thank Robin Batten for his assis- tance in source data support. REFERENCES [1] Buard, J. and Vergnaud, G. (1994) Complex recombination events at the hypermutable minisatellite CEB1 (D2S90). EMBO J. 13, 3203-3210. [2] Van Belkum, A., Scherer, S., and Verbrugh, H. (1998) Short- sequences DNA repeats in prokaryotic genomes, Microbiol. Mol.Biol.Rev. 62, 275-293. [3] Rubinsztein. D.C., Amos, B, and Cooper, G. (1999) Microsatellite and trinucleotide-repeat evolution: evidence for mutational bias and different rates of evolution in different lineages. Phil. Trans. R. Soc. Lond. B 354, 1095-1099. [4] Sutherland, G..R.and Richards, R.I. (1995) Simple tandem DNA repeats and human genetic disease. Proc. Natl. Acad. Sci. USA 92 3636-3641. [5] Tóth,G., Gaspari,Z. and Jurka,J. (2000) Microsatellites in different eukaryotic genomes: survey and analysis. Genome Res., 10, 967– 981. [6] Hancock, J.M., Worthey, E.A. and Santibez-Koref, M.F. (2001) A Role for Selection in Regulating the Evolutionary Emergence of Disease-Causing and Other Coding CAG Repeats in Humans and Mice. Mol. Biol. Evol. 18, 1014-1023. [7] Kajava .A.V (2001) Review: Proteins with repeated sequence – structural prediction and modeling. Jour. Stru. Biol. 134, 132-144. [8] Huang C., Lin Y., Yang Y., Huang S. and Chen C. (1998). The telomeres of Streptomyces chromosomes contain conserved palin- dromic sequences with potential to form complex secondary struc- tures. Mol. Microbiol. 28, 905–916. [9] Richard G. F., Hennequin C., Thierry A. and Dujon B. (1999) Tri- nucleotide repeats and other microsatellites in yeasts. Res. Micro- biol. 150, 589–602. [10] Heslop-Harrison J. S. (2003( Tandemly repeated DNA sequences and centromeric chromosomal regions of Arabidopsis species. Chromosome Res. 11, 241–253. [11] Lalioti M. D., Scott H. S., Buresi C., Bottani A., Norris M. A., Malafosse A. and Antonarakis S. E. (1997) Dodecamer repeat ex- pansion in cystatin B gene in progressive myoclonus epilepsy. Na- ture 386, 847–852. [12] Wren J. D., Forgacs E., Fondon J. W., Pertsemlidis A., Cheng S. Y. and Gallardo T. et al. 2000 Repeat polymorphisms within gene re- gions: phenotypic and evolutionary implications. Am. J. Hum. Genet. 67, 345–356.. [13] Boby T.., Patch A.M., Aves S.J. (2005) TRbase: a database relat- ing tandem repeats to disease genes for the human genome. Bioin- formatics, 21(6):811-6. [14] Benson,G. (1999) Tandem Repeats Finder: a program to analyze DNA sequences.Nucleic Acids Res., 27, 573–580. [15] Rice. p., Longdnen, I. and Bleasby, A. (2000) Mini- and microsa- tellite expansions: the recombination connection. EMBO Rep., 1, 122-126. [16] Bernardi, G. (1993) "The isochore organization of the human genome and its evolutionary history – a review."Gene, 135:57-66. [17] Macaya, G., Thiery, J.P., Bernardi, G. (1976) "An approach to the organization of eukaryotic genomes at a macromolecular level." Journal of Molecular Biology,108(1): 237-254. [18] Mouchiroud, D., D'Onofrio, G., Aissani, B, Macaya, G., Gautier, C. Bernardi, G. (1991) "The distribution of genes in the human ge- nome." Gene, 100:181-187. [19] Gardiner,K. (1996) "Base composition and gene distribution: critical patterns in mammalian genome organization." Trends in Genetics, 12(12):519-524. [20] Zoubak, S., Clay, O., Bernardi, G. (1996) "The gene distribution of the human genome." Gene, 174:95-102. [21] Rouchka, E.C., States, D.J. (2002) .Compositional Analysis of Homogeneous Regions in Human Genomic DNA. Technical Re- port. Washington University Department of Computer Science, WUCS-2002-2 |