 OpenAccessLibraryJournal Howtocitethispaper:Mondal,I.andBandyopadhyay,J.(2014)CoastalWetlandModelingUsingGeoinformaticsTech‐ nologyofNamkhanaIsland,South24Parganas,W.B,India.OpenAccessLibraryJournal,1:e975. http://dx.doi.org/10.4236/oalib.1100975 CoastalWetlandModelingUsing GeoinformaticsTechnologyofNamkhana Island,South24Parganas,W.B,India IsmailMondal,JatisankarBandyopadhyay DepartmentofRemoteSensing&GIS,VidyasagarUniversity,Midnapore,India Email:ismail@mail.vidyasagar.ac.in,jatib@mail.vidyasagar.ac.in Received10October2014;revised18November2014;accepted9December2014 Copyright©2014byauthorsandOALib. ThisworkislicensedundertheCreativeCommonsAttributionInter nationalLicense(CCBY). http://creativecommons.org/licenses/by/4.0/ Abstract Wetlandsareoneofourmostimportantyetendangeredandunder‐valuedenvironments.Sus‐ tainablemanagementofwetlandecosystemisnecessaryasitservestheimportantfunctionssuch asfoodstorage,waterqualitymaintenanceandprovidinghabitatfordifferentspeciesofwildlife. Morethan75%ofcommercialfishspeciesrequi rewetlandstocompletepartoftheirlifecycle. Manylocalandmigratorybirdsalsoutilizecoastalwetlandsasbreedingandroostingsitesaswell asprovidingfoodandhabitatformanyanimalandplantspecies.Wetlandsarealsoavaluable bufferagainstcoastalerosion,stormsurgesandflooding.Astudyhasbeencarriedouttodeline‐ atethewetland,inandaroundNamkhanaislandofWestBengal,India,usingIRSLISS‐IIIdataof theyear2010andETM+data(2013).Thedatahavebeenanalyzedandthewetlandshavebeen qualitativelycharacterizedbasedonturbidityandaquaticvegetationstatusalsorecognizespond areabyNormalizedDifferencePondIndex,delineatesopenwaterfeaturesandenhan cestheir presenceinremotely‐senseddigitalimagery.Thusthisstudyhighlightstheusefulnessofremotely senseddataforwetlandmapping,seasonalmonitoringandcharacterization. Keywords RS&GIS,CoastalWetlands,NDPI,NDWI,NDTI SubjectAreas:EnvironmentalSciences,Geology 1.Introduction Coastal zones are important boundaries, forming transition areas between terrestrial and marine environments. Approximately 41% of the world’s human population is living within 100 km of the coast [1]. Coastal wetlands have wet, spongy soils and are located in the transition zone between terrestrial land and ocean, and they include I.Mondal,J.Bandyopadhyay OALibJ|DOI:10.4236/oalib.11009752December2014|Volume1|e975 freshwater, saltwater and mixed areas. Land use maps are regarded to be the fundamental for the purpose of as- sessment and management planning of coastal environments [2]. Wetlands are one of the crucial natural re- sources. Wetlands exhibit enormous diversity according to their genesis, geographical location, water regime and chemistry, dominant plants and soil or sediment characteristics. Because of their transitional nature, the boundaries of wetlands are often difficult to define. To conserve and manage wetland resources, it is important to have inventory of wetlands and their catchments. The ability to store and analyze the data is essential. The technique used in the preparation of map started with ground survey. The (SOI) maps are the earliest true maps of India showing various land use/cover classes including wetlands. Recent years have seen advances in map- ping techniques with much more information of Remote Sensing & GIS techniques. 2.Aim The study mainly focusing on the identification of water bodies as well as vegetation using remote sensing and latest spatial information model for optimal sustainable management plan of the coastal wetland. Objective To delineate the water body, vegetation and land use land cover in the study area. It will be delineating through remote sensing and will be verified throu gh field data in a syste matic and mea- ningful way. Identification of terrain unit/geomorpholog ic unit and their spatial distribution through model building tech- niques with ARC Map and ERDAS Imagine software. To develop a basic understanding of the study area through coastal wetland mapping and its’ significance for changing scenario. To find out optimum utilization plan of coastal wetland through proper sustainable management. 3.StudyArea Fraserganj and Bakkhali are the sea resorts in India, beautiful landscape and bountiful enchanment amidst tall casurina at the coast of the bay of Bengal. Located about 130 km from Kolkata, Bakkhali, Fraserganj & Henry’s Island is well connected by road. All the three places can be reached by crossing the Hatania-Doania creeks at Namkhana by ferry service and then traveling another 25 kms by road towards south. Bus and other vehicles are ferried by a vessel across the narrow but swift flowing river. Fraserganj is an island in Bengal (West Bengal), India. It is located at an elevation of 1 meter above sea level, Fraserganj is also known as Fraserganj, Narayan - tala. Its coordinates are 21˚37'2"N and 88˚16'3"E. (Figure 1). RegionalPhysiography Hugli river is a world famous name for the Kolkata port and also this is a western boundary of Gangs-Brahma- putra deltaic plain [3]. Hugli estuary has its own characteristics—sand soil are flowing towards the sea at the time of low tide, which is help to clear the water always for the tran sportation of ship [4]. In the south of Nam- khana Islan d Fraserganj and L axmipur-Bakkhali sea coast area are situated (Figure 2). 4.Methodology ETM+ data of 2013 are used in presen t study. NATMO LULC map, Google Earth map and SOI Topo sheet are used, also used some ground truth data like photographs, GPS readings, shore line measurement by tap. The ETM+ image is geometrically rectified to extract the data pertaining to study area. Remote sensing techniques were carried out using ERDAS IMAGINE software and TNT MIPS and GIS analysis is carried out using Arc GIS [5]. 5.ResultsandDiscussion 5.1.LandUseLandsCoverClasses The land use/land cover map is an appraisal of spatial information of the physical and social cover types (i.e. 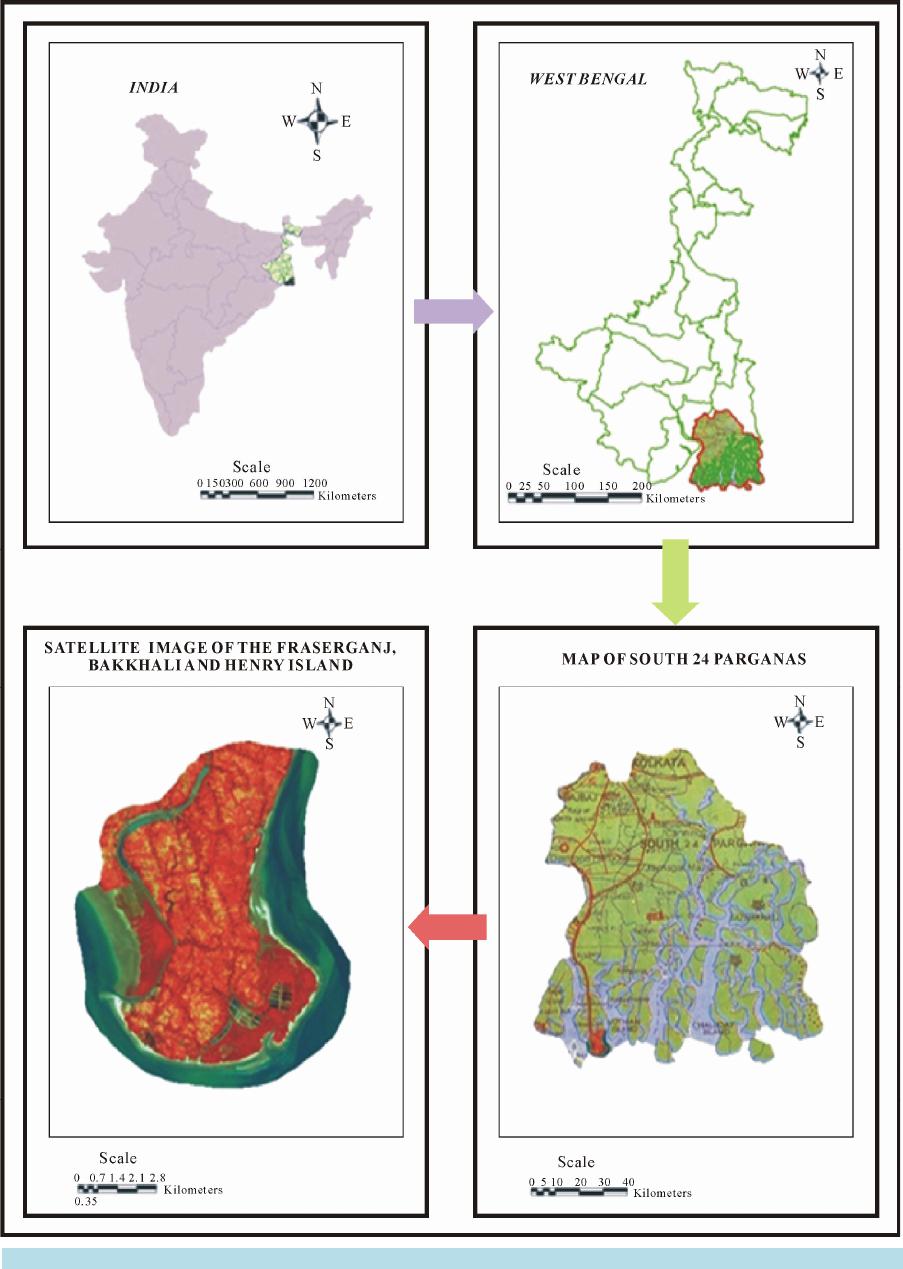 I.Mondal,J.Bandyopadhyay OALibJ|DOI:10.4236/oalib.1100975 3December2014|Volume1|e975 Figure 1. Location map. 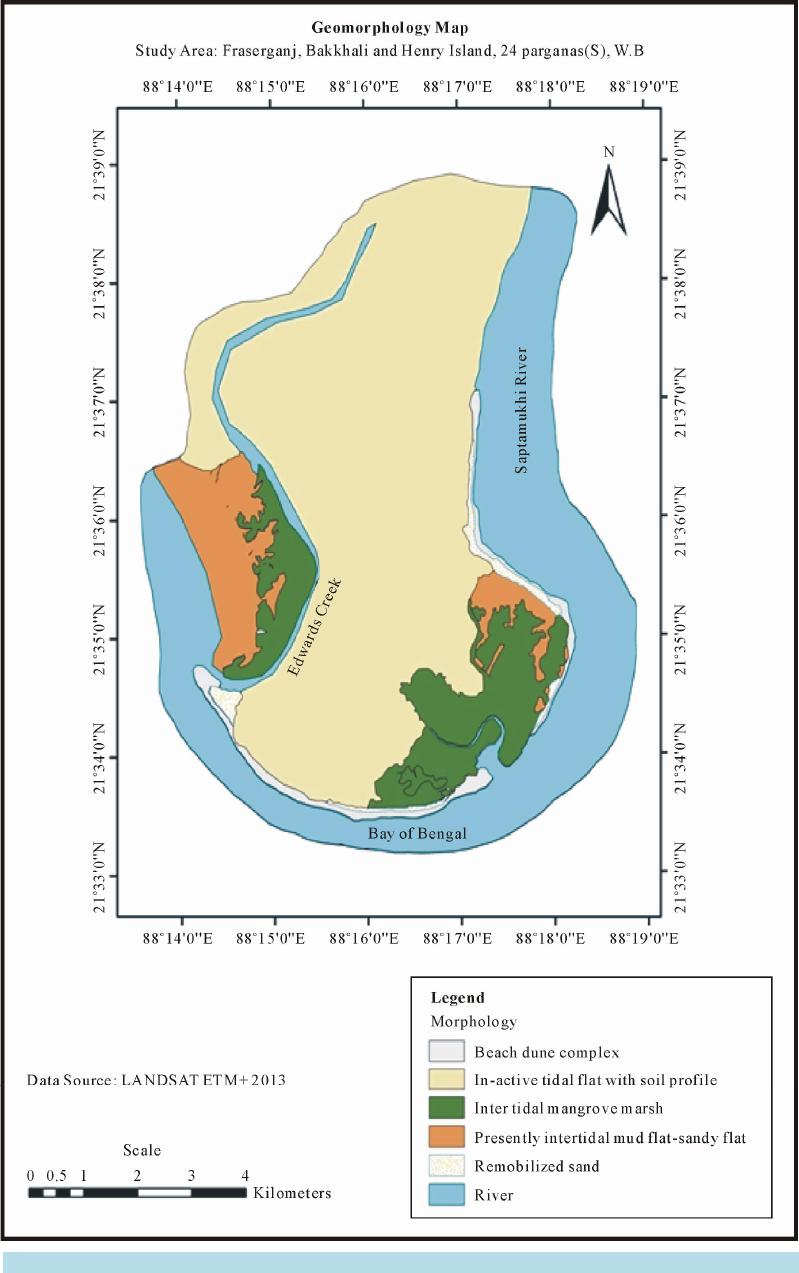 I.Mondal,J.Bandyopadhyay OALibJ|DOI:10.4236/oalib.11009754December2014|Volume1|e975 Figure 2. Geomorphology map. 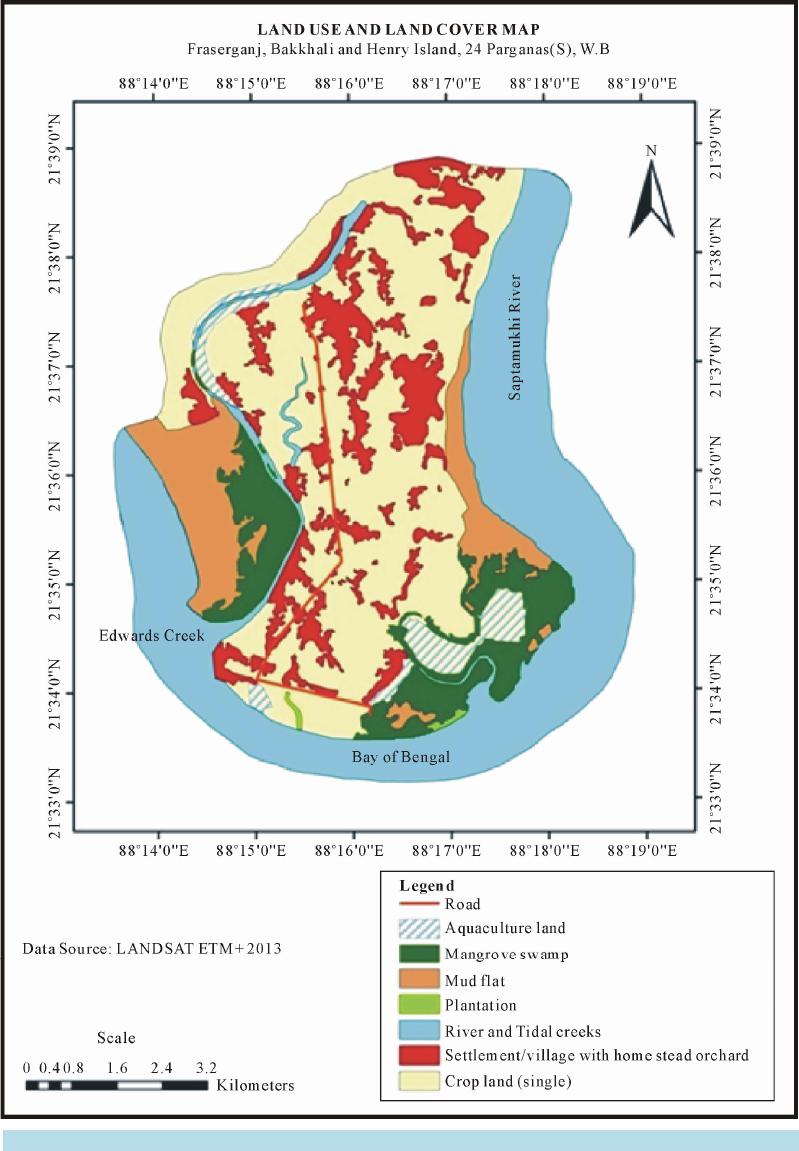 I.Mondal,J.Bandyopadhyay OALibJ|DOI:10.4236/oalib.1100975 5December2014|Volume1|e975 both natural and cultural/anthropogenic) on the existing scenario [6]. Land use could be defined as anthropo- genic/human activities (Cultivable land, homestead plantation/garden etc.). On the present day landscape is the vegetational (both natural and, cultural forests, plantation) and where as land cover is artificial construction (Settlement, road, embankments etc.) (Figure 3 & Figure 4) and (Table 1). Figure 3. Land use land cover map.  I.Mondal,J.Bandyopadhyay OALibJ|DOI:10.4236/oalib.11009756December2014|Volume1|e975 2.23045 6.061133 6.202378 0.116815 23.299043 8.711844 24.699039 Area in sq.km. Figure 4. Distribution of land use and land cover area. Table 1. Land use and land cover area of %. Class Area in sq. km.Total area Area of a class in % Aquaculture land 2.23045 3.127352841 Mangrove swamp 6.061133 8.498420276 Mud flat 6.202378 8.696462354 Plantation 0.116815 0.163788349 River and Tidal creeks 23.299043 32.66799449 Settlement/village with home stead orchard8.711844 12.21502839 Crop land 24.699039 71.320702 34.6309533 5.2.Normal ize DifferencesVegetationIndex(NDVI) In ETM+ image of study area (Bakkhali and Fraserganj) apply NDVI modeler to detect the greenness of the area. It is clearly shown the high range in mangrove swamp area of Fraserganj and also in domestic area where vege- tation are founded. Med ium range is also r epresen ting the plantation ar ea of Fraserg anj . And fir st two classes ar e not classified as vegetation coverage so no vegetation coverage found in different type of wetland and water content area of Bay of Bengal (Figure 5). 5.3.Normal izedDifferenceWaterIndex(NDWI) The equation for an NDWI is: Green NIRGreenNIR . Applying NDWI on study area (Bakkhali and Fraserganj) to delineate open water features and enhance their presence in remotely-sensed digital imagery. The NDWI makes use of reflected near-infrared radiation and visible green light to enhance the presence of such features while eliminatin g the presence of soil and terrestrial vegetation features. It is suggested that the NDWI may also provide researchers with turbidity estimations of water bodies using remotely-sensed digital data. After using NDWI on ETM+ digital imagery of study area it is clearly shown the open water in part of Bay of Bengal (Figure 6).  I.Mondal,J.Bandyopadhyay OALibJ|DOI:10.4236/oalib.1100975 7December2014|Volume1|e975 Figure 5. NDVI map.  I.Mondal,J.Bandyopadhyay OALibJ|DOI:10.4236/oalib.11009758December2014|Volume1|e975 Figure 6. NDWI map.  I.Mondal,J.Bandyopadhyay OALibJ|DOI:10.4236/oalib.1100975 9December2014|Volume1|e975 5.4.PondDetectionUsingNDPITechnique NDPIMIR GREENMIR GREEN Classification of ponds is performed from their vegetation cover and degrees of water turbidity. Detecting ponds from the study area (Fraserg anj, Bakkhali, and He nry Island) NDPI played a vital ro le. It is clearly shown in the NDPI several ponds are found in domestic area of Fraserganj. In the estuary and beach side no ponds are found that is normal as that area part of Bay of Bengal and also mangrove area are apart from ponds indication. The small size and complex distribution of ponds require the use of high-spatial resolution satellite images for adequate detection. Here the use of ETM+ images (30 m-resolution) allows for detailed assessment of spatial- temporal evolution of ponds, through the Normalized Difference Pond Index (NDPI), and NDTI. For example they represent nearly 65% of the total ponds during the peak of the rainy season, up to 90% at the end of the same season (Figure 7). 5.5.DelineationofWetlandBasedOnTurbidity(UsingNDTITechnique) The NDTI initially designed to describe water turbidity, increases when water bodies become muddy and have spectral reflectance similar to bare soils so it was logically negatively associated with the presence of water [7]. The Normalized Difference Turbidity Index (or NDTI hereafter) combines digital counts of the red and green bands of the electromagnetic spectrum, as follows: NDTIRED GREENREDGREEN . By applying this NDTI model to the image in ERDAS Imagine software, turbidity cover map was prepared and reduced for presentation accordingly low, moderate and high values were assigned to the image and converted in GIS envi- ronment. This turbidity map encodes each category of turbidity (low, moderate and high) with a unique pixel value. Its presentation very high turbidity are specially shown in the Bakkhali sea beach, which is extend to Fra- serganj and sand flat area if Bakkhali and also high turbidity shown scatterly in domestic area of Fraserganj where we found several ponds via NDPI (Figure 8) and (Table 2). Moderate turbid ity is found in some portion of Hooghly estuary and in mud flat area of Bakkh ali and Fraser- ganj and also in some portion of Henry fishing harbor .Comparatively low turbidity shown in mainly domestic area of Fraserganj. 5.6.WetlandClassificationMapping It is necessary to develop a specific set of data collection procedures to accommodate mapmaking using re- motely sensed imagery as the primary data source [8]. For example, some water chemistry, salinity, water depth, substrate size and types and even some differences in vegetative species cannot be reliably ascertained from air photos or digital imagery used by the Service. Image analysts must primarily rely on physical or spectral char- acteristics evident on high altitude imagery to make decisions regarding wetland classification. Preparing wet- land mapping of study area Bakkhali, Fraserganj and Henry Island (Figure 9 & Figure 10) and (Table 3) main- ly used ETM+ data and also some information of wetland during field visit session. Map of wetland mainly based on extraction of wetland from various indices then onscreen digitizing on Arc GIS software. 5.6.1.MangroveSwamp Mangrove swamps are coastal wetlands found in tropical and subtropical regions. They are characterized by ha- lophytic (salt loving) trees, shrubs and other plants growing in brackish to saline tidal waters. These wetlands are often found in estuaries, where fresh water meets salt water and are infamous for their impenetrable maze of woody vegetation. Mangrove trees dominate this wetland ecosystem due to their ability to survive in both salt Table 2. Showing the NDTI value nature. NDTI Value Water Turbidity Nature Remarks 0.35 to 0.10 Represent high turbidity Tidal flat where mud sand both are present for this the area is part of high turbidity 0.0078 to 0.35 Moderate turbidity Huge mud flat is present 0.028 to 0.0078 Very low turbidity Totally mudflat  I.Mondal,J.Bandyopadhyay OALibJ|DOI:10.4236/oalib.110097510December2014|Volume1|e975 Figure 7. Delineate area under pond coverage.  I.Mondal,J.Bandyopadhyay OALibJ|DOI:10.4236/oalib.1100975 11December2014|Volume1|e975 Figure 8. Turbidity map. 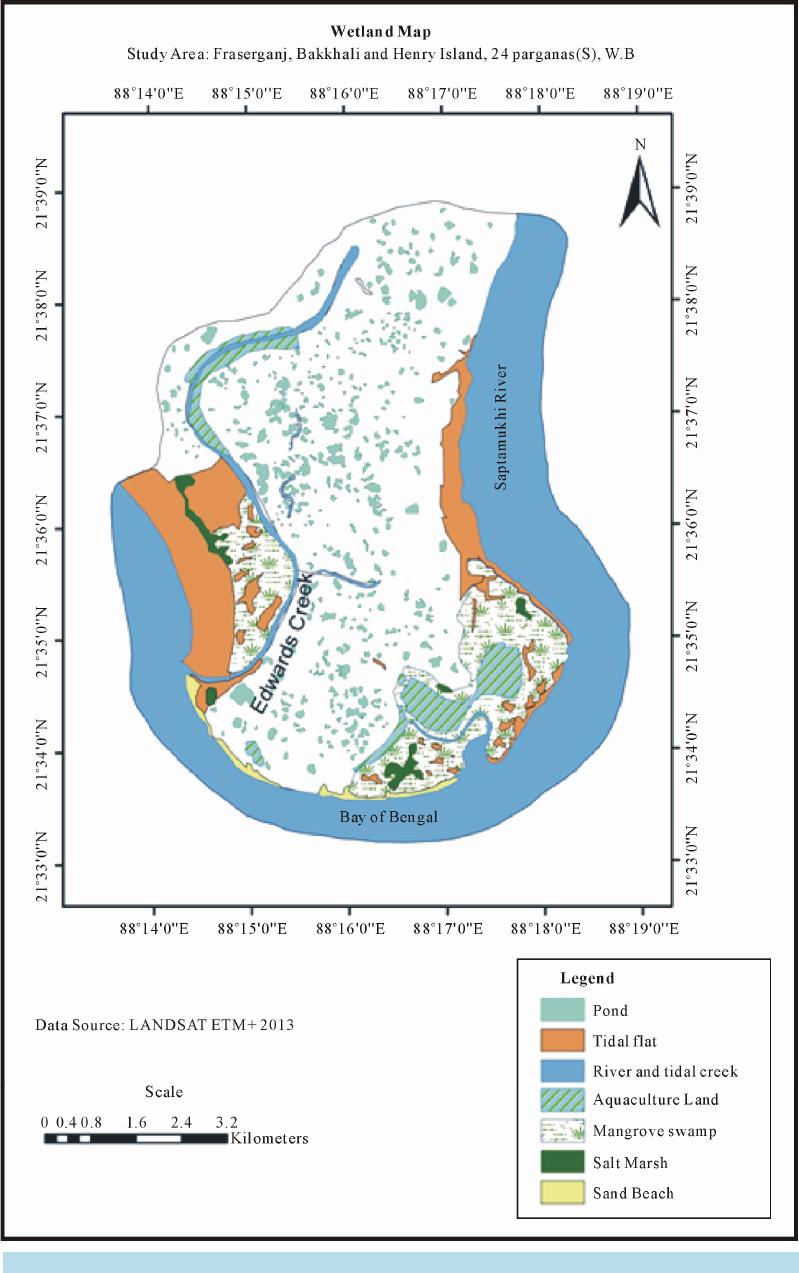 I.Mondal,J.Bandyopadhyay OALibJ|DOI:10.4236/oalib.110097512December2014|Volume1|e975 Figure 9. Wetland map. 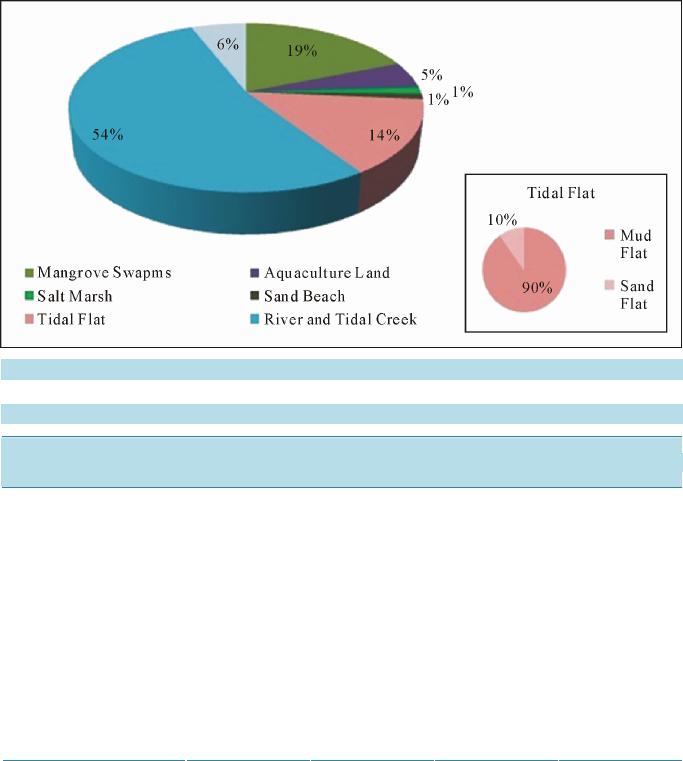 I.Mondal,J.Bandyopadhyay OALibJ|DOI:10.4236/oalib.1100975 13December2014|Volume1|e975 Figure 10. Showing wetland classification area of %. Table 3. Showing the value of wetland classification area. Wetland Types Sub Types Wetlands Area (sq. km.) Total Area (sq. km.) Area in % Mangrove Swamps 8.414476 19 Aquaculture Land 2.23974 5 Salt Marsh 0.5857025 1 Sand Beach 0.448253 1 Sand flat Tidal Flat Mud flat 6.31772 14 River and Tidal Creek 23.625553 54 Pond 2.656901 44.288346 6 and fresh water. In the study area mangrove swamps are specially found in Henry Island area and Fraserganj area (Figure 11). 5.6.2.AquacultureLand Aquaculture, also known as aqua farming, is the farming of aquatic organisms such as fish. Aquaculture in- volves cultivatin g freshwater and saltwater populations under controlled conditions, and can be contrasted with commercial fishing. The farming of fish is the most common form of aquaculture. It involves raising fish com- mercially in tanks, ponds, or ocean enclosures, usually for food. Aquaculture is a highly regulated industry, and these regulations may well keep fish farming. The main fishing zone in the study area is Henry Fishing zone some fishing farms are also shown in Fraserganj in this area fishing farm are occur at tidal flat side (Figure 12). 5.6.3.Rive randTidalCreeks Saptamukhi River is a tidal estuarine river in and around the Sundarban in south 24 Parganas District in the In- dian state of west Bengal. The saptamukhi originates near sultanpur and flows between kulpi and Mathurapur blocks. It has a connection with Muriganga River and it falls in to Bay of Bengal (Figure 13). A tidal creek, tid- al channel, or estuary is the portion of a stream that is affected by ebb and flow of ocean tides, in the case that the subject stream discharges to an ocean, or sea. Tidal creeks are lie at the interface between the open estuary and surrounding watershed stro ngest relationship s in the headwater areas. It is also drainag e for storm water and Habitat for fishes, crabs. In Fraserganj tidal creek is found in side of mangrove swamp and some channels is shown at near about Henry fi shing harbou r . 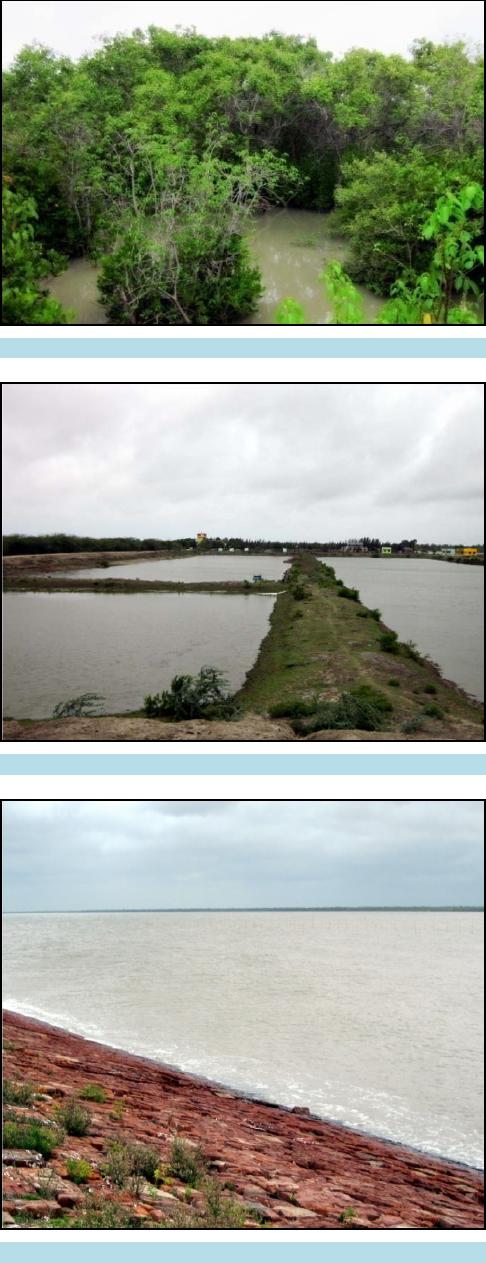 I.Mondal,J.Bandyopadhyay OALibJ|DOI:10.4236/oalib.110097514December2014|Volume1|e975 Figure 11. Distribution of wetlands area. Figure 12. Field photo of aquaculture land. Figure 13. Field photo of Saptamukhi river. 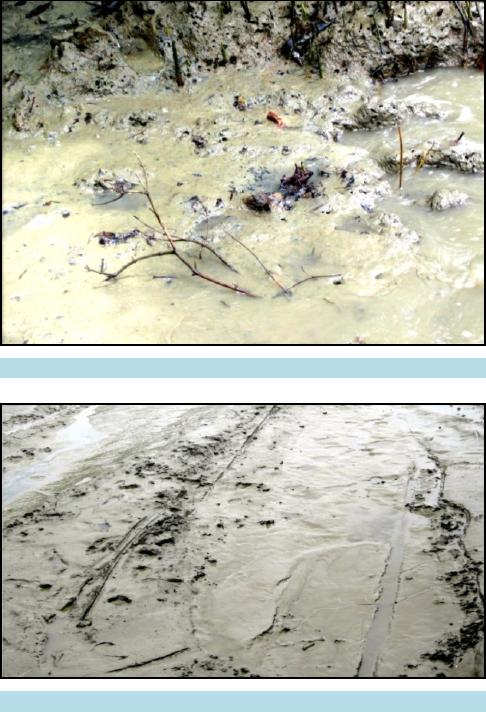 I.Mondal,J.Bandyopadhyay OALibJ|DOI:10.4236/oalib.1100975 15December2014|Volume1|e975 5.6.4.TidalFlat A nearly flat coastal area is alternately covered and exposed by the tides, and consisting of unconsolidated se- diments. Morphologically tidal flats and vegetated wetlands have certain similarities as both are low gradient coastal flood plain alluvium surface. However tidal flats are distinguished by bed forms little relief between su- pratidal and inter tidal surface. Tidal flats are again classified in terms of sediment compositions, which are Mud and sand flat (Figure 14). 5.6.5.MudFlats Generally mudflats are formed sediments supplied by nearby rivers.Mudflats are formed where there is sheltered water in river estuaries or behind spits. Silt and mud will be deposited either b y gently rising an d falling tides or by the river, these forms a zone of intertidal mudflats. The deposited material is not easily removed especially as flow velocities are low, and the length of time the area is not covered by water increases (Figure 15). 5.6.6.SaltMarsh A salt marsh is known as a coastal salt marsh or a tidal marsh, is a coastal eco system in the upper coastal inter- tidal zone between land and open salt water or brackish water that is regularly flooded by the tides [9]. In the present coastal areas of Bay of Bengal salt marsh and mangroves intermingles. Mainly some salt marsh is found between mangrove swamp area in Fraserganj beach and lower part of Henry Island (Figure 16). The develop- ment of marshes is found in two significant physical set up of the coast: 1) behindthe frontal mangroves; 2) be- hind the beach ridges. Various salt marsh species colonize behind the shorefront mangroves such development of salt marsh is clearly observed in Henry’s island of Sundarban. The stability of the surface behind frontal mangroves provides a favorable environment factor for such marsh growth. Figure 14. Field photo of tidal flat. Figure 15. Field photo of mud flats. 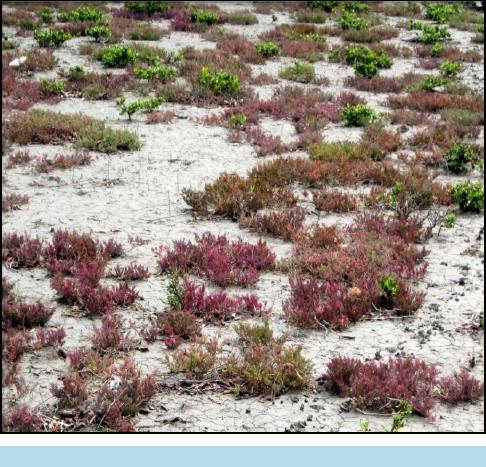 I.Mondal,J.Bandyopadhyay OALibJ|DOI:10.4236/oalib.110097516December2014|Volume1|e975 Figure 16. Field photo of salt marsh areas. 6.Planning Maintain the health of our intact wetlands; Redouble efforts to address the key drivers of wetland loss and degradation (Habitat loss, pollution, excessive water withdrawals, invasive species, overexploitation, etc.) Continue to identify vulnerable sp ecies and ecosystems, and plan and implement species and ecosystem ac- tion plans for recovery. Climate change mitigation actions. (Mitigation: An intervention to reduce the anthropogenic forcing of the climate system; it includes strategies to reduce greenhouse gas sources and emissions and enhancing green- house gas sinks) Appropriate climate change adaptation strategies (Adaptation: Adjustment in natural or human systems in response to actual or expected climatic stimuli or their effects, which moderates harm or exploit beneficial opportunities). 7.Conclusions There are especially seven types of coastal wetland found which are shown in Wetland Map and are based on the ground truth information and so me literature studies. The NDPI, NDTI and NDVI were used to identify ponds, wetlands based on turbidity and vegetation as guiding tools. Turbidity, surface water, vegetation coverage and also the pond classification could serve as guiding tool, in conservation prioritization of wetland. Here NDVI was used to detect the distribution of vegetation, but in NDVI the behavior of vegetation inside and outside the ponds cannot be distinguish ed . Thus use of new index for remote sensing of small and temporary ponds has been derived: the so-called Normalized Pond Index, the NDPI makes it possible not only to distinguish small ponds and water bodies (down to 0.01 ha), but also to differentiate vegetation inside ponds from that in their surroundings. Land shaping, reclamation and re-excavation of sweet water sources including step-cutting or terracing on inward-slopes of the ponds, these steps or terraces can be used for vegetable cultivation during dry periods [10]. References [1] Martínez, M.L., Intralawan, A., Vázquez, G., Pérez-Maqueo, O., Sutton, P. and Landgrave, R. (2007) The Coasts of  I.Mondal,J.Bandyopadhyay OALibJ|DOI:10.4236/oalib.1100975 17December2014|Volume1|e975 Our World: Ecological, Economic and Social Importance. Ecological E c o n o m i cs, 63, 254-272. http://dx.doi.org/10.1016/j.ecolecon.2006.10.022 [2] Ke, C.-Q., Zhang, D., Wang, F.-Q., Chen, S.-X., et al. (2010) Analyzing Coastal Wetland Change in the Yancheng National Nature Reserve, China. Regional Environmental Change, 11, 161-173. [3] Parthasarathi, C. (1987) Quaternary Geology and Geomorphology of Hooghly Estuary, Dist. 24—Parganas, West Bengal. Unpublished Final Report of Geological Survey of India for FS 1984-85 and 85-86. [4] Ascoli, F.D. M.A. Indian Civil Service, a Revenue History of the Sundarbans Volume-II (1870-1920). [5] Panigrahy, S. (2010) National Wetland Atlas Goa, Sponsored by—Ministry of Environment and Forests, Government of India (as a Part of the Project on National Wetland Inventory and Assessment, NWIA). [6] Andrade, A. Carlos, R.V. and Vos. tNC, J.H. (1988) An ILWIS Application for Landuse Planning in Lanos, Orientales. ITC Jour SP. ILWIS Issue (1988-1), 109-115. [7] Dambach, P., Machault, V. and Lacaux, J.-P., et al. (2012) Utilization of Combined Remote Sensing Techniques to Detect Environmental Variables Influencing Malaria Vector Densities in Rural, West Africa. International Journal of Health Geographics, 11, 8. http://dx.doi.org/10.1186/1476-072X-11-8 [8] A Method to Provide Baseline Mapping and Classification for Wetlands in Queensland VERSION 1.2 Environmental Protection Agency (2005) Wetland Mapping and Classification Methodology—Overall Framework—A Method to Provide Baseline Mapping and Classification for Wetlands in Queensland, Version 1.2, Queensland Government, Brisbane. ISBN 0 9757 344 6 6. [9] Erwin, K.L. (2009) Wetlands and Global Climate Change: The Role of Wetland Restoration in a Changing World. Wetlands Ecology and Management, 17, 71-84. http://dx.doi.org/10.1007/s11273-008-9119-1 [10] Mondal, I. and Bandyopadhyay, J. (2014) Coastal Zone Mapping through Geospatial Technology for Resource Man- agement of Indian Sundarban, West Bengal, India. International Journal of Remote Sensing Applications, 4. http://dx.doi.org/10.14355/ijrsa.2014.0402.04
|