Paper Menu >>
Journal Menu >>
 Modern Economy, 2011, 2, 228-258 doi:10.4236/me.2011.23028 Published Online July 2011 (http://www.SciRP.org/journal/me) Copyright © 2011 SciRes. ME A Critical View of Innovation in the Context of Poverty, Unemployment and Slow Economic Growth Roberto Kozulj-Fundación Bariloche Bariloche, Río Negro. Argentina E-mail: rkozulj@bariloche.com.ar Received January 31, 2011; revised March 16, 2011; accepted March 29, 2011 Abstract For the last two decades the study of technical innovation systems has been a regular practice. It has thus become a specific field in which different approaches are constantly emerging. Its importance derives not only from the needs of the productive sector in its search for new markets and opportunities, but also from the fact that the formulation of public policies that will foster growth, employment and income depends on its comprehension. In spite of the efforts made to understand innovation systems as socio-technical systems, emphasis was laid on how to create new market opportunities and improve competitiveness, disregarding a proper understanding of the global dynamics of growth. This was pushed into the background by the belief that only good microeconomic results will lead to good macroeconomic ones. Thus, the complex and eVolu- tionary perspective of the relationship between urbanization, growth, technological change and macroeco- nomic structural changes has been ignored. This paper attempts to further explore and analyse this topic by dealing with a series of issues: firstly, the effects of the decline in urban population growth on the use of productive capacity in several important sectors; secondly, structural changes in product composition caused by the saturation of urbanization processes and its effect on the behavior of productive units, and finally, the effects of shorter lifecycles of products on income distribution. The whole perspective is useful to outline the global context in which socio-technical systems develop and the challenges faced when testing their capacity to provide solutions for labor and poverty-related problems. Keywords: Economic Growth Theories, Urbanization, Unemployment Causes, Long-Term Structutal Crisis, Poverty, Dual Society, Innovation 1. Introduction The links between economic growth, technological in- novation and better human welfare are among the main topics in economic literature. However, mounting diffi- culties to fight poverty, structural unemployment and the loss of global dynamics deserve a deep look into the problem, particularly when the current crisis, which started in 2007 and has become deeper since 2009 and 2010, shows that there is more to it than just the crisis of the financial system. This paper focuses on the formulation of key hy- potheses that could frame the phenomena under discus- sion in a wider explanatory context. Such context should help understand both the reasons for the decline in long-term global growth rate, and the origins of the dual society from a perspective that differs from the estab- lished lines of thinking, despite the varied number of schools of thought. Likewise, the role played by China, India and other emerging economies in the growth proc- ess may also be seen from a different, more promising point of view when analyzing future scenarios and trying to understand the deeper structural causes lying ahead of economic growth in the coming decades. Firstly, then, Section 2 briefly reviews the theoretical background that established the axiomatics of the rela- tion between innovation and growth, between growth and welfare, and it discusses why such relations are so relevant. Much weight has been attached to technical progress as the cause of most product increase. This idea is partially questioned here, since even today, the per- manent addition of natural resources, capital and labor seems to be an important explanatory factor, together with territorial development and large-scale urbanization  R. K.-F. BARILOCHE229 processes, which are also drivers of growth. Section 3 describes and interprets some robust trends of long-term global growth by means of simple indica- tors such as growth of GDP per individual. The GDP per urban inhabitant variable is introduced here, to show diverse beheviors of the indicators when urbanization is considered an intervening variable. Then, Section 4 states part of the theoretical back- ground of the links between urbanization, technological change, economic growth and income distribution. The rationale for this line of argument is simple, albeit highly relevant: 1) the global urbanization process is not just the result of economic activity; it is in itself an important constituent part of annual gross product generation, since it involves a significant set of interdependent activities. 2) The urbanization process depends, in the final analysis, on the global population growth rate, on migratory proc- esses – whether rural-uban or across countries –, and on the urbanization level already reached. Therefore, in the absence of other dynamic factors, if that process reached saturation, the possibilities of product growth would equally reach that point, thus leading to market saturation. 3) However, the role of technological innovation lies precisely in its capacity to innovate productive processes, as well as to create new products and servicies that can mitigate the impact of this gradual process of market saturation. This is why Section 5 goes back to this point, and deals with five issues that have been generally over- looked, or not considered in an integrated way, namely: a) many innovation processes are not necessarily “innova- tive”; they simply replace consumer goods (as they are understood by classical economics) with others with a shorter life cycle in order to maintain the activity level and expand markets; b) not all productive sectors can resort to this type of innovation because they imply dif- ferent life cycles and production scales; c) whereas fi- nancial capital can easily migrate from one activity to another, physical capital and the abilities required for production are not fully convertible, or at least not in the short and mid-term; d) in the absence of an increase in productivity, shorter product life cycles imply that, for the same capital return rate, the capital recovery factor will occupy a larger part of the price of the good or ser- vice, which is a structural limitation to better income distribution; e) in productive processes, innovation tends to reduce employment, which is another obstacle to bet- ter income because the total employment demand will tend to be smaller than its suplly at a global scale. These ideas are dealt with in the explanatory context of the shift from the Fordist cumulative model to the flexible accu- mulation model, References [18-21], since it is likely that the current crisis be a wider replica of the crisis of the mid 70s. This Section also describes part of the empyri- cal evidence for this line of argument. However, both the analytic model and the analysis of correlations between urban population growth and product increase are shown on the basis of an econometric cross-section analysis for the 1960-1975 and 1975-1990 periods. (Annex I-Empirical and methodological features of the links be- tween urbanization, economic growth and technological change). Section 6 deals with a different issue: innovation sys- tems considered Socio-Technological Systems, since they imply the intervention of forces coming from R&D institutions and others devoted to their organization. The question here is whether this is really useful in order to prevent the dual society, poverty and unemployment from developing more deeply, or whether there is a strong bias towards the wrong belief that better compete- tiveness will also and necessarily lead to a better macro- economic behavior, when considered from a global economy perspective and not only from that of a nation or even worse, a company. In short, this paper challenges the Schumpeterian hy- pothesis about the positive global effects of the “creative destruction” that has taken place since the end of the “golden years”. This is done on the basis of the that the global context of development has reached a stage of evolution at which it requires new theoretical considera- tions and an approach of the innovation system that will consider it a more complex socio-technical system, where part of the R&D effort should lead precisely to reconciling research activities with these complex inter- relations. Finally, the conclusions drawn from the analysis em- phasize what aspects scientific research should focus on. 2. Theoretical and Contextual Considerations about Innovation and Economic Growth The close link between technological innovation and economic growth has always been a specific topic of economics and of a bulk of theoretical, conceptual and empirical work aiming to prove the existence of a posi- tive correlation between both variables. For some authors, [1]. “A theoretical link between innovation and economic growth has been contemplated since at least as early as Adam Smith (1 776). Not only did he articulate the pro- ductivity gains from specialization through the division of labor as well as from technological improvements to capital equipment and processes, he even recognized an early version of technology transfer from suppliers to users and the role of a distinct R&D function operating Copyright © 2011 SciRes. ME  R. K.-F. BARILOCHE 230 in the economy”. As is well known “Innovation” was introduced into formal economic growth models in 1957 by Solow [2], though the basis of the axiomatic relation be- tween in- novation and growth dates back to the relatively remote work by Abramovitx in Stantford, in the mid-1950s [3]. However, long has gone by since the introduction of that conceptual background. The relationship between innovation and growth has been modeled in increasingly sophisticated ways by Lucas and Romer [4,5], which gave rise to endogenous capacity theories, with a set of indicators associated to their empirical verification, and others such as R&D efforts, proxies for education, skills, etc. Thus, theories that regard economic growth only as the consequence of capital and labor in- crease were al- most supplemented by this “residual” factor that consid- ers the technological factor―particularly innovation―as the ultimate explanatory variable. On the other hand, the evolutionary line of thinking, rooted in Schumpeter’s ideas, gave rise to a lot of litera- ture and research work about the link between techno- logical innovation and large changes in economic cycles through “creative destruction” processes, [6-10]. In turn, since very early on, even since “pre-modern” times, economic growth has been considered a goal in itself, linked to human welfare growth [11]. For instance, in 1377, the Arabian economic thinker Ibn Khaldun pro- vided one of the earliest descriptions of economic growth in his Muqaddimah (known as Prolegomena in the Western world): “When civilization [population] increases, the avail- able labor again increases. In turn, luxury again in- creases in correspondence with the increasing profit, and the customs and needs of luxury increase. Crafts are created to obtain luxury products. The value realized from them increases, and, as a result, profits are again multiplied in the town. Production there is thriving even more than before. And so it goes with the second and third increase. All the additional labor serves luxury and wealth, in contrast to the original labor that served the necessity of life [11].” At least since 1940, mitigation and prevention of the negative effects of a long economic crisis – or of reces- sion periods – has been a major concern for governments. No doubt, such concern is related to the fact that no in- dustrial society can survive if it does not guarantee the means for its permanent reproduction, from which better human welfare should derive. In a modern society, this necessarily implies the possibility of guaranteeing the access to employment and jobs that, in turn, will permit the necessary earnings to fulfil basic needs and, no doubt, other not so basic ones but which have to do with sub- ject- tive needs of the individuals and which are the con- sequence of living in a certain society and of the fact that the economic system needs to sell goods and services in the market. Thus, after the “great depression”, Keynes’s ideas dominated economic practices almost without ex- ception, until about 1965 or 1969-1975, when the phe- nomenon known as stagnation with inflation―or stagfla- tion – appeared. It should be remembered that, at the time, the term itself sounded awkward, since in post-war macroeconomic theory, inflation and recession were re- garded as mutually exclusive. Since then, attempts to show that alternatives involving neoclassical and mone- tarist policies could be superior in terms of growth re- sults have been permanent, although some have consid- ered that this prevailing line of thinking has been merely the result of a new axiomatics―and its subsequent for- malization―imposed by scholars, and has absolutely no correlation with empirical evidence [12]. On the other hand, there is indisputable evidence that the product per individual has been growing at a global scale, in spite of cyclical crises. This has obscured even more the real perception of the structural limits of growth, about which the Club of Rome has contributed, for some decades already, pioneering research on resource ex- haustion and the subsequent emphasis on the need to reach sustainable development. This involves not only natural resources, but also the society and the environment. Issues regarding “convergence” ―from the pioneering work by Baumol, Barro and Sala-i-Martín [13,14], other more recent work [15], and research on growth stages and equality, based on Kustnetz [16]―are still under discussion. Their significance may be explained more by the expectations that economic development creates in terms of human welfare than by the contradictory results of empirical measurements. Likewise, some interpretations of the new spatial bal- ance of global economic growth due to the role played by emerging economies – which could easily compensate the slowing pace of activity in the US and Japan, both of which should remain well contained―are based on a simplistic interpretation of innovation as the driver of growth and of the role of China and India (which could boost world economy to its highest level ever since the first wave of growth after the second Industrial Revolu- tion) [1,17]. These interpretations affect empirical results regarding the debates on growth, convergence and equal- ity, and also overlook the identification of probably more robust factors that could explain both the diversity of drivers of growth, such as this new spatial balance of the world product, and also important links between techno- logical innovation, shorter product life cycles, urbaniza- tion and income distribution considered from an evolu- tionary perspective of a wider explanatory scope. The world crisis at the end of 2007―and its subse- Copyright © 2011 SciRes. ME  R. K.-F. BARILOCHE231 quent job destruction―cannot be understood correctly by the conceptualizations described above. Nor could they explain the apparent paradox of a developed world – overcome by a deep crisis―coexisting with growth in emerging economies and a high demand of basic raw materials (part of the growth driver in some regions). Approaches focusing on endogenous development and innovation cannot fully explain either the reasons for the growing inequality and poverty―despite the greater world dynamics until before the crisis, not to mention its huge impact on the worsening of the situation. This is so despite the fact that these factors, among others, can ac- tually explain to some extent the rate of competitiveness across nations within the context of market globalization. However, neither the negative role of “innovation” on the possibilities of better income distribution, nor the importance of innovation as a natural result of market saturation have ever been considered seriously enough. 3. What do the Data Show about Economic Growth? It has usually been considered that the world product per individual has constantly increased for the last fifty or sixty years, despite cyclical crises. Likewise, as has al- ready been mentioned, growth explanatory factors have, in the last decades, focused too much on the role of technological innovation as the main driver of growth, disregarding the classical theory that considered the growth of primary factors such as labor, capital and land essential. However, the “territorial” extension of capital- ism is more related to such primary explanatory factors than to technical progress, though it does not exclude it. Territorial expansion certainly implies urbanization as central to the industrial production mode. However, the data currently used to show an increase in productivity simply establish the quotient between the gross world product (GWP) and total population as a way of showing the continuous growth of human progress. (Figure 1) What these data conceal is the fact that most economic growth is concomitant with urbanization processes at a world scale. The interpretation of such continuous GDP/ individual growth trend is modified, partly, if the gross world product is divided by urban population. Although both trends seem very similar, the first nota- ble difference between them is that, whereas the annual average increase in per capita product value for total population shows only a slight slowdown between 1980 and 1995, it never falls to its absolute global value. However, the quotient between GDP and total urban population quite clearly shows stagnation―and even a decrease of that indicator―in the same period (Figure 2). The interpretation of these trends also differs radically. Whereas the indicator for GDP/individual estimated with total population data shows a slowdown but an increase- ing trend in the long term, the product/urban inhabitant data show the opposite trend (Figure 3). Thus, whereas between 1960 and 1975 the absolute value increase of product/urban inhabitant was 2.5 higher than the average one between 1975 and 2000 and 1.4 higher than the 2000 - 2010 value, the proportion is 1.2 and 0.8 respectively for the same total population indi- cator. That is, whereas the global indicator (GWP/individual) shows a smaller fluctuation and though it has a decreas- ing tendency in the long term, it could be inferred that it goes back to long term levels after the world economy recovery until the recent 2009-2010 crisis. Then, once the crisis was overcome, the world would continue to have new and never-ending prosperity trends. Yet, the urban population indicator has been more fluctuating in the three long periods under consideration. This should seriously warn about the link between urbanization limits and growth limits, and casts doubts on the economic ac- tivity basis on which the product, and therefore also in- come and jobs, may be maintained in future. On the other hand, though the annual average increase in abso- lute value of GDP/urban inhabitant was almost 100% higher than GDP/total inhabitant between 1960 and 1975, as of that year, both values have been almost similar. This points to a central aspect of the hypotheses that will be formulated below: far from accompanying world product growth, or being the result of such growth―as is sometimes considered―urbanization is also, to a great extent, its cause or a “real economic growth’s machine”. Therefore, the implications of this fact on the general long-term slowdown of economic dynamics, and what may be expected of such growth once urbanization proc- esses are completed at a world level will be analysed here. Finally, it should be noted that the world economic growth trend is clearly decreasing, beyond the manage- ment―by means of different “economic policy recipes” – of recession crises and decreasing periods whose causes deserve to be considered seriously Table 1 and Figure 4. 4. Urbanization, Growth and Technological Change: the Structural Overcapacity Crisis and its Effects. The urbanization process of the last two centuries went hand in hand with large clusters of technical innovations that took place during the period. All these innovative processes have been fully described in the literature [6-0]. Besides, it has been common practice to relate 1 Copyright © 2011 SciRes. ME 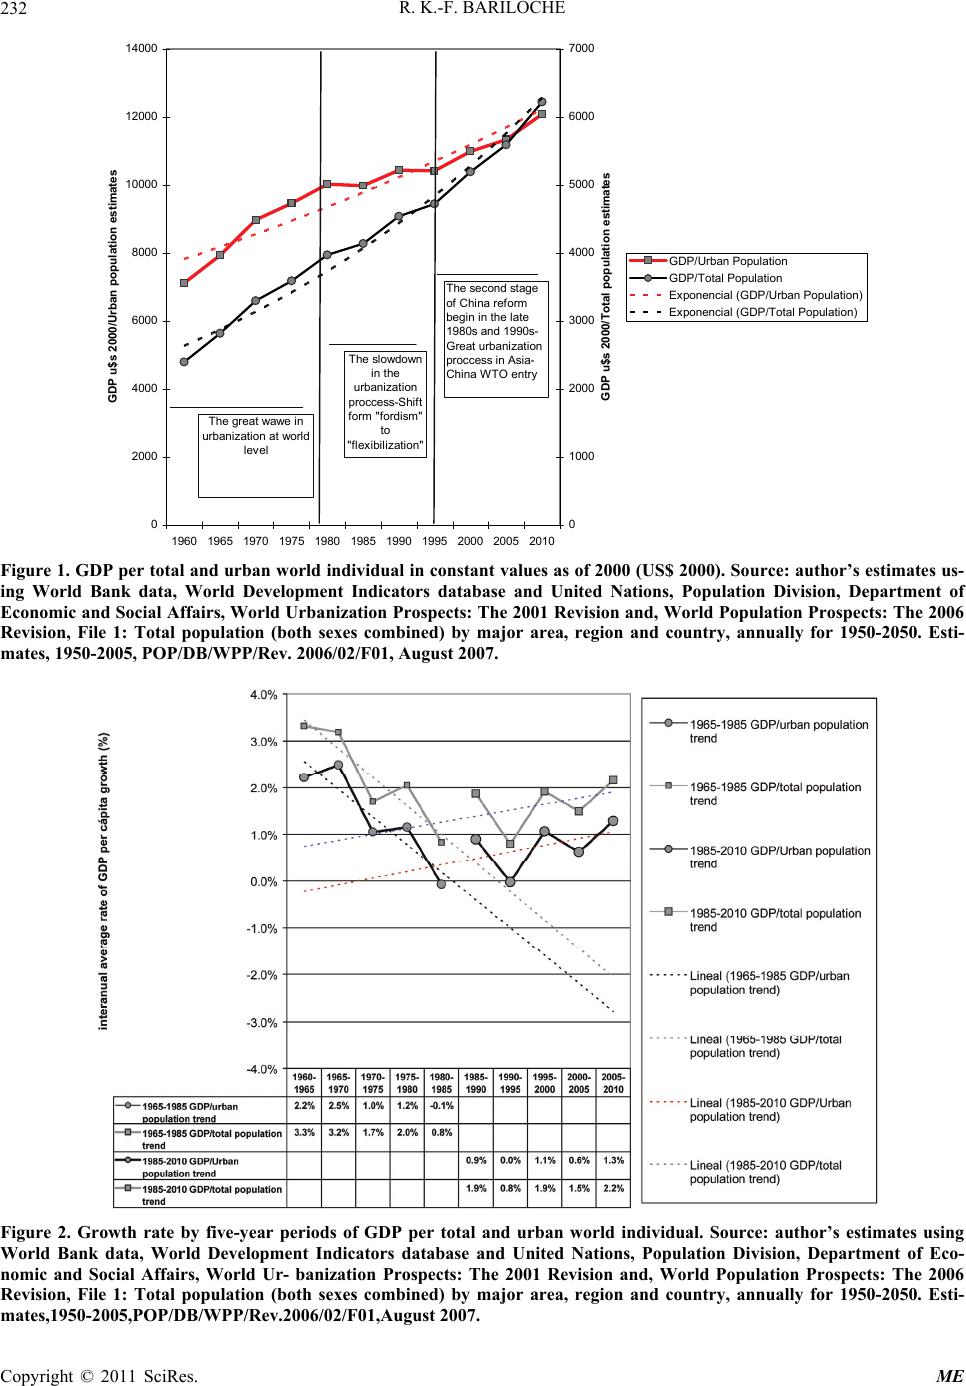 R. K.-F. BARILOCHE Copyright © 2011 SciRes. ME 232 0 2000 4000 6000 8000 10000 12000 14000 1960 1965 1970 1975 1980 1985 1990 1995 2000 2005 2010 GDP u$s 2000/Urban population estimates 0 1000 2000 3000 4000 5000 6000 7000 GDP u$s 2000/Total population estimates GDP/Urban Population GDP/Total Population Exponencial (GDP/Urban Population) Exponencial (GDP/Total Population) The second stage of China reform begin in the late 1980s and 1990s- Great urbanization proccess in Asia- China WTO entry The great wawe in urbanization at world level The slowdown in the urbanization proccess-Shift form "fordism" to "flexibilization" Figure 1. GDP per total and urban world individual in constant values as of 2000 (US$ 2000). Source: author’s estimates us- ing World Bank data, World Development Indicators database and United Nations, Population Division, Department of Economic and Social Affairs, World Urbanization Prospects: The 2001 Revision and, World Population Prospects: The 2006 Revision, File 1: Total population (both sexes combined) by major area, region and country, annually for 1950-2050. Esti- mates, 1950-2005, POP/DB/WPP/Rev. 2006/02/F01, August 2007. Figure 2. Growth rate by five-year periods of GDP per total and urban world individual. Source: author’s estimates using World Bank data, World Development Indicators database and United Nations, Population Division, Department of Eco- nomic and Social Affairs, World Ur- banization Prospects: The 2001 Revision and, World Population Prospects: The 2006 Revision, File 1: Total population (both sexes combined) by major area, region and country, annually for 1950-2050. Esti- mates,1950-2005,POP/DB/WPP/Rev.2006/02/F01,August 2007. 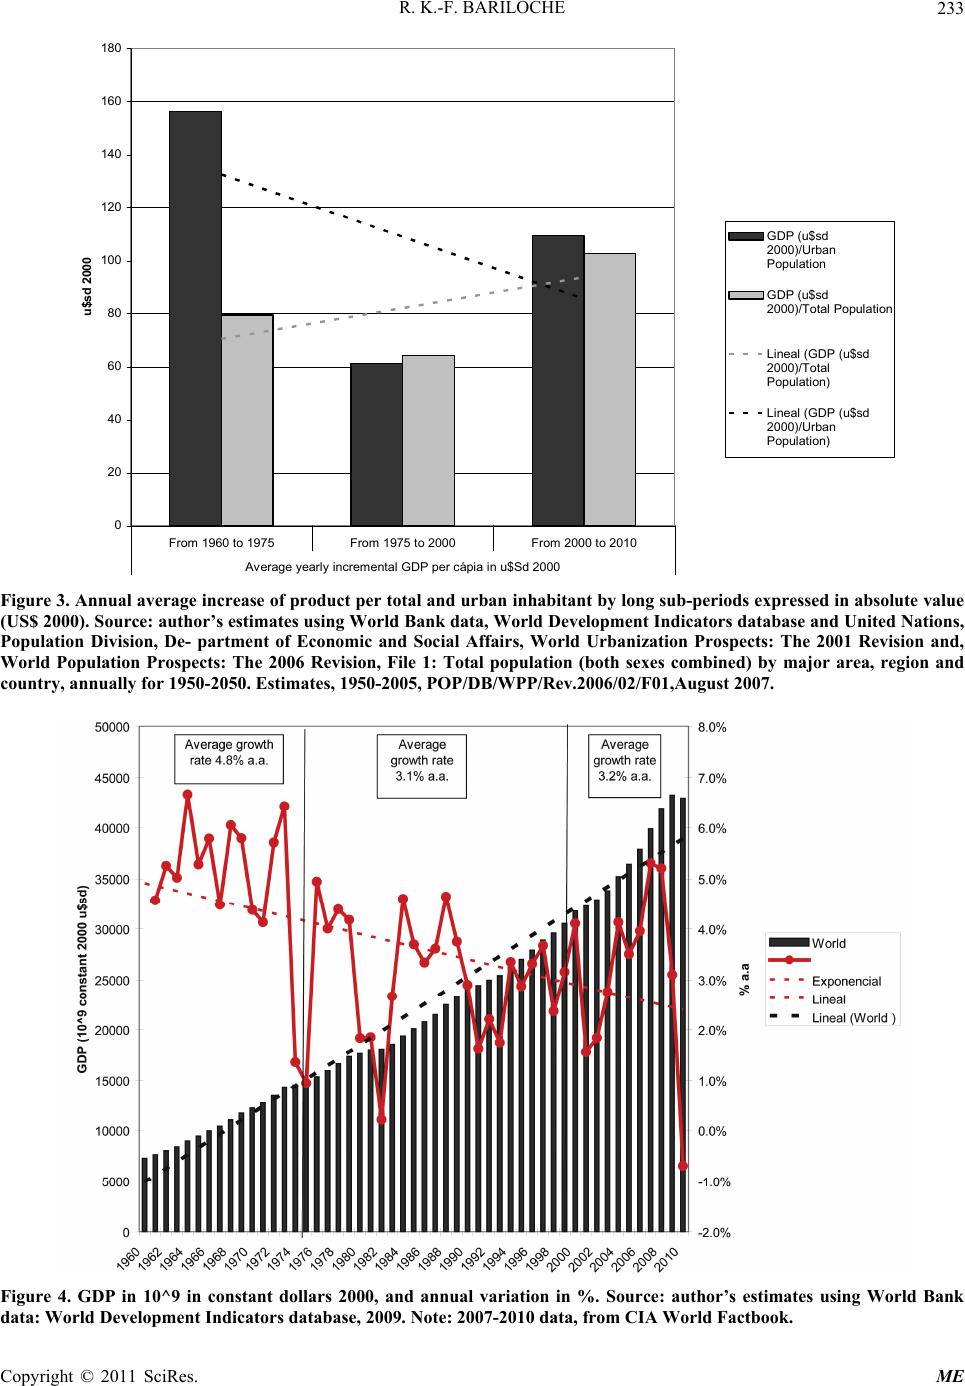 R. K.-F. BARILOCHE233 0 20 40 60 80 100 120 140 160 180 From 1960 to 1975From 1975 to 2000From 2000 to 2010 Average yearly incremental GDP per cápia in u$Sd 2000 u$sd 2000 GDP (u$sd 2000)/Urban Popul ation GDP (u$sd 2000)/Total Population Lineal (GDP (u$sd 2000)/Total Popul ation) Lineal (GDP (u$sd 2000)/Urban Popul ation) Figure 3. Annual average increase of product per total and urban inhabitant by long sub-periods expressed in absolute value (US$ 2000). Source: author’s estimates using World Bank data, World Development Indicators database and United Nations, Population Division, De- partment of Economic and Social Affairs, World Urbanization Prospects: The 2001 Revision and, World Population Prospects: The 2006 Revision, File 1: Total population (both sexes combined) by major area, region and country, annually for 1950-2050. Estimates, 1950-2005, POP/DB/WPP/Rev.2006/02/F01,August 2007. Figure 4. GDP in 10^9 in constant dollars 2000, and annual variation in %. Source: author’s estimates using World Bank ata: World Development Indicators database, 2009. Note: 2007-2010 data, from CIA World Factbook. d Copyright © 2011 SciRes. ME 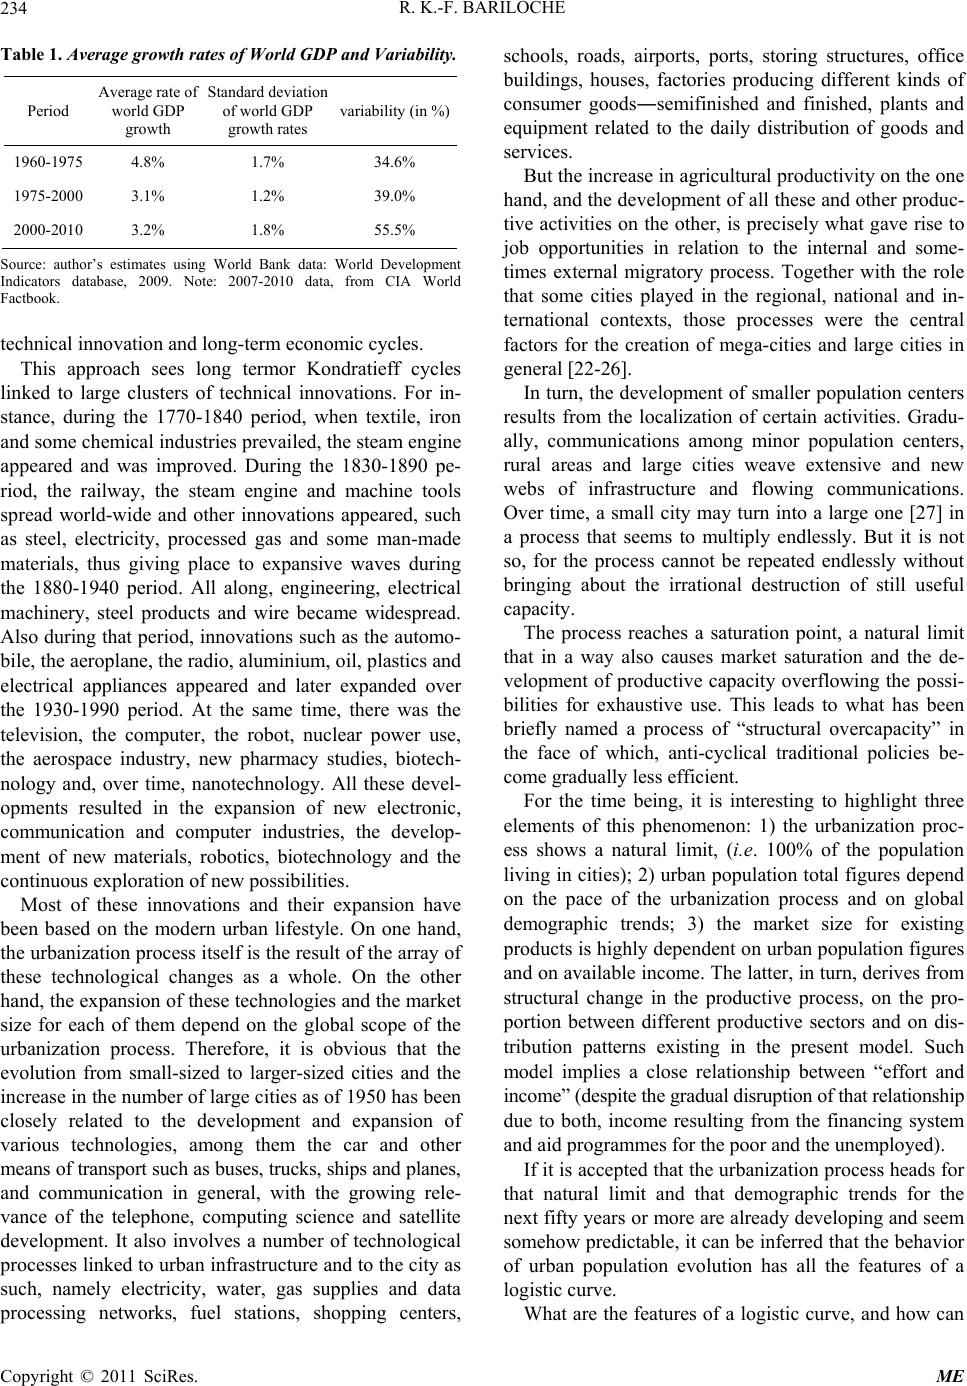 R. K.-F. BARILOCHE Copyright © 2011 SciRes. ME 234 Table 1. Average growth rates of World GDP and Variability. Period Average rate of world GDP growth Standard deviation of world GDP growth rates variability (in %) 1960-1975 4.8% 1.7% 34.6% 1975-2000 3.1% 1.2% 39.0% 2000-2010 3.2% 1.8% 55.5% Source: author’s estimates using World Bank data: World Development Indicators database, 2009. Note: 2007-2010 data, from CIA World Factbook. technical innovation and long-term economic cycles. This approach sees long termor Kondratieff cycles linked to large clusters of technical innovations. For in- stance, during the 1770-1840 period, when textile, iron and some chemical industries prevailed, the steam engine appeared and was improved. During the 1830-1890 pe- riod, the railway, the steam engine and machine tools spread world-wide and other innovations appeared, such as steel, electricity, processed gas and some man-made materials, thus giving place to expansive waves during the 1880-1940 period. All along, engineering, electrical machinery, steel products and wire became widespread. Also during that period, innovations such as the automo- bile, the aeroplane, the radio, aluminium, oil, plastics and electrical appliances appeared and later expanded over the 1930-1990 period. At the same time, there was the television, the computer, the robot, nuclear power use, the aerospace industry, new pharmacy studies, biotech- nology and, over time, nanotechnology. All these devel- opments resulted in the expansion of new electronic, communication and computer industries, the develop- ment of new materials, robotics, biotechnology and the continuous exploration of new possibilities. Most of these innovations and their expansion have been based on the modern urban lifestyle. On one hand, the urbanization process itself is the result of the array of these technological changes as a whole. On the other hand, the expansion of these technologies and the market size for each of them depend on the global scope of the urbanization process. Therefore, it is obvious that the evolution from small-sized to larger-sized cities and the increase in the number of large cities as of 1950 has been closely related to the development and expansion of various technologies, among them the car and other means of transport such as buses, trucks, ships and planes, and communication in general, with the growing rele- vance of the telephone, computing science and satellite development. It also involves a number of technological processes linked to urban infrastructure and to the city as such, namely electricity, water, gas supplies and data processing networks, fuel stations, shopping centers, schools, roads, airports, ports, storing structures, office buildings, houses, factories producing different kinds of consumer goods―semifinished and finished, plants and equipment related to the daily distribution of goods and services. But the increase in agricultural productivity on the one hand, and the development of all these and other produc- tive activities on the other, is precisely what gave rise to job opportunities in relation to the internal and some- times external migratory process. Together with the role that some cities played in the regional, national and in- ternational contexts, those processes were the central factors for the creation of mega-cities and large cities in general [22-26]. In turn, the development of smaller population centers results from the localization of certain activities. Gradu- ally, communications among minor population centers, rural areas and large cities weave extensive and new webs of infrastructure and flowing communications. Over time, a small city may turn into a large one [27] in a process that seems to multiply endlessly. But it is not so, for the process cannot be repeated endlessly without bringing about the irrational destruction of still useful capacity. The process reaches a saturation point, a natural limit that in a way also causes market saturation and the de- velopment of productive capacity overflowing the possi- bilities for exhaustive use. This leads to what has been briefly named a process of “structural overcapacity” in the face of which, anti-cyclical traditional policies be- come gradually less efficient. For the time being, it is interesting to highlight three elements of this phenomenon: 1) the urbanization proc- ess shows a natural limit, (i.e. 100% of the population living in cities); 2) urban population total figures depend on the pace of the urbanization process and on global demographic trends; 3) the market size for existing products is highly dependent on urban population figures and on available income. The latter, in turn, derives from structural change in the productive process, on the pro- portion between different productive sectors and on dis- tribution patterns existing in the present model. Such model implies a close relationship between “effort and income” (despite the gradual disruption of that relationship due to both, income resulting from the financing system and aid programmes for the poor and the unemployed). If it is accepted that the urbanization process heads for that natural limit and that demographic trends for the next fifty years or more are already developing and seem somehow predictable, it can be inferred that the behavior of urban population evolution has all the features of a logistic curve. What are the features of a logistic curve, and how can 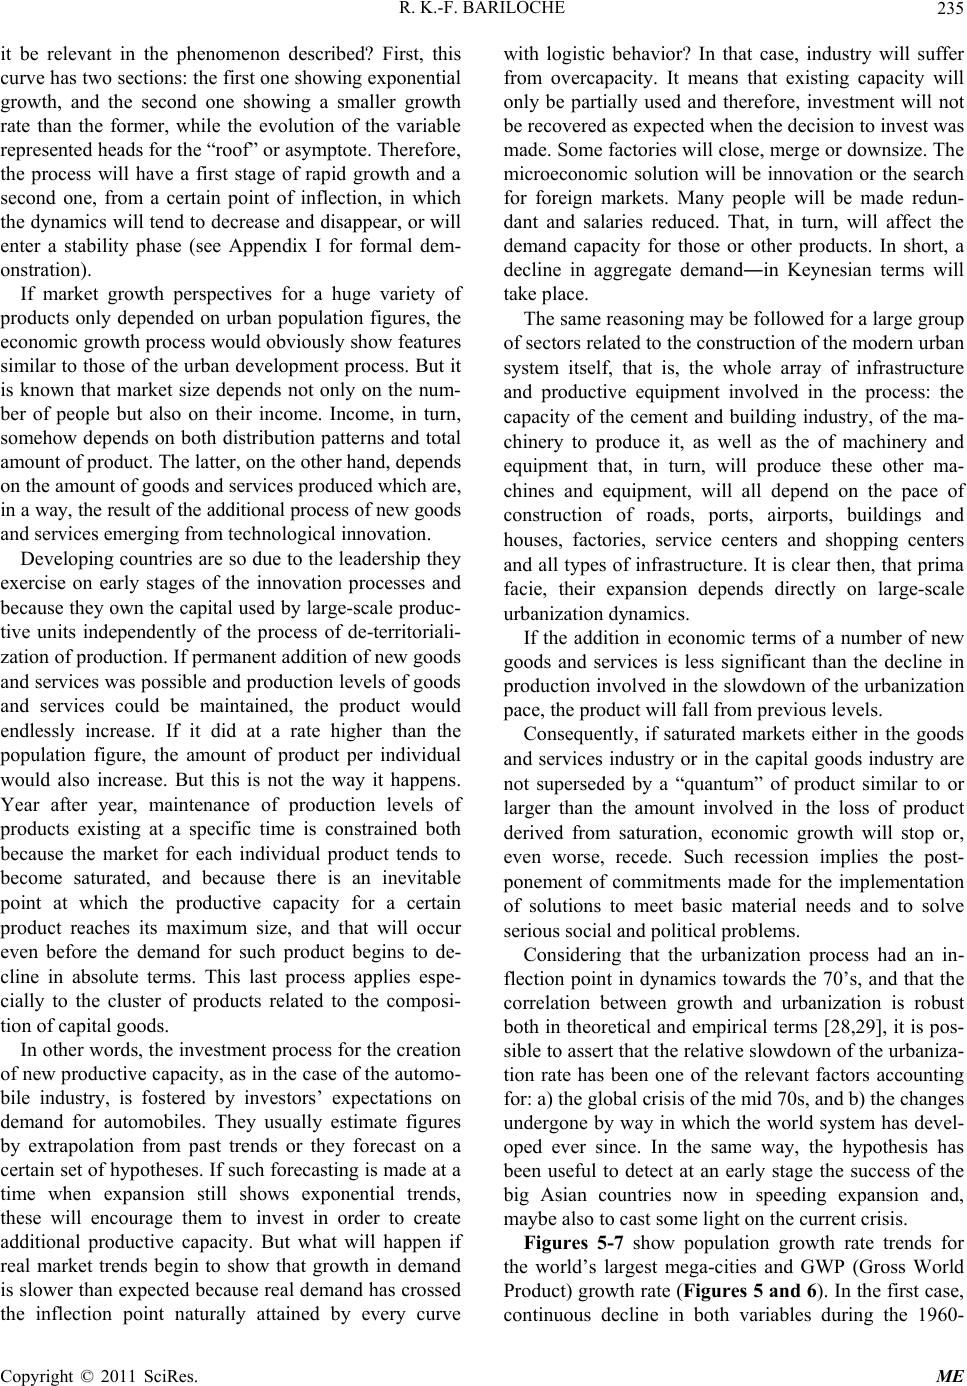 R. K.-F. BARILOCHE235 it be relevant in the phenomenon described? First, this curve has two sections: the first one showing exponential growth, and the second one showing a smaller growth rate than the former, while the evolution of the variable represented heads for the “roof” or asymptote. Therefore, the process will have a first stage of rapid growth and a second one, from a certain point of inflection, in which the dynamics will tend to decrease and disappear, or will enter a stability phase (see Appendix I for formal dem- onstration). If market growth perspectives for a huge variety of products only depended on urban population figures, the economic growth process would obviously show features similar to those of the urban development process. But it is known that market size depends not only on the num- ber of people but also on their income. Income, in turn, somehow depends on both distribution patterns and total amount of product. The latter, on the other hand, depends on the amount of goods and services produced which are, in a way, the result of the additional process of new goods and services emerging from technological innovation. Developing countries are so due to the leadership they exercise on early stages of the innovation processes and because they own the capital used by large-scale produc- tive units independently of the process of de-territoriali- zation of production. If permanent addition of new goods and services was possible and production levels of goods and services could be maintained, the product would endlessly increase. If it did at a rate higher than the population figure, the amount of product per individual would also increase. But this is not the way it happens. Year after year, maintenance of production levels of products existing at a specific time is constrained both because the market for each individual product tends to become saturated, and because there is an inevitable point at which the productive capacity for a certain product reaches its maximum size, and that will occur even before the demand for such product begins to de- cline in absolute terms. This last process applies espe- cially to the cluster of products related to the composi- tion of capital goods. In other words, the investment process for the creation of new productive capacity, as in the case of the automo- bile industry, is fostered by investors’ expectations on demand for automobiles. They usually estimate figures by extrapolation from past trends or they forecast on a certain set of hypotheses. If such forecasting is made at a time when expansion still shows exponential trends, these will encourage them to invest in order to create additional productive capacity. But what will happen if real market trends begin to show that growth in demand is slower than expected because real demand has crossed the inflection point naturally attained by every curve with logistic behavior? In that case, industry will suffer from overcapacity. It means that existing capacity will only be partially used and therefore, investment will not be recovered as expected when the decision to invest was made. Some factories will close, merge or downsize. The microeconomic solution will be innovation or the search for foreign markets. Many people will be made redun- dant and salaries reduced. That, in turn, will affect the demand capacity for those or other products. In short, a decline in aggregate demand―in Keynesian terms will take place. The same reasoning may be followed for a large group of sectors related to the construction of the modern urban system itself, that is, the whole array of infrastructure and productive equipment involved in the process: the capacity of the cement and building industry, of the ma- chinery to produce it, as well as the of machinery and equipment that, in turn, will produce these other ma- chines and equipment, will all depend on the pace of construction of roads, ports, airports, buildings and houses, factories, service centers and shopping centers and all types of infrastructure. It is clear then, that prima facie, their expansion depends directly on large-scale urbanization dynamics. If the addition in economic terms of a number of new goods and services is less significant than the decline in production involved in the slowdown of the urbanization pace, the product will fall from previous levels. Consequently, if saturated markets either in the goods and services industry or in the capital goods industry are not superseded by a “quantum” of product similar to or larger than the amount involved in the loss of product derived from saturation, economic growth will stop or, even worse, recede. Such recession implies the post- ponement of commitments made for the implementation of solutions to meet basic material needs and to solve serious social and political problems. Considering that the urbanization process had an in- flection point in dynamics towards the 70’s, and that the correlation between growth and urbanization is robust both in theoretical and empirical terms [28,29], it is pos- sible to assert that the relative slowdown of the urbaniza- tion rate has been one of the relevant factors accounting for: a) the global crisis of the mid 70s, and b) the changes undergone by way in which the world system has devel- oped ever since. In the same way, the hypothesis has been useful to detect at an early stage the success of the big Asian countries now in speeding expansion and, maybe also to cast some light on the current crisis. Figures 5-7 show population growth rate trends for the world’s largest mega-cities and GWP (Gross World Product) growth rate (Figures 5 and 6). In the first case, continuous decline in both variables during the 1960- Copyright © 2011 SciRes. ME 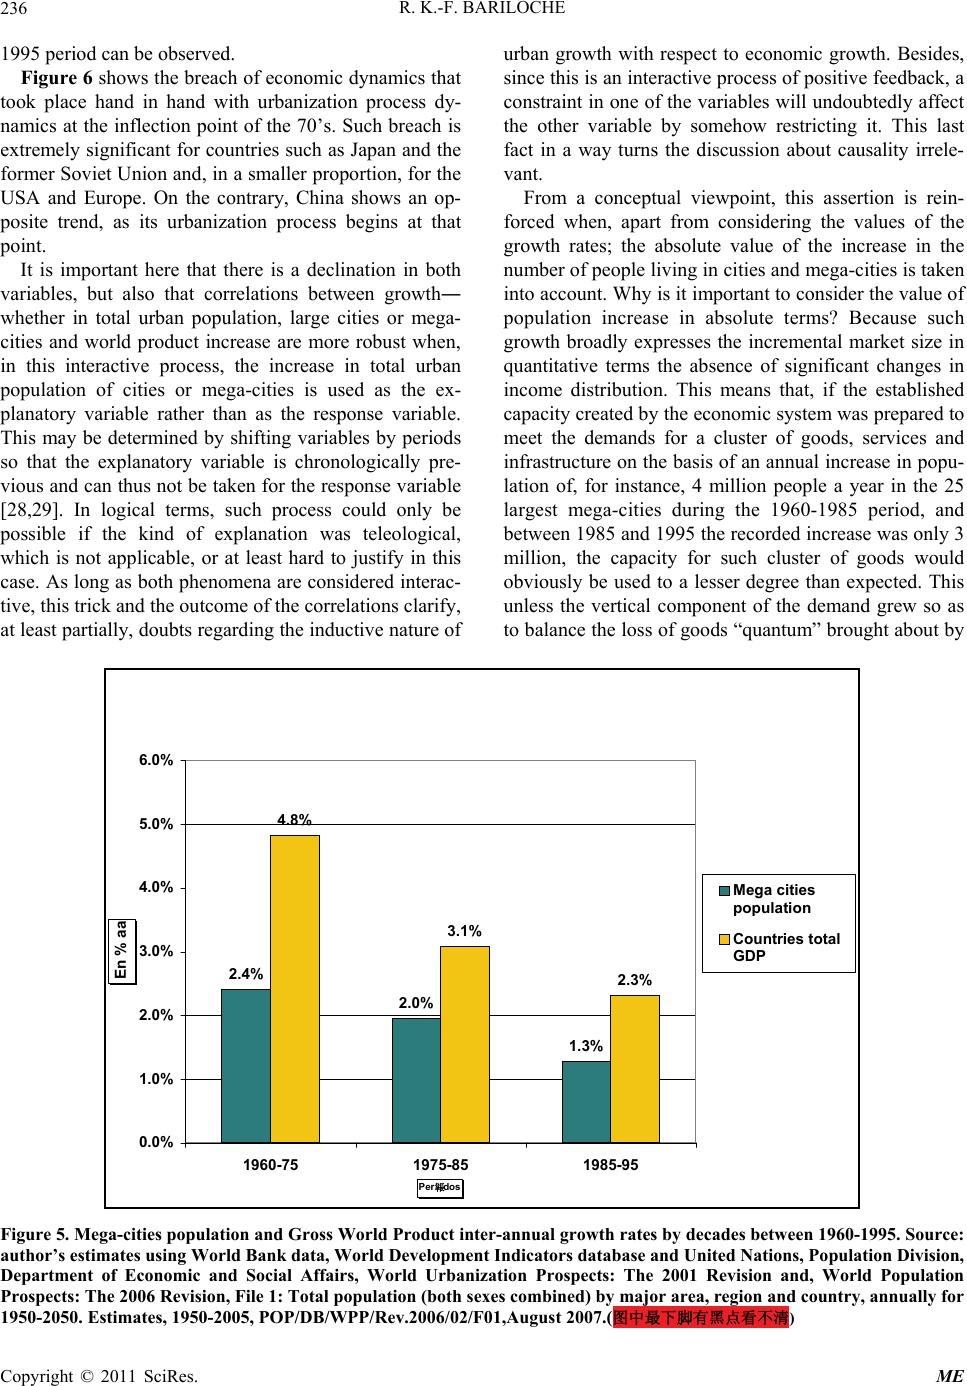 R. K.-F. BARILOCHE Copyright © 2011 SciRes. ME 236 1995 period can be observed. Figure 6 shows the breach of economic dynamics that took place hand in hand with urbanization process dy- namics at the inflection point of the 70’s. Such breach is extremely significant for countries such as Japan and the former Soviet Union and, in a smaller proportion, for the USA and Europe. On the contrary, China shows an op- posite trend, as its urbanization process begins at that point. It is important here that there is a declination in both variables, but also that correlations between growth― whether in total urban population, large cities or mega- cities and world product increase are more robust when, in this interactive process, the increase in total urban population of cities or mega-cities is used as the ex- planatory variable rather than as the response variable. This may be determined by shifting variables by periods so that the explanatory variable is chronologically pre- vious and can thus not be taken for the response variable [28,29]. In logical terms, such process could only be possible if the kind of explanation was teleological, which is not applicable, or at least hard to justify in this case. As long as both phenomena are considered interac- tive, this trick and the outcome of the correlations clarify, at least partially, doubts regarding the inductive nature of urban growth with respect to economic growth. Besides, since this is an interactive process of positive feedback, a constraint in one of the variables will undoubtedly affect the other variable by somehow restricting it. This last fact in a way turns the discussion about causality irrele- vant. From a conceptual viewpoint, this assertion is rein- forced when, apart from considering the values of the growth rates; the absolute value of the increase in the number of people living in cities and mega-cities is taken into account. Why is it important to consider the value of population increase in absolute terms? Because such growth broadly expresses the incremental market size in quantitative terms the absence of significant changes in income distribution. This means that, if the established capacity created by the economic system was prepared to meet the demands for a cluster of goods, services and infrastructure on the basis of an annual increase in popu- lation of, for instance, 4 million people a year in the 25 largest mega-cities during the 1960-1985 period, and between 1985 and 1995 the recorded increase was only 3 million, the capacity for such cluster of goods would obviously be used to a lesser degree than expected. This unless the vertical component of the demand grew so as to balance the loss of goods “quantum” brought about by 2.4% 2.0% 1.3% 4.8% 3.1% 2.3% 0.0% 1.0% 2.0% 3.0% 4.0% 5.0% 6.0% 1960-75 1975-85 1985-95 Per韔dos En % aa Mega cities population Countries total GDP Figure 5. Mega-cities population and Gross World Product inter-annual growth rates by decades between 1960-1995. Source: author’s estimates using World Bank data, World Development Indicators database and United Nations, Population Division, Department of Economic and Social Affairs, World Urbanization Prospects: The 2001 Revision and, World Population Prospects: The 2006 Revision, File 1: Total population (both sexes combined) by major area, region and country, annually for 1950-2050. Estimates, 1950-2005, POP/DB/WPP/Rev.2006/02/F01,August 2007.(图中最下脚有黑点看不清) 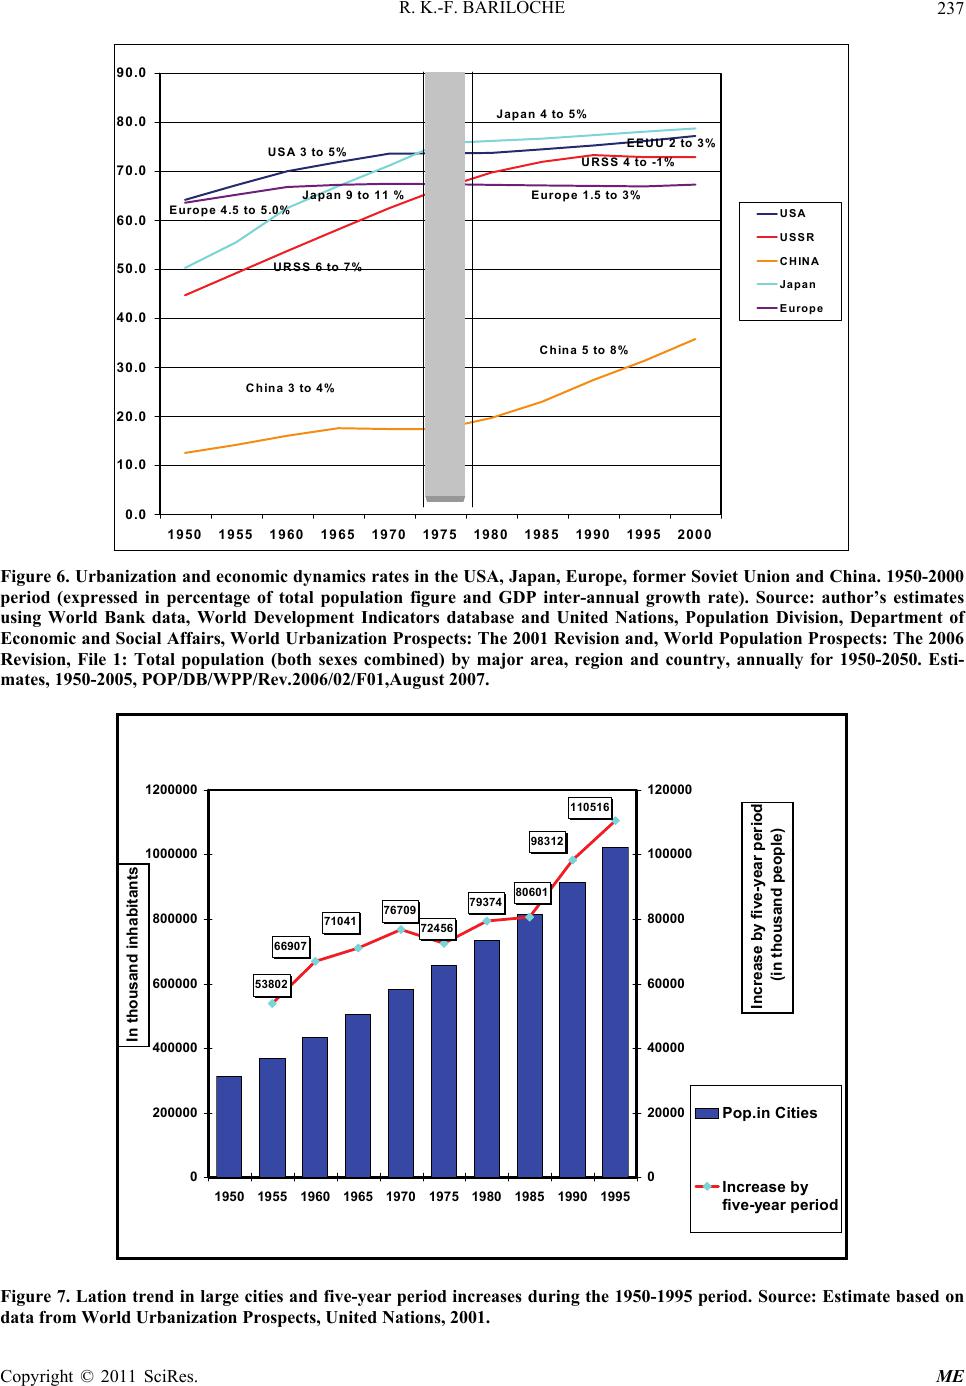 R. K.-F. BARILOCHE237 0.0 10.0 20.0 30.0 40.0 50.0 60.0 70.0 80.0 90.0 1950 1955 1960 1965 1970 1975 1980 1985 1990 1995 2000 USA USSR CHINA Japan Europe Japan 9 to 11 % URSS 6 to 7% China 3 to 4% Japan 4 to 5% URSS 4 to -1% China 5 to 8% USA 3 to 5%EEUU 2 to 3% Europe 4.5 to 5.0% Europe 1.5 to 3% Figure 6. Urbanization and economic dynamics rates in the USA, Japan, Europe, former Soviet Union and China. 1950-2000 period (expressed in percentage of total population figure and GDP inter-annual growth rate). Source: author’s estimates using World Bank data, World Development Indicators database and United Nations, Population Division, Department of Economic and Social Affairs, World Urbanization Prospects: The 2001 Revision and, World Population Prospects: The 2006 Revision, File 1: Total population (both sexes combined) by major area, region and country, annually for 1950-2050. Esti- mates, 1950-2005, POP/DB/WPP/Rev.2006/02/F01,August 2007. 53802 76709 79374 72456 71041 66907 80601 98312 110516 0 200000 400000 600000 800000 1000000 1200000 1950 1955 1960 1965 1970 1975 1980 1985 1990 1995 In thousand inhabitants 0 20000 40000 60000 80000 100000 120000 Increase by five-year period (in thousand people) Pop.in Cities Increase by five-year period Figure 7. Lation trend in large cities and five-year period increases during the 1950-1995 period. Source: Estimate based on ata from World Urbanization Prospects, United Nations, 2001. d Copyright © 2011 SciRes. ME 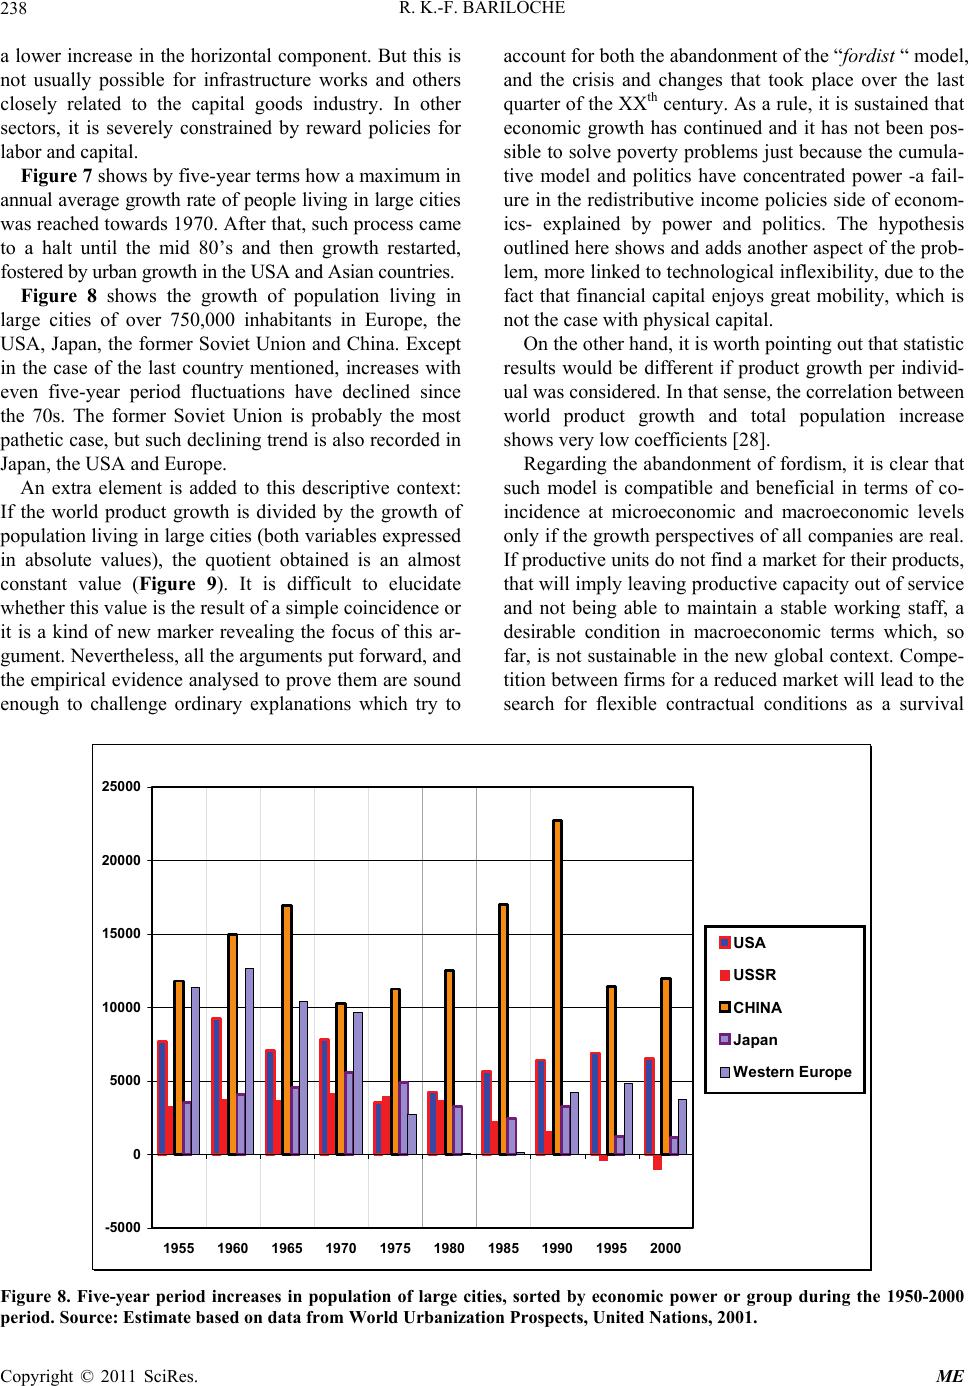 R. K.-F. BARILOCHE Copyright © 2011 SciRes. ME 238 a lower increase in the horizontal component. But this is not usually possible for infrastructure works and others closely related to the capital goods industry. In other sectors, it is severely constrained by reward policies for labor and capital. Figure 7 shows by five-year terms how a maximum in annual average growth rate of people living in large cities was reached towards 1970. After that, such process came to a halt until the mid 80’s and then growth restarted, fostered by urban growth in the USA and Asian countries. Figure 8 shows the growth of population living in large cities of over 750,000 inhabitants in Europe, the USA, Japan, the former Soviet Union and China. Except in the case of the last country mentioned, increases with even five-year period fluctuations have declined since the 70s. The former Soviet Union is probably the most pathetic case, but such declining trend is also recorded in Japan, the USA and Europe. An extra element is added to this descriptive context: If the world product growth is divided by the growth of population living in large cities (both variables expressed in absolute values), the quotient obtained is an almost constant value (Figure 9). It is difficult to elucidate whether this value is the result of a simple coincidence or it is a kind of new marker revealing the focus of this ar- gument. Nevertheless, all the arguments put forward, and the empirical evidence analysed to prove them are sound enough to challenge ordinary explanations which try to account for both the abandonment of the “fordist “ model, and the crisis and changes that took place over the last quarter of the XXth century. As a rule, it is sustained that economic growth has continued and it has not been pos- sible to solve poverty problems just because the cumula- tive model and politics have concentrated power -a fail- ure in the redistributive income policies side of econom- ics- explained by power and politics. The hypothesis outlined here shows and adds another aspect of the prob- lem, more linked to technological inflexibility, due to the fact that financial capital enjoys great mobility, which is not the case with physical capital. On the other hand, it is worth pointing out that statistic results would be different if product growth per individ- ual was considered. In that sense, the correlation between world product growth and total population increase shows very low coefficients [28]. Regarding the abandonment of fordism, it is clear that such model is compatible and beneficial in terms of co- incidence at microeconomic and macroeconomic levels only if the growth perspectives of all companies are real. If productive units do not find a market for their products, that will imply leaving productive capacity out of service and not being able to maintain a stable working staff, a desirable condition in macroeconomic terms which, so far, is not sustainable in the new global context. Compe- tition between firms for a reduced market will lead to the search for flexible contractual conditions as a survival -5000 0 5000 10000 15000 20000 25000 1955 1960 1965 1970 1975 1980 1985 1990 1995 2000 USA USSR CHINA Japan Western Europe Figure 8. Five-year period increases in population of large cities, sorted by economic power or group during the 1950-2000 period. Source: Estimate based on data from World Urbanization Prospects, United Nations, 2001. 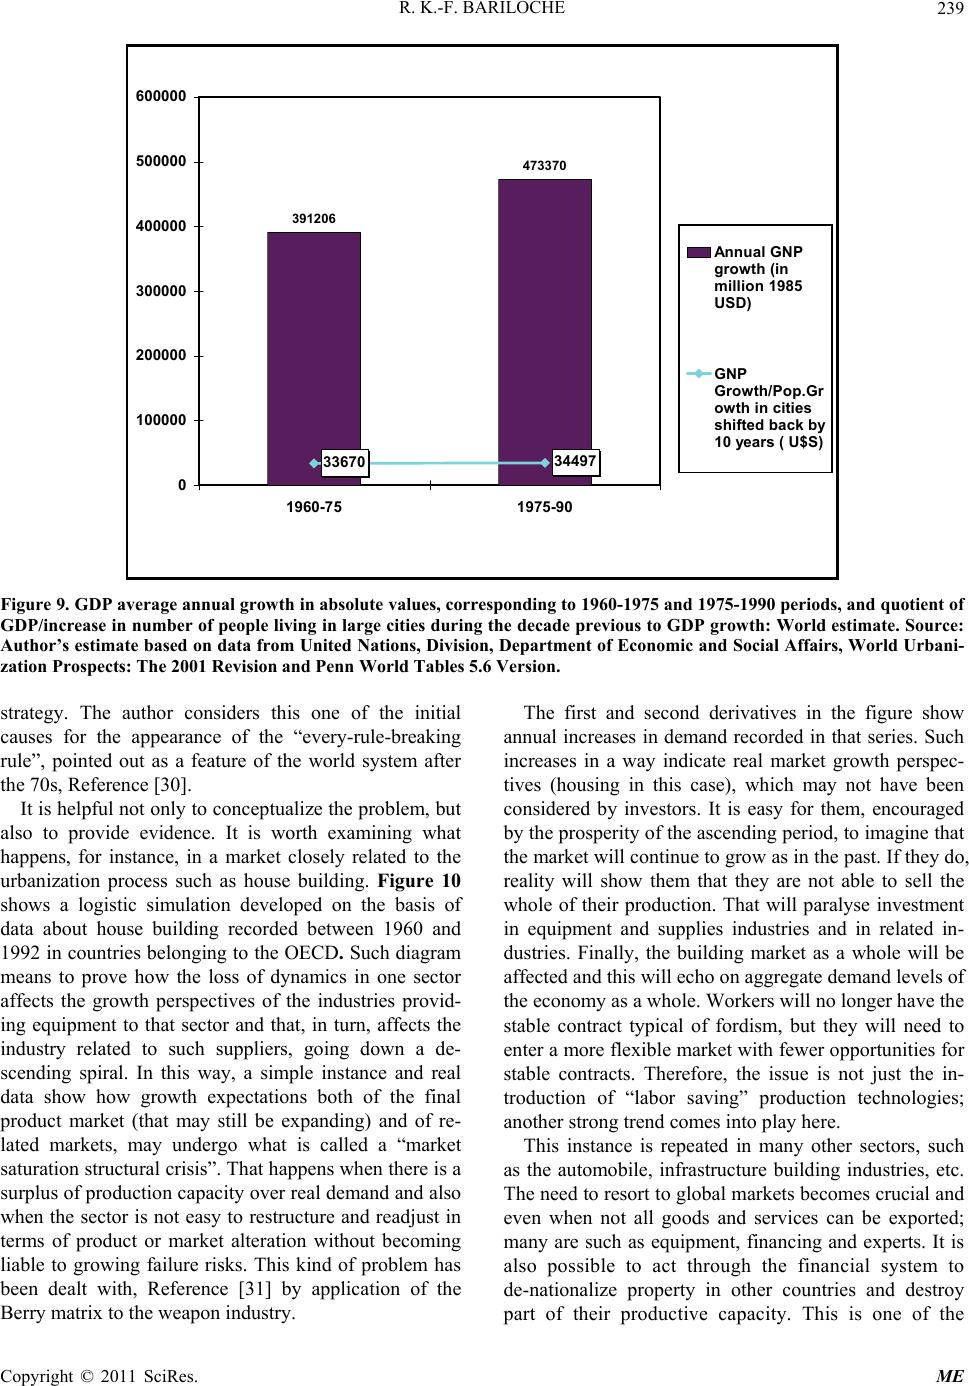 R. K.-F. BARILOCHE239 391206 473370 33670 34497 0 100000 200000 300000 400000 500000 600000 1960-75 1975-90 Annual GNP growth (in million 1985 USD) GNP Growth/Pop.Gr owth in cities shifted back by 10 years ( U$S) Figure 9. GDP average annual growth in absolute values, corresponding to 1960-1975 and 1975-1990 periods, and quotient of GDP/increase in number of people living in large cities during the decade previous to GDP growth: World estimate. Source: Author’s estimate based on data from United Nations, Division, Department of Economic and Social Affairs, World Urbani- zation Prospects: The 2001 Revision and Penn World Tables 5.6 Version. strategy. The author considers this one of the initial causes for the appearance of the “every-rule-breaking rule”, pointed out as a feature of the world system after the 70s, Reference [30]. It is helpful not only to conceptualize the problem, but also to provide evidence. It is worth examining what happens, for instance, in a market closely related to the urbanization process such as house building. Figure 10 shows a logistic simulation developed on the basis of data about house building recorded between 1960 and 1992 in countries belonging to the OECD. Such diagram means to prove how the loss of dynamics in one sector affects the growth perspectives of the industries provid- ing equipment to that sector and that, in turn, affects the industry related to such suppliers, going down a de- scending spiral. In this way, a simple instance and real data show how growth expectations both of the final product market (that may still be expanding) and of re- lated markets, may undergo what is called a “market saturation structural crisis”. That happens when there is a surplus of production capacity over real demand and also when the sector is not easy to restructure and readjust in terms of product or market alteration without becoming liable to growing failure risks. This kind of problem has been dealt with, Reference [31] by application of the Berry matrix to the weapon industry. The first and second derivatives in the figure show annual increases in demand recorded in that series. Such increases in a way indicate real market growth perspec- tives (housing in this case), which may not have been considered by investors. It is easy for them, encouraged by the prosperity of the ascending period, to imagine that the market will continue to grow as in the past. If they do, reality will show them that they are not able to sell the whole of their production. That will paralyse investment in equipment and supplies industries and in related in- dustries. Finally, the building market as a whole will be affected and this will echo on aggregate demand levels of the economy as a whole. Workers will no longer have the stable contract typical of fordism, but they will need to enter a more flexible market with fewer opportunities for stable contracts. Therefore, the issue is not just the in- troduction of “labor saving” production technologies; another strong trend comes into play here. This instance is repeated in many other sectors, such as the automobile, infrastructure building industries, etc. The need to resort to global markets becomes crucial and even when not all goods and services can be exported; many are such as equipment, financing and experts. It is also possible to act through the financial system to de-nationalize property in other countries and destroy pat of their productive capacity. This is one of the r Copyright © 2011 SciRes. ME 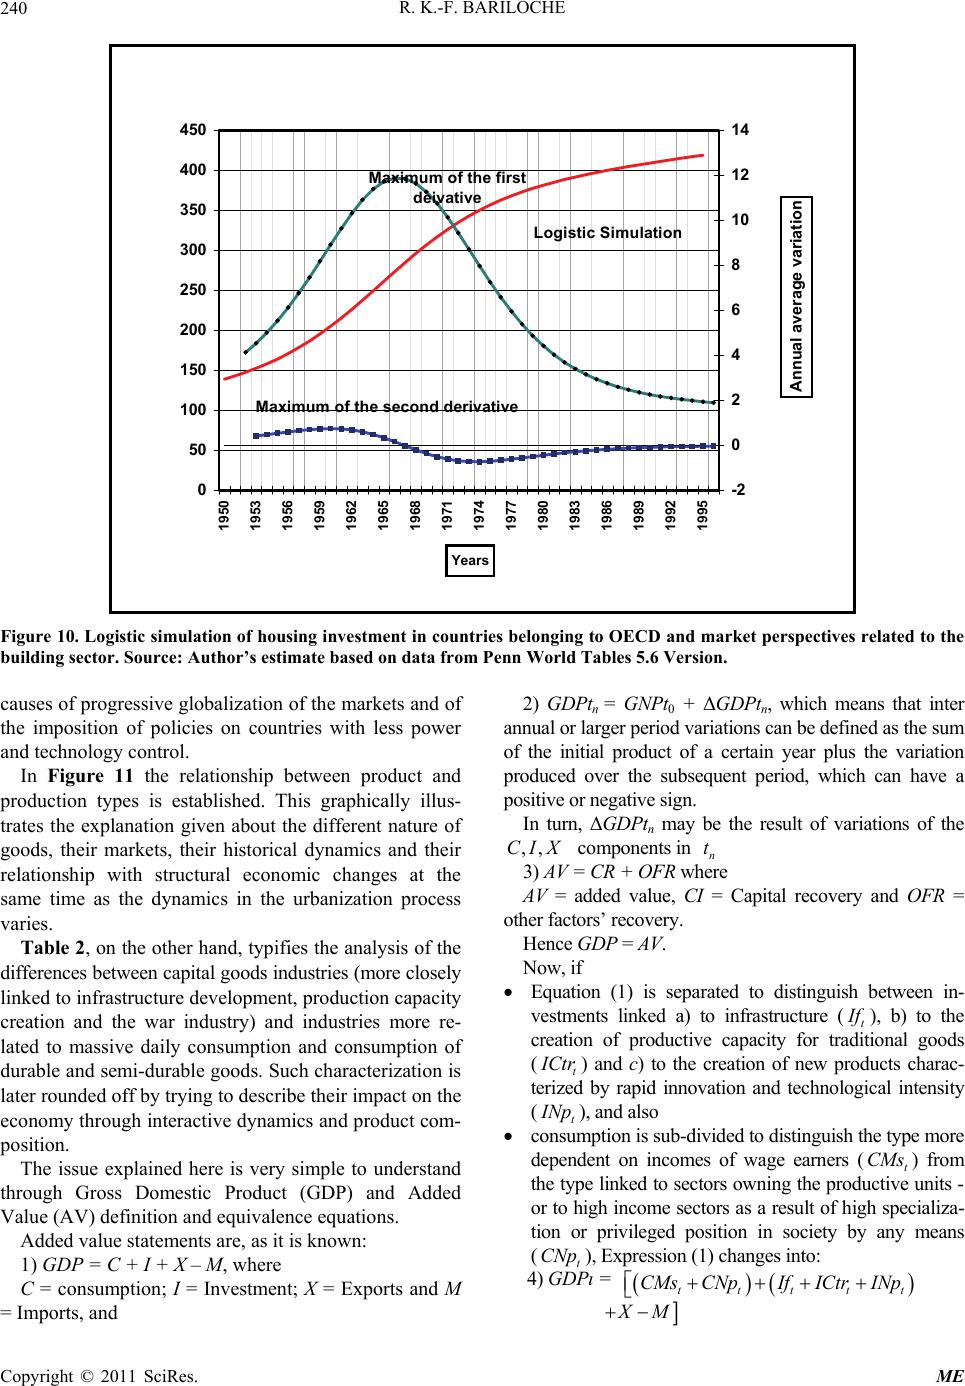 R. K.-F. BARILOCHE 240 0 50 100 150 200 250 300 350 400 450 1950 1953 1956 1959 1962 1965 1968 1971 1974 1977 1980 1983 1986 1989 1992 1995 Years -2 0 2 4 6 8 10 12 14 Annual average variation Logistic Simulation Maximum of the first deivative Maximum of the second derivative Figure 10. Logistic simulation of housing investment in countries belonging to OECD and market perspectives related to the building sector. Source: Author’s estimate based on data from Penn World Tables 5.6 Version. causes of progressive globalization of the markets and of the imposition of policies on countries with less power and technology control. In Figure 11 the relationship between product and production types is established. This graphically illus- trates the explanation given about the different nature of goods, their markets, their historical dynamics and their relationship with structural economic changes at the same time as the dynamics in the urbanization process varies. Table 2, on the other hand, typifies the analysis of the differences between capital goods industries (more closely linked to infrastructure development, production capacity creation and the war industry) and industries more re- lated to massive daily consumption and consumption of durable and semi-durable goods. Such characterization is later rounded off by trying to describe their impact on the economy through interactive dynamics and product com- position. The issue explained here is very simple to understand through Gross Domestic Product (GDP) and Added Value (AV) definition and equivalence equations. Added value statements are, as it is known: 1) GDP = C + I + X – M, where C = consumption; I = Investment; X = Exports and M = Imports, and 2) GDPtn = GNPt0 + ΔGDPtn, which means that inter annual or larger period variations can be defined as the sum of the initial product of a certain year plus the variation produced over the subsequent period, which can have a positive or negative sign. In turn, ΔGDPtn may be the result of variations of the components in ,,CIX n 3) AV = CR + OFR where t AV = added value, CI = Capital recovery and OFR = other factors’ recovery. Hence GDP = AV. Now, if Equation (1) is separated to distinguish between in- vestments linked a) to infrastructure (t I f), b) to the creation of productive capacity for traditional goods (t I Ctr ) and c) to the creation of new products charac- terized by rapid innovation and technological intensity (t I Np ), and also consumption is sub-divided to distinguish the type more dependent on incomes of wage earners (t CMs ) from the type linked to sectors owning the productive units - or to high income sectors as a result of high specializa- tion or privileged position in society by any means (CNp ), Expression (1) changes into: t 4) GDPı = tttt CMs CNpIfICtr INp t X M Copyright © 2011 SciRes. ME 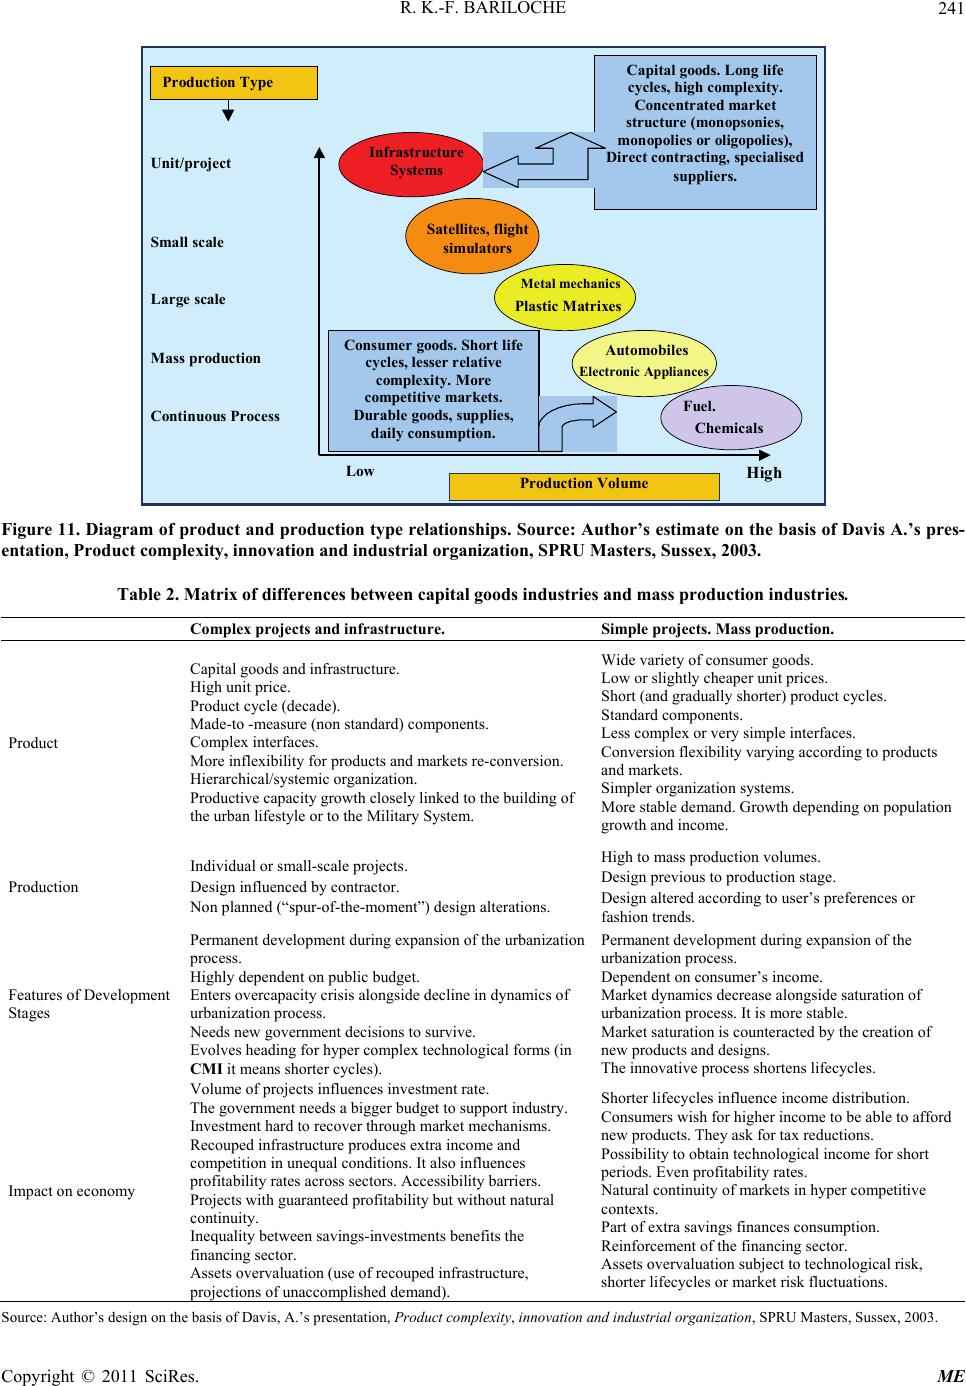 R. K.-F. BARILOCHE241 Production Volume Unit/project Small scale Large scale Mass production Continuous Process Low High Infrastructure Systems Satellites, flight simulators Metal mechanics Plastic Matrixes Automobiles Electronic Appliances Fuel. Chemicals Capital goods. Long life cycles, high complexity. Concentrated market structure (monopsonies, monopolies or oligopolies), Direct contracting, specialised suppliers. Consumer goods. Short life cycles, lesser relative complexity. More competitive markets. Durable goods, supplies, daily consumption. Production Type Figure 11. Diagram of product and production type relationships. Source: Author’s estimate on the basis of Davis A.’s pres- entation, Product complexity, innovation and industrial organization, SPRU Masters, Sussex, 2003. Table 2. Matrix of differences between capital goods industries and mass production industries. Complex projects and infrastructure. Simple projects. Mass production. Product Capital goods and infrastructure. High unit price. Product cycle (decade). Made-to -measure (non standard) components. Complex interfaces. More inflexibility for products and markets re-conversion. Hierarchical/systemic organization. Productive capacity growth closely linked to the building of the urban lifestyle or to the Military System. Wide variety of consumer goods. Low or slightly cheaper unit prices. Short (and gradually shorter) product cycles. Standard components. Less complex or very simple interfaces. Conversion flexibility varying according to products and markets. Simpler organization systems. More stable demand. Growth depending on population growth and income. Production Individual or small-scale projects. Design influenced by contractor. Non planned (“spur-of-the-moment”) design alterations. High to mass production volumes. Design previous to production stage. Design altered according to user’s preferences or fashion trends. Features of Development Stages Permanent development during expansion of the urbanization process. Highly dependent on public budget. Enters overcapacity crisis alongside decline in dynamics of urbanization process. Needs new government decisions to survive. Evolves heading for hyper complex technological forms (in CMI it means shorter cycles). Permanent development during expansion of the urbanization process. Dependent on consumer’s income. Market dynamics decrease alongside saturation of urbanization process. It is more stable. Market saturation is counteracted by the creation of new products and designs. The innovative process shortens lifecycles. Impact on economy Volume of projects influences investment rate. The government needs a bigger budget to support industry. Investment hard to recover through market mechanisms. Recouped infrastructure produces extra income and competition in unequal conditions. It also influences profitability rates across sectors. Accessibility barriers. Projects with guaranteed profitability but without natural continuity. Inequality between savings-investments benefits the financing sector. Assets overvaluation (use of recouped infrastructure, projections of unaccomplished demand). Shorter lifecycles influence income distribution. Consumers wish for higher income to be able to afford new products. They ask for tax reductions. Possibility to obtain technological income for short periods. Even profitability rates. Natural continuity of markets in hyper competitive contexts. Part of extra savings finances consumption. Reinforcement of the financing sector. Assets overvaluation subject to technological risk, shorter lifecycles or market risk fluctuations. S ource: Author’s design on the basis of Davis, A.’s presentation, Product complexity, innovation and industrial organization, SPRU Masters, Sussex, 2003. Copyright © 2011 SciRes. ME 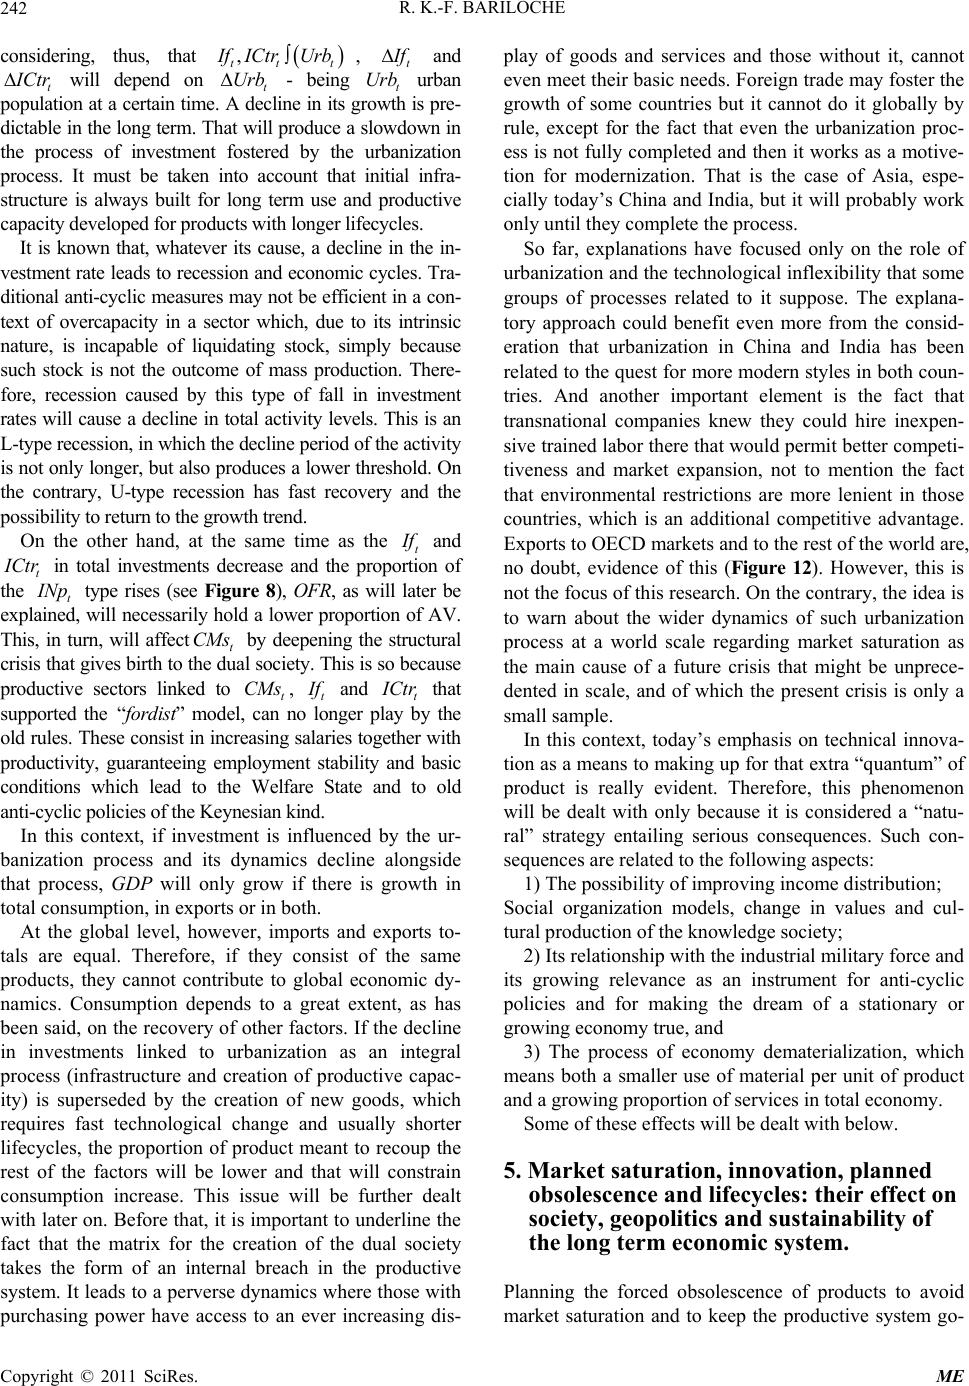 R. K.-F. BARILOCHE Copyright © 2011 SciRes. ME 242 considering, thus, that t , tt I fICtr Urb, t I f and t I Ctr will depend on t - being t urban population at a certain time. A decline in its growth is pre- dictable in the long term. That will produce a slowdown in the process of investment fostered by the urbanization process. It must be taken into account that initial infra- structure is always built for long term use and productive capacity developed for products with longer lifecycles. UrbUrb It is known that, whatever its cause, a decline in the in- vestment rate leads to recession and economic cycles. Tra- ditional anti-cyclic measures may not be efficient in a con- text of overcapacity in a sector which, due to its intrinsic nature, is incapable of liquidating stock, simply because such stock is not the outcome of mass production. There- fore, recession caused by this type of fall in investment rates will cause a decline in total activity levels. This is an L-type recession, in which the decline period of the activity is not only longer, but also produces a lower threshold. On the contrary, U-type recession has fast recovery and the possibility to return to the growth trend. On the other hand, at the same time as the t I f and t I Ctr in total investments decrease and the proportion of the t I Np type rises (see Figure 8), OFR, as will later be explained, will necessarily hold a lower proportion of AV. This, in turn, will affectt CM by deepening the structural crisis that gives birth to the dual society. This is so because productive sectors linked to t, t s CMs I f and t I Ctr that supported the “fordist” model, can no longer play by the old rules. These consist in increasing salaries together with productivity, guaranteeing employment stability and basic conditions which lead to the Welfare State and to old anti-cyclic policies of the Keynesian kind. In this context, if investment is influenced by the ur- banization process and its dynamics decline alongside that process, GDP will only grow if there is growth in total consumption, in exports or in both. At the global level, however, imports and exports to- tals are equal. Therefore, if they consist of the same products, they cannot contribute to global economic dy- namics. Consumption depends to a great extent, as has been said, on the recovery of other factors. If the decline in investments linked to urbanization as an integral process (infrastructure and creation of productive capac- ity) is superseded by the creation of new goods, which requires fast technological change and usually shorter lifecycles, the proportion of product meant to recoup the rest of the factors will be lower and that will constrain consumption increase. This issue will be further dealt with later on. Before that, it is important to underline the fact that the matrix for the creation of the dual society takes the form of an internal breach in the productive system. It leads to a perverse dynamics where those with purchasing power have access to an ever increasing dis- play of goods and services and those without it, cannot even meet their basic needs. Foreign trade may foster the growth of some countries but it cannot do it globally by rule, except for the fact that even the urbanization proc- ess is not fully completed and then it works as a motive- tion for modernization. That is the case of Asia, espe- cially today’s China and India, but it will probably work only until they complete the process. So far, explanations have focused only on the role of urbanization and the technological inflexibility that some groups of processes related to it suppose. The explana- tory approach could benefit even more from the consid- eration that urbanization in China and India has been related to the quest for more modern styles in both coun- tries. And another important element is the fact that transnational companies knew they could hire inexpen- sive trained labor there that would permit better competi- tiveness and market expansion, not to mention the fact that environmental restrictions are more lenient in those countries, which is an additional competitive advantage. Exports to OECD markets and to the rest of the world are, no doubt, evidence of this (Figure 12). However, this is not the focus of this research. On the contrary, the idea is to warn about the wider dynamics of such urbanization process at a world scale regarding market saturation as the main cause of a future crisis that might be unprece- dented in scale, and of which the present crisis is only a small sample. In this context, today’s emphasis on technical innova- tion as a means to making up for that extra “quantum” of product is really evident. Therefore, this phenomenon will be dealt with only because it is considered a “natu- ral” strategy entailing serious consequences. Such con- sequences are related to the following aspects: 1) The possibility of improving income distribution; Social organization models, change in values and cul- tural production of the knowledge society; 2) Its relationship with the industrial military force and its growing relevance as an instrument for anti-cyclic policies and for making the dream of a stationary or growing economy true, and 3) The process of economy dematerialization, which means both a smaller use of material per unit of product and a growing proportion of services in total economy. Some of these effects will be dealt with below. 5. Market saturation, innovation, planned obsolescence and lifecycles: their effect on society, geopolitics and sustainability of the long term economic system. Planning the forced obsolescence of products to avoid market saturation and to keep the productive system go- 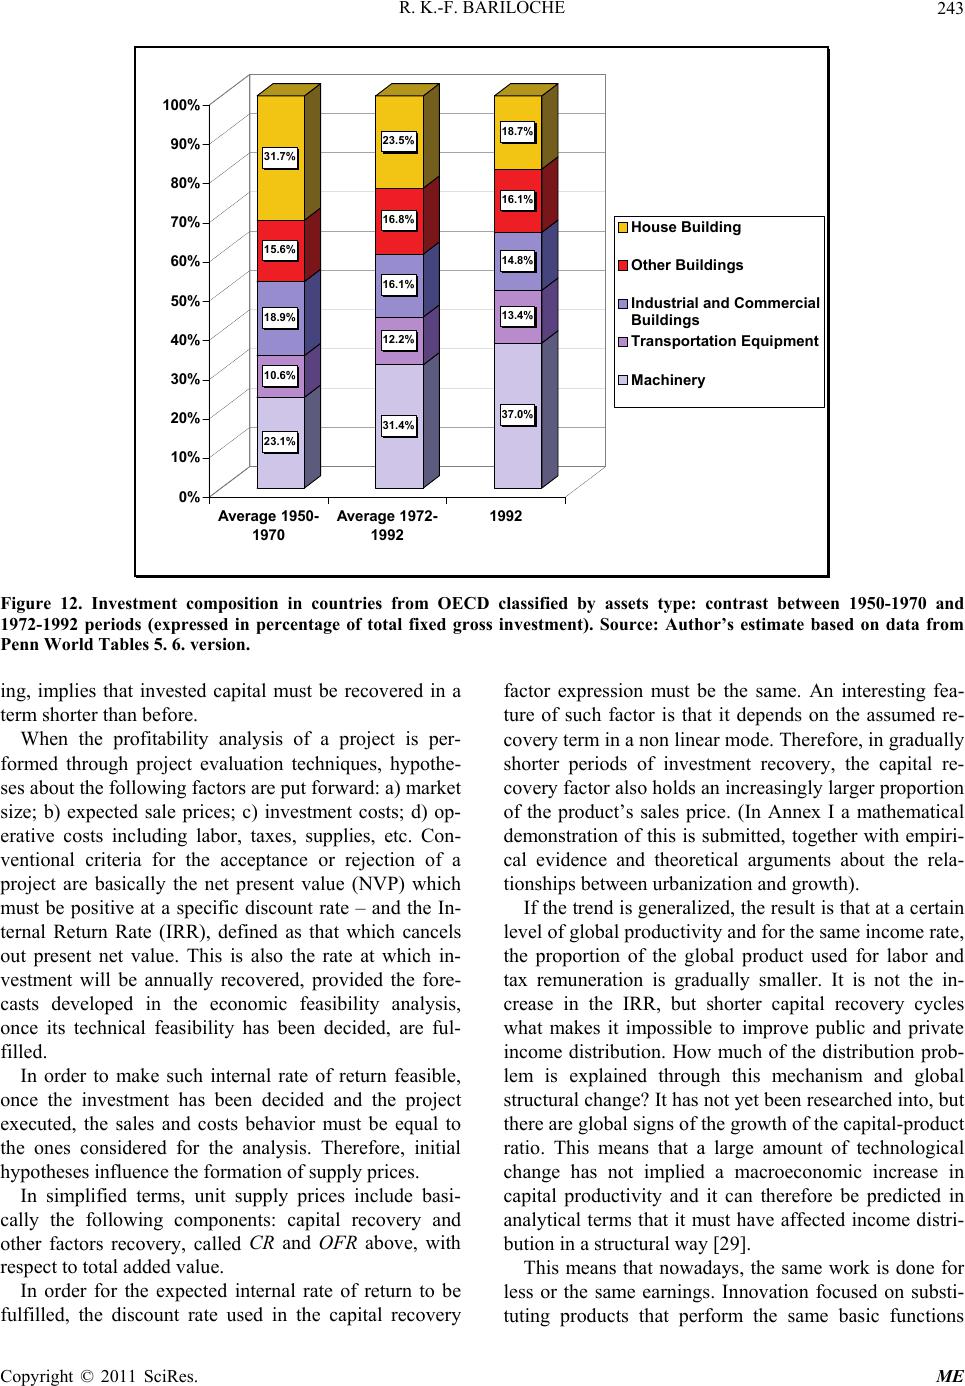 R. K.-F. BARILOCHE243 23.1% 10.6% 18.9% 15.6% 31.7% 31.4% 12.2% 16.1% 16.8% 23.5% 37.0% 13.4% 14.8% 16.1% 18.7% 0% 10% 20% 30% 40% 50% 60% 70% 80% 90% 100% Average 1950- 1970 Average 1972- 1992 1992 House Building Other Buildings Industrial and Commercial Buildi ng s Transportation Equipment Mach in ery Figure 12. Investment composition in countries from OECD classified by assets type: contrast between 1950-1970 and 1972-1992 periods (expressed in percentage of total fixed gross investment). Source: Author’s estimate based on data from Penn World Tables 5. 6. version. ing, implies that invested capital must be recovered in a term shorter than before. When the profitability analysis of a project is per- formed through project evaluation techniques, hypothe- ses about the following factors are put forward: a) market size; b) expected sale prices; c) investment costs; d) op- erative costs including labor, taxes, supplies, etc. Con- ventional criteria for the acceptance or rejection of a project are basically the net present value (NVP) which must be positive at a specific discount rate – and the In- ternal Return Rate (IRR), defined as that which cancels out present net value. This is also the rate at which in- vestment will be annually recovered, provided the fore- casts developed in the economic feasibility analysis, once its technical feasibility has been decided, are ful- filled. In order to make such internal rate of return feasible, once the investment has been decided and the project executed, the sales and costs behavior must be equal to the ones considered for the analysis. Therefore, initial hypotheses influence the formation of supply prices. In simplified terms, unit supply prices include basi- cally the following components: capital recovery and other factors recovery, called CR and OFR above, with respect to total added value. In order for the expected internal rate of return to be fulfilled, the discount rate used in the capital recovery factor expression must be the same. An interesting fea- ture of such factor is that it depends on the assumed re- covery term in a non linear mode. Therefore, in gradually shorter periods of investment recovery, the capital re- covery factor also holds an increasingly larger proportion of the product’s sales price. (In Annex I a mathematical demonstration of this is submitted, together with empiri- cal evidence and theoretical arguments about the rela- tionships between urbanization and growth). If the trend is generalized, the result is that at a certain level of global productivity and for the same income rate, the proportion of the global product used for labor and tax remuneration is gradually smaller. It is not the in- crease in the IRR, but shorter capital recovery cycles what makes it impossible to improve public and private income distribution. How much of the distribution prob- lem is explained through this mechanism and global structural change? It has not yet been researched into, but there are global signs of the growth of the capital-product ratio. This means that a large amount of technological change has not implied a macroeconomic increase in capital productivity and it can therefore be predicted in analytical terms that it must have affected income distri- bution in a structural way [29]. This means that nowadays, the same work is done for less or the same earnings. Innovation focused on substi- tuting products that perform the same basic functions Copyright © 2011 SciRes. ME  R. K.-F. BARILOCHE 244 even with quality and yield improvements―does not mean an improvement in productivity or necessarily contribute to a large extent to the global welfare when its effect is the creation of a more conflictive, dual and de- manding society. The automobile, electronics, computing and medicine industries are clear instances, but not the only ones, of the systematic use of innovations which are not com- pletely disruptive, and have as their basic purpose the maintenance or the increase of activities at the micro level to a certain level. In fact, a great deal of the “evolu- tionary flow” in economy is bound to show the processes of the firms’ technological learning and the dependence of their success on their innovative capacities. Companies specializing in advising about optimization of product lifecycles management have surprisingly in- creased their activities during the last decade. This has happened as a result of the pressure for costs reduction and for the design of new and attractive products which are indispensable for micro -and also macroeconomic - survival in present economic conditions. The cycles of electronic, computing and communica- tions products, as well as of products from the medicine, light chemicals and automobile industries have been re- duced from years to months, in some cases, since the beginnings of the 90’s. This situation causes losses in the value of assets and entails the threats of new risks. These have led to the appearance of government programmes such as ATP (Advanced Technology Program) in the USA and their world-wide expansion in order to foster research for the creation of high technology products. Their aim is to reduce the typical risks of markets which are gradually more competitive, with shorter lifecycles for most products emerging from research and develop- ment activities and from those in the Computing Tech- nology area. The situation has likewise caused the de- velopment of “protected niches” as in the case of some energy technologies, whose support is also related to the foreseeable exhaustion of non-renewable fuels and the will to reduce global CO2 emissions. It is in a way obvious that, without innovation, many factories and production plants would have disappeared because shorter lifecycles of products would have meant the decreasing use of existing capacities at the same time that markets for different goods and services became saturated. That is inevitable, since sales progression for each product also shows a logistic behavior. That is to say, it is distinguished by a rapid ascending exponential phase for a period, and a phase of decreasing dynamics as of a certain inflection point. In this way, the possibilities to use a larger proportion of product to expand the purchasing power to sectors which cannot afford certain goods and services are gradually fewer. This is one of the reasons and features of the consumer society from the viewpoint of produc- tive supply. There is a segment of population, either linked to property or to high salaries deriving from the key positions they hold in the growing process of pro- ductive specialization, who have the possibility to con- stantly renew their goods. On the contrary, another sector lives on second-hand goods or cannot afford goods at all. This is part of the above mentioned matrix of creation of the dual society, but also of growing insecurity, uncer- tainty and exposure: the “Unsicherheit” described by Bauman [30], and explained here from the point of view of the material basis of society. There is another factor that has not been deeply ana- lysed yet. It is another natural limit and the consequences of innovative trends. On one hand, permanent addition of new goods and services―and the replacement of goods already possessed in basic functional terms with new models - by the population belonging to the sector that can afford it, has a problem: time use and availability. The natural twenty-four hour limit would be impossi- ble to overcome except because the intense use of time is a psychic and physiological phenomenon, if such a dis- tinction can be made. The tendency to suffer from stress among people with purchasing power is an undeniable phenomenon. Such stress may be the result of a great diversity of causes. Nevertheless, and without being ex- tremely simplistic, it is clear that time distribution among the working requirements derived from the need to ac- celerate the processes of innovation and supplying that “quantum” of product in a hyper-competitive society, together with personal needs of time to take care of ma- terial possessions, lead to a deep “compression of the psychic space” which also functions in an environment of exposure, uncertainty and insecurity. Through this mechanism, the twenty-four hour barrier can be over- come and a vast bulk of requirements can be taken care of simultaneously. But this occurs only through extra work and the intensive use of psychic energy. Therefore, the following question arises: How many more products and innovation processes will fit in the time-space of a human mind before it collapses? Even when there is no answer to that question, the growing phenomenon of stress among “winners” in the production system renders the issue licit and not trivial. The second problem involved in this kind of produc- tion and consumption is related to motivation, informa- tion and formation of human resources required by the knowledge society. Jeremy Rifkin [32] (2003) has re- cently passed serious judgement - in his own words - on the type of personal commitment of the new genera- tions with respect to the values required by a technologi- cal society that can make the American dream come true. Copyright © 2011 SciRes. ME 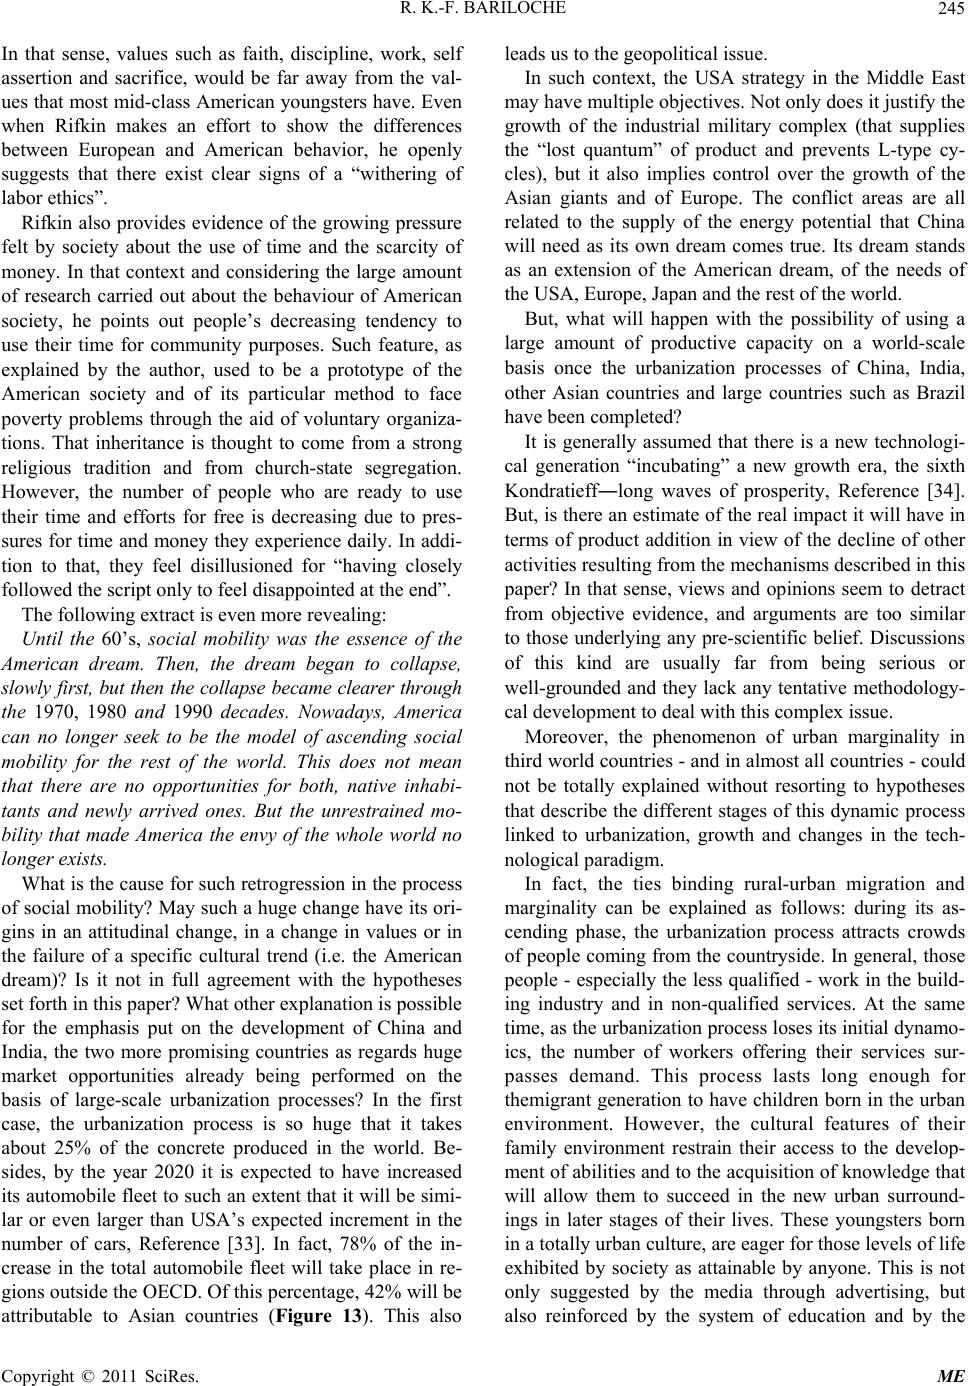 R. K.-F. BARILOCHE245 In that sense, values such as faith, discipline, work, self assertion and sacrifice, would be far away from the val- ues that most mid-class American youngsters have. Even when Rifkin makes an effort to show the differences between European and American behavior, he openly suggests that there exist clear signs of a “withering of labor ethics”. Rifkin also provides evidence of the growing pressure felt by society about the use of time and the scarcity of money. In that context and considering the large amount of research carried out about the behaviour of American society, he points out people’s decreasing tendency to use their time for community purposes. Such feature, as explained by the author, used to be a prototype of the American society and of its particular method to face poverty problems through the aid of voluntary organiza- tions. That inheritance is thought to come from a strong religious tradition and from church-state segregation. However, the number of people who are ready to use their time and efforts for free is decreasing due to pres- sures for time and money they experience daily. In addi- tion to that, they feel disillusioned for “having closely followed the script only to feel disappointed at the end”. The following extract is even more revealing: Until the 60’s, social mobility was the essence of the American dream. Then, the dream began to collapse, slowly first, but then the collapse became clearer through the 1970, 1980 and 1 990 decades. Nowadays, America can no longer seek to be the model of ascending social mobility for the rest of the world. This does not mean that there are no opportunities for both, native inhabi- tants and newly arrived ones. But the unrestrained mo- bility that made America the envy of the whole world no longer exists. What is the cause for such retrogression in the process of social mobility? May such a huge change have its ori- gins in an attitudinal change, in a change in values or in the failure of a specific cultural trend (i.e. the American dream)? Is it not in full agreement with the hypotheses set forth in this paper? What other explanation is possible for the emphasis put on the development of China and India, the two more promising countries as regards huge market opportunities already being performed on the basis of large-scale urbanization processes? In the first case, the urbanization process is so huge that it takes about 25% of the concrete produced in the world. Be- sides, by the year 2020 it is expected to have increased its automobile fleet to such an extent that it will be simi- lar or even larger than USA’s expected increment in the number of cars, Reference [33]. In fact, 78% of the in- crease in the total automobile fleet will take place in re- gions outside the OECD. Of this percentage, 42% will be attributable to Asian countries (Figure 13). This also leads us to the geopolitical issue. In such context, the USA strategy in the Middle East may have multiple objectives. Not only does it justify the growth of the industrial military complex (that supplies the “lost quantum” of product and prevents L-type cy- cles), but it also implies control over the growth of the Asian giants and of Europe. The conflict areas are all related to the supply of the energy potential that China will need as its own dream comes true. Its dream stands as an extension of the American dream, of the needs of the USA, Europe, Japan and the rest of the world. But, what will happen with the possibility of using a large amount of productive capacity on a world-scale basis once the urbanization processes of China, India, other Asian countries and large countries such as Brazil have been completed? It is generally assumed that there is a new technologi- cal generation “incubating” a new growth era, the sixth Kondratieff―long waves of prosperity, Reference [34]. But, is there an estimate of the real impact it will have in terms of product addition in view of the decline of other activities resulting from the mechanisms described in this paper? In that sense, views and opinions seem to detract from objective evidence, and arguments are too similar to those underlying any pre-scientific belief. Discussions of this kind are usually far from being serious or well-grounded and they lack any tentative methodology- cal development to deal with this complex issue. Moreover, the phenomenon of urban marginality in third world countries - and in almost all countries - could not be totally explained without resorting to hypotheses that describe the different stages of this dynamic process linked to urbanization, growth and changes in the tech- nological paradigm. In fact, the ties binding rural-urban migration and marginality can be explained as follows: during its as- cending phase, the urbanization process attracts crowds of people coming from the countryside. In general, those people - especially the less qualified - work in the build- ing industry and in non-qualified services. At the same time, as the urbanization process loses its initial dynamo- ics, the number of workers offering their services sur- passes demand. This process lasts long enough for themigrant generation to have children born in the urban environment. However, the cultural features of their family environment restrain their access to the develop- ment of abilities and to the acquisition of knowledge that will allow them to succeed in the new urban surround- ings in later stages of their lives. These youngsters born in a totally urban culture, are eager for those levels of life exhibited by society as attainable by anyone. This is not only suggested by the media through advertising, but also reinforced by the system of education and by the Copyright © 2011 SciRes. ME 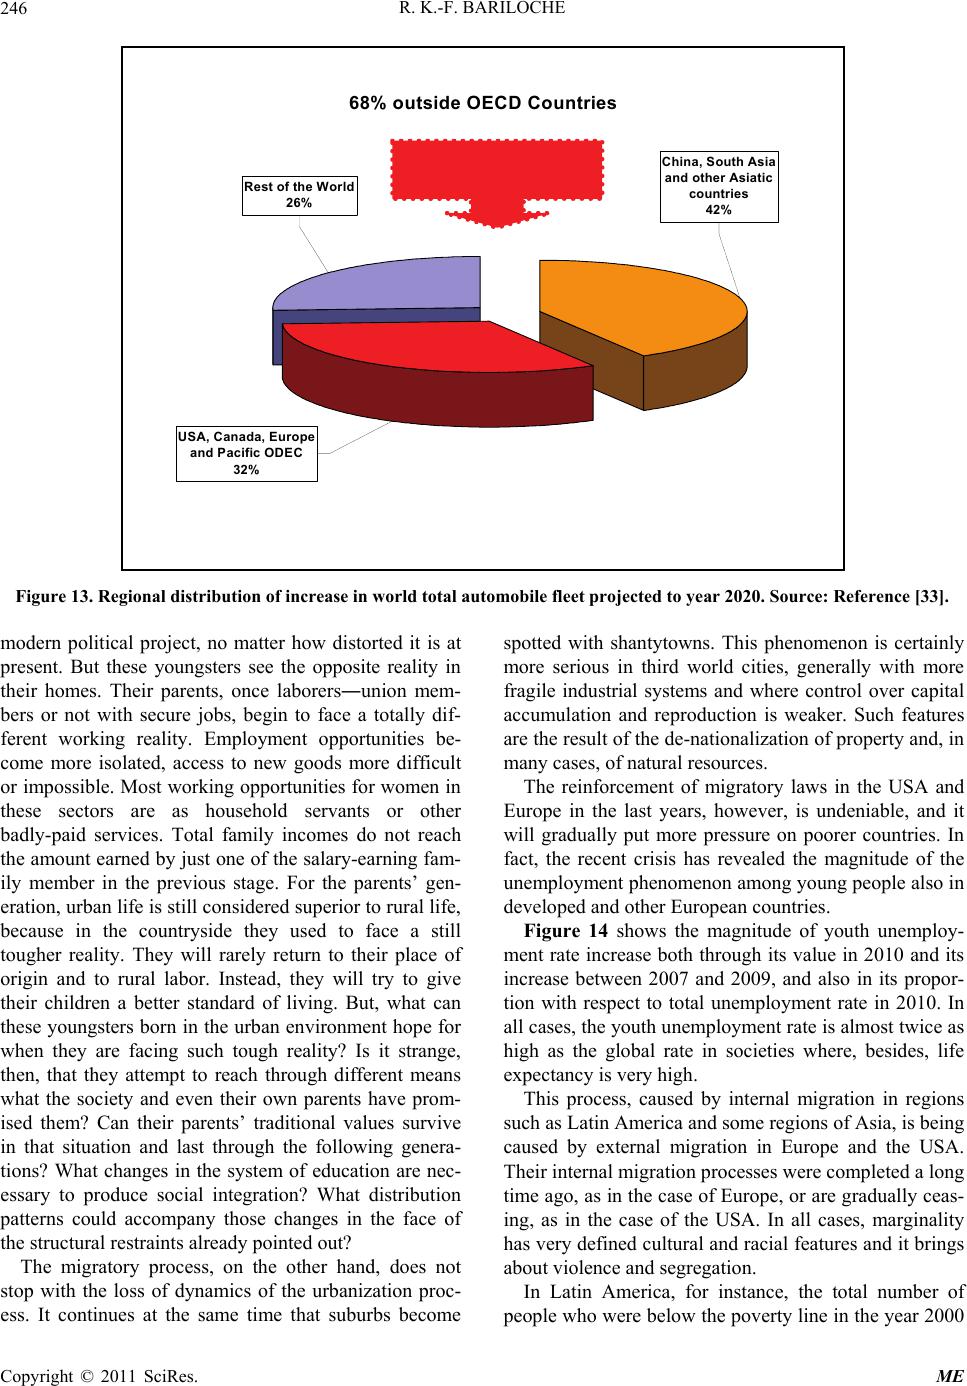 R. K.-F. BARILOCHE Copyright © 2011 SciRes. ME 246 China, South Asia and other Asiatic countries 42% USA, Canada, Europe and Pacific ODEC 32% Rest of the World 26% 68% outside OECD Countries Figure 13. Regional distribution of increase in world total automobile fleet projected to year 2020. Source: Reference [33]. modern political project, no matter how distorted it is at present. But these youngsters see the opposite reality in their homes. Their parents, once laborers―union mem- bers or not with secure jobs, begin to face a totally dif- ferent working reality. Employment opportunities be- come more isolated, access to new goods more difficult or impossible. Most working opportunities for women in these sectors are as household servants or other badly-paid services. Total family incomes do not reach the amount earned by just one of the salary-earning fam- ily member in the previous stage. For the parents’ gen- eration, urban life is still considered superior to rural life, because in the countryside they used to face a still tougher reality. They will rarely return to their place of origin and to rural labor. Instead, they will try to give their children a better standard of living. But, what can these youngsters born in the urban environment hope for when they are facing such tough reality? Is it strange, then, that they attempt to reach through different means what the society and even their own parents have prom- ised them? Can their parents’ traditional values survive in that situation and last through the following genera- tions? What changes in the system of education are nec- essary to produce social integration? What distribution patterns could accompany those changes in the face of the structural restraints already pointed out? The migratory process, on the other hand, does not stop with the loss of dynamics of the urbanization proc- ess. It continues at the same time that suburbs become spotted with shantytowns. This phenomenon is certainly more serious in third world cities, generally with more fragile industrial systems and where control over capital accumulation and reproduction is weaker. Such features are the result of the de-nationalization of property and, in many cases, of natural resources. The reinforcement of migratory laws in the USA and Europe in the last years, however, is undeniable, and it will gradually put more pressure on poorer countries. In fact, the recent crisis has revealed the magnitude of the unemployment phenomenon among young people also in developed and other European countries. Figure 14 shows the magnitude of youth unemploy- ment rate increase both through its value in 2010 and its increase between 2007 and 2009, and also in its propor- tion with respect to total unemployment rate in 2010. In all cases, the youth unemployment rate is almost twice as high as the global rate in societies where, besides, life expectancy is very high. This process, caused by internal migration in regions such as Latin America and some regions of Asia, is being caused by external migration in Europe and the USA. Their internal migration processes were completed a long time ago, as in the case of Europe, or are gradually ceas- ing, as in the case of the USA. In all cases, marginality has very defined cultural and racial features and it brings about violence and segregation. In Latin America, for instance, the total number of peple who were below the poverty line in the year 2000 o 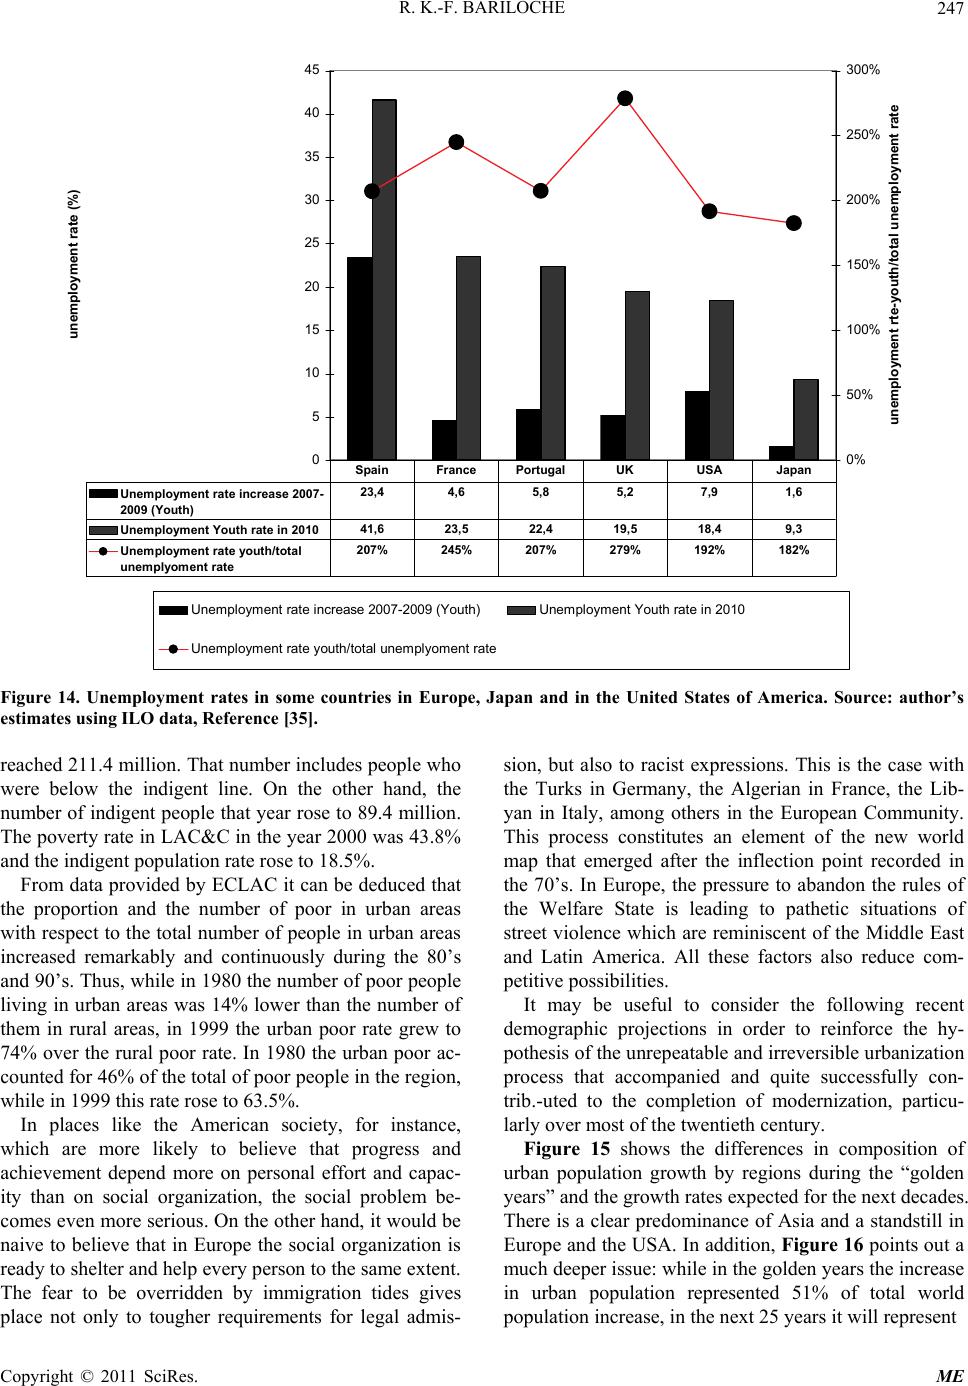 R. K.-F. BARILOCHE247 0 5 10 15 20 25 30 35 40 45 unemployment rate (%) 0% 50% 100% 150% 200% 250% 300% unemployment rte-youth/total unemployment rate Unemployment rate increase 2007-2009 (Youth)Unemployment Youth rate in 2010 Unemployment rate youth/total unemplyoment rate Unemployment rate increase 2007- 2009 (Youth) 23,44,6 5,8 5,2 7,9 1,6 Unemployment Youth rate in 201041,6 23,5 22,4 19,5 18,49,3 Unemployment rate youth/total unemplyoment rate 207% 245% 207% 279% 192% 182% SpainFrance PortugalUKUSAJapan Figure 14. Unemployment rates in some countries in Europe, Japan and in the United States of America. Source: author’s estimates using ILO data, Reference [35]. reached 211.4 million. That number includes people who were below the indigent line. On the other hand, the number of indigent people that year rose to 89.4 million. The poverty rate in LAC&C in the year 2000 was 43.8% and the indigent population rate rose to 18.5%. From data provided by ECLAC it can be deduced that the proportion and the number of poor in urban areas with respect to the total number of people in urban areas increased remarkably and continuously during the 80’s and 90’s. Thus, while in 1980 the number of poor people living in urban areas was 14% lower than the number of them in rural areas, in 1999 the urban poor rate grew to 74% over the rural poor rate. In 1980 the urban poor ac- counted for 46% of the total of poor people in the region, while in 1999 this rate rose to 63.5%. In places like the American society, for instance, which are more likely to believe that progress and achievement depend more on personal effort and capac- ity than on social organization, the social problem be- comes even more serious. On the other hand, it would be naive to believe that in Europe the social organization is ready to shelter and help every person to the same extent. The fear to be overridden by immigration tides gives place not only to tougher requirements for legal admis- sion, but also to racist expressions. This is the case with the Turks in Germany, the Algerian in France, the Lib- yan in Italy, among others in the European Community. This process constitutes an element of the new world map that emerged after the inflection point recorded in the 70’s. In Europe, the pressure to abandon the rules of the Welfare State is leading to pathetic situations of street violence which are reminiscent of the Middle East and Latin America. All these factors also reduce com- petitive possibilities. It may be useful to consider the following recent demographic projections in order to reinforce the hy- pothesis of the unrepeatable and irreversible urbanization process that accompanied and quite successfully con- trib.-uted to the completion of modernization, particu- larly over most of the twentieth century. Figure 15 shows the differences in composition of urban population growth by regions during the “golden years” and the growth rates expected for the next decades. There is a clear predominance of Asia and a standstill in Europe and the USA. In addition, Figure 16 points out a much deeper issue: while in the golden years the increase in urban population represented 51% of total world population increase, in the next 25 years it will represent Copyright © 2011 SciRes. ME 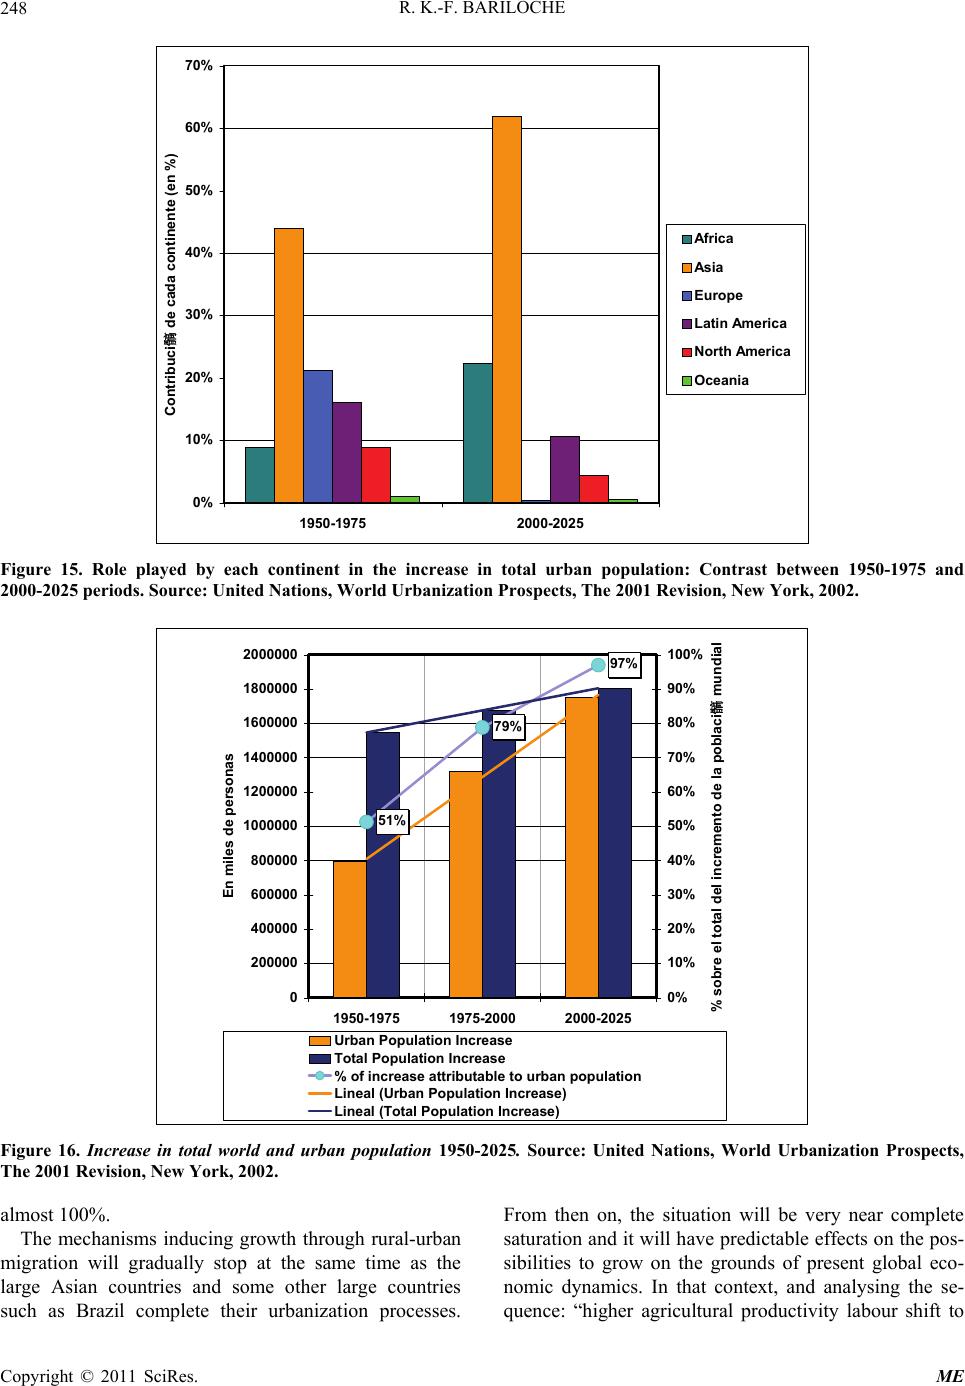 R. K.-F. BARILOCHE 248 0% 10% 20% 30% 40% 50% 60% 70% 1950-1975 2000-2025 Contribuci髇 de cada continente (en %) Africa Asia Europe Latin America North America Oceania Figure 15. Role played by each continent in the increase in total urban population: Contrast between 1950-1975 and 2000-2025 periods. Source: United Nations, World Urbanization Prospects, The 2001 Revision, New York, 2002. 51% 79% 97% 0 200000 400000 600000 800000 1000000 1200000 1400000 1600000 1800000 2000000 1950-1975 1975-2000 2000-2025 En miles de personas 0% 10% 20% 30% 40% 50% 60% 70% 80% 90% 100% % sobre el total del incremento de la poblaci髇 mundial Urban Population Increase Total Population Increase % of increase attributable to urban population Lineal (Urban Population Increase) Lineal (Total Population Increase) Figure 16. Increase in total world and urban population 1950-2025. Source: United Nations, World Urbanization Prospects, The 2001 Revision, New York, 2002. almost 100%. The mechanisms inducing growth through rural-urban migration will gradually stop at the same time as the large Asian countries and some other large countries such as Brazil complete their urbanization processes. From then on, the situation will be very near complete saturation and it will have predictable effects on the pos- sibilities to grow on the grounds of present global eco- nomic dynamics. In that context, and analysing the se- quence: “higher agricultural productivity labour shift to Copyright © 2011 SciRes. ME  R. K.-F. BARILOCHE249 industries.” The following question arises: when it reaches that point, what sector could labour possibly shift to? At least it is predictable that the global system will gradually face a severe transformation. The following section comprises a brief analysis of some consequences of the context described in the analysis of socio-technical systems of innovation. 6. Views about the Socio-Technical System of Innovation in a Context of Structural Crisis: The Need for New Rules from an Evolutionary Perspective. The study of evolution systems, especially during the last two decades of the last century, has focused basically on biology and on computing and computer engineering systems. Both disciplines have mutually benefited from their advances. Does the same happen with economic evolution approaches? The answer is yes, it does, and no, it does not. On one hand, the analysis of incremental and disruptive innovations has interesting parallelisms with some versions which attempt to explain genetic proc- esses through the theory of evolution; on the other, the analysis seems to have overlooked the fact that genetics has become gradually less suitable to explain evolution- ary processes. As Evelyn Fox Keller (2000) [36] has pointed out by quoting Hartwell and his colleagues, “particular solu- tions obtained by means of a computer or by any other manufactured device, are the result of an elaborate his- torical process of selection through ec0nomic, techno- logical and sociological restraints”. The same fact is observed in biological processes: in fact, it could be as- serted that computers, like living organisms, are selected by their survival and (in a way) reproductive capacity. Nevertheless, while economic, technological and socio- logical restraints participate in the selection process in the area of engineering, engineers are the ones who cre- ate these systems with their intelligence and are therefore external to the system. In biology, on the con- trary, it is usually accepted that intervention of external agents is unnecessary. In that context, Fox Keller analy- ses: What type of evolutionary processes involved in such mechanisms can function by themselves, without the assistance of human intelligence? Next, she pays homage to “the million years of experimentation and the constructive creativity of an eternity of bricolage, of aleatory combinations of existing parts which, thanks to recombination and continuous interaction and feed- back with the environment, acquire new functions”. In such context she also asserts that Darwin himself warned us not to miss “the fundamentally historical nature of the biological function or the creative potential of historical accumulation”. This author obviously suggests the exis- tence of an external intelligence necessary for the evolu- tionary process, after examining the failure of genetics to reduce the complexity of evolution to its basic elements and proving through careful analysis of the evolution of the biological sciences that evolutionary processes in- volve the survival of the organism as a whole. When analysing the question of “What organic human intelligence is involved in the evolution of civilization or, rather, in the socio-technical and economic system?” answers given from the viewpoint of the economic evo- lutionary theory are too similar to the ones that biologists tried to provide by focusing on the gene as the center of evolution. Those answers failed in both fields: biology and economy. Even if it is assumed that there may be self-organising phenomena, it is clear that such self or- ganization implies the organism and its functions. In Economics, will such organism be simply the market and its regulation? In fact, the strong claim for regulation of imperfect markets, the financial system, etc. are real dis- tress calls for some “external body” to “correct” market imperfections. But a different type of problem has pre- sented here, one that has to do with the way in which the socio-economic system has evolved under a paradigm (whether a market-paradigm or not) and that has to do with the technological side of the question, not only the economic one. This is a little bit reminiscent of Geor- gescu-Roegen’s arguments [37], when he complained that economics should have taken physics and not chem- istry as a reference paradigm. Because, precisely, the explanatory dynamics underlying the declining trend of global economy, its structural changes and their future trend that will predictably develop the dual society even deeper, the growing exclusion of people from the em- ployment and income systems, must be accounted for with better arguments. They require “the restructuring of lines of thinking regarding technological innovation sys- tems”, a sustainable development proposal, which does not simply mean that new products should produce low global CO2 emissions, or that innovations should become widely accepted products in the market. In socio-economic systems, the global organization is carried out by a group of institutions that “think up the system” and lead it accordingly. But institutional and human drawbacks are well known phenomena and so are the failures and dangers that integral solutions conceal. Solutions of that kind may lead to totalitarian trends, as was the case with those the XXth century, some of which still exist in XXIst as well. The innovation system and its analysis must therefore be considered in such context. However, the dominant Copyright © 2011 SciRes. ME  R. K.-F. BARILOCHE 250 approaches [38-42] describing the actor-rules system dynamics in an explanatory and descriptive framework analysing everything that is considered exogenous (ma- terial conditions, external agents, large socio-cultural contexts) [38] seem to ignore the kind of issues that global context and its dynamics put forward as a great challenge to overface long term structural crisis as des- cribed above. To what extent is it possible to be sure of the survival (and reproduction) of the system as a whole? How would it be possible, considering the restrictions that will gradually appear (restraints imposed by satura- tion of the urbanization process, macroeconomic impact of innovation leading to shorter product lifecycles)? Are large socio-cultural contexts and material conditions not influenced by the set of actors-rule interactions and modified by it? The answer is clearly affirmative. Therefore, Geels’ framework “as paradigm” applies only in the short term analysis of such interactions. But the challenges to systems of innovation in the long term can be very different and even contradictory if global system engineering begins to be considered in terms of survival and reproduction. Such thought would ethically imply survival and reproduction of the indi- viduals that constitute the global system―unless a Mal- thusian viewpoint of population behavior was shared and, in that context, the progressive extinction of the unfit would be allowed to occur. Therefore, the challenge is to keep the system fulfill- ing a growing degree of material and spiritual needs in the present, and to outline the future. If, at present, innovation heading for shorter product lifecycles is the necessary survival condition for produc- tive units and, if that leads to unsustainable social and material conditions (unnecessary use of non-renewable resources), it is time to think the global system over and to readapt the innovation system in terms of global sus- tainability. Such decision implies thinking of political, cultural, technological and economic transitions that will develop a new set of rules. Among those, the following should be considered: agreements between productive units to coordinate goods replacements and longer life cycles, programmed changes across sectors that will include producers of basic everyday consumption needs within growing fulfillment thresholds, creating pro- ductive capacities in accordance with such fulfillment rules to keep progressive effort-and-reward disruption from affecting availability of goods, or creating stable jobs as a consequence of a wider market and with guaranteed expansion concentration of resource and energy saving through innovation but with longer lifecycles rules related to the introduction of automation in ac- cordance with labor reduction but not with reduction of mechanisms to access basic goods. These key issues call for cooperation rather than com- petition. Both are quite natural, only the ruling paradigm has placed more emphasis on competition than coopera- tion, on strength and power than on wisdom. These rules will all contribute to gradually relieving human effort in pursuit of a better quality of life for most people. In the meantime, in the context of current rules of the game, the preceding analyses may be of help to distin- guish the peculiarities of each trend according to the features of the goods they produce (Figures 7 and Table 1) and to focus the view of market opportunities, in which suitable strategy design can help countries to re- locate properly. In that sense, this global approach should be useful, among other things, to distinguish across the productive patterns under consideration, because it is likely that the indicators as well as the conclusions and analysis con- trasting several patterns will lead to incorrect conclusions and recommendations if the dynamic evolutionary con- text is not taken into account. Nevertheless, that is just a minor aim. It would be de- sirable to obtain long range conclusions, useful in the design of an innovation policy that will consider em- ployment a variable that could be modified through mi- cro-, mid- and macro-system interactions, guided by in- telligence and knowledge exogenous to the system (as long as possible). Such intelligence and knowledge, as in the case of the biological systems, cannot function with- out considering the past; a past rich in diversity and wis- dom both in western countries and in the rest of the world. 7. Conclusions Despite the emphasis on innovation as the universal panacea, the global context in which innovation systems develop involves challenges which are completely dif- ferent from the ones recorded historically. In this work, two of these are pointed out: 1) the urbanization process is reaching, or will soon be reaching, a point of almost absolute saturation, which implies market saturation to a level that has never been recorded before. It is believed that this will have an ef- fect on job creation and on the use of existing global ca- pacity. At the same time, it may also lead to planned de- struction as a pragmatic answer. 2) Related to the above are the problems arising from shorter lifecycles of products. It is asserted that, in the absence of an increase in real productivity, technological Copyright © 2011 SciRes. ME  R. K.-F. BARILOCHE251 changes focusing on new product designs for identical functions contribute to progress, but they prevent mas- sive spread of their products by restraining the possibility of income distribution. This leads to the need of setting up models that can predict impact in terms of global added value of the de- veloping cluster of innovations in view of the declination of the added value produced by sectors which inevitably enter less dynamic phases or, even worse, a phase of productive retrogression. In the same way, it is necessary to analyse the effects of introducing products with great technological intensity and quality, and longer lifecycles. As a consequence of this process, it may be deduced that the socio-economic system will need new approaches about social organiza- tion and the world of labour. The division between work and leisure time, the redefinition of rules for the use of leisure time and for income distribution, the effects of the gradual loss of connection between effort and reward among others, are issues for which there does not seem to be a unified research plan. Today, such plan does not seem to comprise an open field of research. Neither are there any consistent meth- odological approaches to be carried out. The creation of world-level product databases, the simulation of product growth in terms of lifecycles overlapping in time, and the proper methods to appraise them, may constitute a first step towards the understanding of the real dynamics of the global system. That would make it possible to assess the expected impact of both, developing and predicted innovations, to design strategies to overcome restraints deriving from the saturation of the urbanization process and from current innovation rules. The relevance of this issue is not be discredited by simplistic arguments asserting that the growing complex- ity of society will always entail new demands for goods and services and that they, in turn, are expected to foster a lever of labour demand that will prevent a global col- lapse. In any case, in order not to be just a dogmatic be- lief, such assertion should undergo severe scientific analysis. 8. Reference [1] H. Torun and C. Çicecki, “Innovation: Is the Engine for the Economic Growth?” The Faculty of Economics and Administrative Sciences, Ego University, Izmir, April, 2007. [2] R. M. Solow, “Technical Change and the Aggregate Production Function,” Review of Economics and Statis- tics, Vol. 39, 1957, pp. 312-20 [3] N. Rosenberg, “Innovation And Economic Growth [4] P. Romer, 1987, “Growth Based on Increasing Returns Due to Specialization.”, Aerican Economic Review 77(2): 56-62 [5] Robert Lucas, (1988), “On the Mechanics of Economic Development”, Journal of Monetary Economics, 22, 3-42. [6] G. Dosi; R. Nelson, An Introduction to EVolutionary Theories in Economics. Economics Journal of EVolu- tionary Economics, Vol. 4, pp. 153-172 .Springer, Berlin, 1994. [7] C. Marchetti, , “Society as a Learning System: Discovery, Invention, and Innovation Cycles Revisited”, Tech. Fore- casting and Social Change, Vol. 18 (1980), pp. 267-282. [8] Ch. Freeman,; C. Pérez, , Structural Crises of Adjustment, Business Cycles and Investment Behavior, Dossi et al. Technical Change and Economic Theory. Pinter, London; 1988. [9] G. Mensch, , “Stalemate in Technology”. Ballinger Pub. Co., Cambridge, Mass., 1978. [10] C. Freeman, , L. Soete, (1997), The Economics of Indus- trial Innovation, 3. Edition, London. [11] Ibn Khaldun, Muqaddimah, 2:272-73, quoted in Dieter Weiss (1995), “Ibn Khaldun on Economic Transforma- tion”, International Journal of Middle East Studies 27 (1), p. 29-37 [30]. [12] , P. Davidson, John Maynard Keynes, in Great Thinkers in Economics, Palgrave, Macmillan, 2007-2009. [13] J. Barro, y X. Sala-i-Martín (1992), “Convergence”, Journal of Political Economy, Vol 100, nº 2 [14] W. J Baumol, (1986): Productivity, Growth, Convergence and Welfare: What the Long-Run Data Show, American Economic Review, 78, 5, December. [15] E. Moncayo, (2004), El debate sobre la convergencia económica internacional e interregional: enfoques teóri- cos y evidencia empírica, Revista eure (Vol. XXX, No. 90), pp. 7-26, Santiago de Chile, septiembre 2004 [16] S. Kuznets, (1955), Economic Growth and Income Ine- quality, The American Economic Rewiew, Volume XLV, March 1955, number one. [17] A. Gurría, (2007), Lecture, OECD Secretary-General at the Copenhagen Business School, Copenhagen, Denmark [18] Harvey, 1990, D. Harvey, , The Condition of Posmoder- nity. An Enquiry into the Origins of Cultural Change. Oxford: Basil Blackwell Ltd.; 1990. (Spanish Translation, Buenos Aires: Amorrortu; 1998.) [19] Schor and Il-You,1995; J. Schor,; J., Il-You, Capital, The State and Labour. WIDER, UNU Press. GB: E.Elgar; 1995. [20] Glyn et. al, 1988; A. Glyn,; A. Hughes,; A. Liepitz,; A. Singh, , The Rise and Fall of the Golden Age. Helsinki: WIDER, UNU; 1988. [21] Liepitz, 1986) A. Liepitz, , New Tendencies in the Inter- national Division of Labour: Regimes of Accumulation and Modes of Regulation. Scott, A.; Storper, M. Production, Work, and Territory: the Geographical Anatomy of In- dustrial Capitalism. Allen and Unwin, Boston. 1986. [22] I. Wallerstein,, World – System Analysis, Theory and Methodology. Sage Publications; London,1982. Copyright © 2011 SciRes. ME  R. K.-F. BARILOCHE 252 [23] 1982; Okita et al., 1979; Okita et al., 1979 S. Okita, , T. Kuroda, M. Yasukawa, Y. Okazaki and K. Iio. Popula- tion and Development: The Japanese Experience. Hauser, P., pp. 327-338. Syracuse University Press; New York 1979. [24] Gilbert. & Gugler, 1992; J. Gugler, The Urban-Rural Interface and Migration. Gilbert, A. & Gugler, J. Cities, Poverty and Development, Urbanization in the Third World. Oxford University Press; London,1993. [25] Masini, 1994; E.B. Masini, Impacts of mega-city growth on families and households, Mega-City Growth and the Future, pp 215-230, Tokyo: United Nations University Press; 1994. [26] Hobsbawm, 1994). E.J., Hobsbawm, Historia del Siglo XX, (History of the XXth Century) Ed. Crítica, Buenos Aires, 2003, p. 566. [27] A. Van der Woude,; A.; Hayami, J. de Vries, Urbaniza- tion in History: A Process of Dynamic Interactions. Ox- ford: Clarendon Press; 1990. [28] Kozulj 2001, Urbanización y Crecimiento: Resultados de las Correlaciones entre Población Total, Población Ur- bana y en Grandes Ciudades con el Nivel del PBI para Series de Corte Transversal a Nivel Mundial en el Período 1950-1990, (Urbanization and Growth: Results of the Correlations between Total Population, Urban Population and Population in Large Cities with GNP Level for Cross-sectional Series on a World Scale in the 1950-1990 Period) FB/ Working Papers 03/01, Bariloche, Argentina, August 2000. [29] Kozulj, 2003, People, Cities, Growth and Technological Change: from the golden age to globalization, en Tech- nological Forecasting and Social Change, 70 (2003) 199-230, Elsevier Science, NL. [30] Bauman, 2001, En busca de la política, (In search for Politics) FCE, Buenos Aires, 2001. [31] Shenhar et al. (1998), A.J. Shenhar , Z. Hougui, , D. Dvir, , A. Tischler Y. y Sharan, , Understanding the de- fense conversion dilemma, in Technological Forecasting and Social Change Vol. 59 (3), 1998 (November), North - Holland., Elsevier. [32] Jeremy Rifkin, (2003) J. Rifkin, , El sueño europeo: cómo la visión europea del futuro está eclipsando el sueño americano, (The European Dream: How the European view of the future is outshining the American Dream) Buenos Aires, Paidós Estado y Sociedad 123. [33] R. Kozulj, (2005),. ¿Choque de Civilizaciones o Crisis de la Sociedad Global? Problemática, Desafíos y Escenarios Futuros, Ed. Miño y Dávila, Madrid, 2005. [34] Allianz Global Investors, Analysis & Trends, The sixth Kondratieff –long waves of prosperity, January 2010. [35] ILO, Global Statistics on the Labour Market page, By_Country_FULL_EN.xls. [36] Evelyn Fox Keller 2000, Le siecle du gen, Gallimard, Paris, 2003. [37] N., Georgescou Roegen, (1971), The Entropy Law and the Economic Process, Harvard University Press: Cam- bridge, Massachusetts. [38] F. Geels, , From sectoral systems of innovation to socio- technical systems:Insights about dynamics and change from sociology, and institutional theory. Department of Technology Management, Eindhoven University, IPO 2.10, P.O. Box 513, 5600 MB Eindhoven, The Nether- lands, Research Policy 33 (2004) 897–920 [39] T. R. La Porte,, Social Responses to Large Technical Systems: Control or Anticipation. Kluwer Academic Pub- lishers, Dordrecht, NL.1991 Malerba, F., 2002. Sectoral systems of innovation. Research Policy 31 (2), 247-264. [40] T. P. Hughes,, Networks of Power, Electrification in Western Society, 1880-1930. Johns Hopkins University Press, Baltimore. [41] T. P. Hughes,, 1987. The eVolution of large technological systems. In: Bijker, W.E., Hughes, T.P., Pinch, T. (Eds.), The Social Construction of Technological Systems: New Directions in the Sociology and History of Technology. The MIT Press, Cambridge, Massachusetts, 51-82. [42] R. Mayntz and T. P. Hughes, The Development of Large Technical Systems. Campus Verlag, Frankfurt, 1988. [43] C. M. Wesley,, Businnes Cycles: 10-17, Burt Franklyn, New York, 1970. [44] Perrin S. Meyer, W. Jasón Yung and Jesse H. Ausubel, in A Primer on Logistic Growth and Substitution: The Mathematics of the Loglet Lab Software, published in Technological Forecasting and Social Change an Inter- national Journal, North Holland Vol. 61, No. 3, July 1999. [45] Fu chen Lo. The Impacts of Current Global Adjustment and Shifting Techno-Economic Paradigm on the World City System. Fuchs, R., E. Brennan, J. Chamie; F. Ch. Lo and J. I. Uitto . Mega-City Growth and the Future. Tokyo: United Nations University Press; 1994. [46] Penn World Table (Mark 5.6 a) The Center for Interna- tional Comparisons at the University of Pennsylvania [47] United Nations, World Urbanization Prospects, United Nations, 2001. [48] R. Kozulj, , Megalópolis, Cambio Tecnlógico y Crecimiento Económico: Desde los Años Dorados a la Crisis Actual. (Megalopolises, Technological Change and Economic Growth: From the Golden Years to the Present Crisis), Di Marco, L. E., Humanismo Económico y Tecnología Científica: Bases para la Reformulación del Análisis Económico, (Economic Humanism and Scientific Tech- nology: Bases for the Reformulation of Economic Analy- sis) Volume I, CIEC, Córdoba National University, Au- gust 1999. [49] W. J Baumol, (1967), Macroeconomics of Unbalanced Growth: The Anatomy of Urban Crisis. William J. Bau- mol. The American Economic Review, Volume 57, Issue 3 (Jun., 1967), 415-426. Copyright © 2011 SciRes. ME  R. K.-F. BARILOCHE Copyright © 2011 SciRes. ME 253 Annex 1 Empirical and Methodological Features of the Links between Urbanization, Economic Growth and TechnoLogical Change. AI-1- The problem of structural overcapacity due to market saturation. Its relationship with the logistic be- havior of urbanization and market development proc- esses. This idea derives partially from the economic cycle theories based on the unbalances produced in economy between the sectors producing consumer and capital goods, Reference [43] It is obviously compatible with all the cycle theories which consider changes in investment expectations, technological changes and the behavior of durable good markets among others, as causes of such cycles. The hypothesis to be analysed in this case is the fol- lowing: If it is accepted that for each consumer good, market development in the long-term has the form of a logistic function, its first derivative will represent the projected demand in time for the capital goods industry for that good. The second derivative will be the projected demand for the capital goods industry for the production of capital goods for the first good, and so will happen indefinitely. This is so if it is accepted that the capital goods industry is not homogeneous with regard to its products, as some authors generally assume. It is almost evident that the concrete process of eco- nomic growth is, in fact, the overlapping of the “supply = demand in time” function for different goods. Conse- quently, the aggregate demand will decline at the same pace as the decline of the capital goods demand, if there is not a process of continuous technological change . In simplified terms, each product will grow endlessly or in an exponential manner, provided there are no restrict- tions according to a function of the type, Reference [44] t Pt Poe where is growth (generally expressed in %), P(o) is the initial magnitude of the market for a certain product, i.e. the value of P in t = 0. But, actually, each product has an exponential growth phase and it then reaches saturation as a consequence of real demand. This saturation is equivalent to the number of people who can afford such product, which means that they do not have it, and that they have the want and the means to acquire it. Therefore, it has been usual to add corrective factors to equations of that type, i.e .: 1Pt k in a way that the growth of the referred variable (in this case a product) diminishes as the k variable is reached. This variable represents the asymptotic value towards which the function heads (in this case the maximum market size for a certain product iii, and also the maxi- mum size of urban population during a certain period). In this way, the growth equation can be expressed as follows: 1 d Pt Pt Pt tk (2) i.e., as a typical logistic function. The solution to equation (2) is () 1t k Pt e Now, the first derivative of this function (in this case, the projected demand of capital goods for the product in question) will be: 2 1 d PP PP tk P k The main concern here is to find the maximum of this function, because from that point on, the capital goods industry in question will enter a phase of structural overcapacity due to saturation (and so will some other sectors as a result). The maximum and minimum of this derivative func- tion P t are obtained by identification of the t’s that result in 2 20 P t . 2 2 22 1 dP PPPP dt kttk t Two of the points at which this function becomes 0 are clearly trivial: (t = 0 and t = ), then 2 10PPtk k 2 , which is equivalent to (*) (* )12 21 t t kk e e And hence, *1* t et 0 With which * o * 2 k tt It means that, in this case, the t* time searched for, in which the first derivative reaches its maximum (pro- jected maximum capacity in the capital goods industry corresponding to the consumer good in question), will be the time needed for the market to reach half of its maxi-  R. K.-F. BARILOCHE 254 s not altered if, instead of adopting th mum magnitude. This reasoning i is form, the logistic function was slightly different. In that case, P(t*) would not be 2k, but something similar The reasoning underlined here is that as long as the markets for the different goods behave in a way similar to a logistic function, the investments induced by these sectors will decline at a point in which signs of great dynamics in the industry in question can be observed, whether it is of consumer or investment goods. Therefore, industries producing capital goods will in- ev e to this will obviously be technological in considering one product, a group of pr states, therefore, that the lo etween urbanize- tio orrelations between urbanization and gr r to explore the central hypothesis addressed in th ion data, as of this an nchronic models have been tried be e is a e results of correlations with abso- lu hat, in order to establish more precise links be- tw ect, Reference [48] w itably reach a phase of structural overcapacity that will affect the dynamics of economy as a whole through the multiplying effects caused by the reduction in aggre- gate demand. The respons novation, which will allow the industries to remain in the market, creating new sources of supply and demand. But this will not be possible in all sectors to the same extent, due to the heterogeneous and rigid nature of the production system. When, instead of oducts is considered, related to what could be called a paradigm of technological consumption (a cluster of goods which characterise a certain lifestyle, such as the modern urban style, for instance) and these products have developed practically along the same period, the described effect for one product, will affect economy as a whole. This could be virtually represented as the aggre- gation of varied logistics or similar functions, each cor- responding to a good or service. therefore, it is not evi- dent that the process of technological change can per se maintain the dynamics of economy at the same level as during the initial phase of development (for example, the first two decades after the Second World War). This gave a reason for the rupture point associated with the decline in urban population growth. The present hypothesis ng-term cycles described by Kondratieff, and referred to by some authors during the last years, Reference [8,45] actually reflect this type of process. AI-2. Results form the correlations b n and growth. 1) Statistical c owth. In orde is paper and some previous works by the author previ- ously mentioned here, several models of correlation be- tween population and GDP level have been tried. For that purpose, GDP data from the Penn World Table (Mark 5.6 a), Reference [46] and data on total population, urban population and population in cities with over 750,000 inhabitants in 1990 from the United Nations Population Division, Reference [47] have been elaborated. The correlation models are based on cross-sect it would be impossible to deal with time series. It would be tedious to list here all the results alysis. Therefore, the reader is referred to Reference [29] in which the details of such analysis are explained. Anyway, it seems useful and necessary to comment on some of these results: In the first place, sy tween: 1- total population and GDP level; 2- total ur- ban population and GDP level; 3- population in large cities and GDP level, with data from numerous countries from all over the world for the years 1960 and 1990. As a result of this analysis it can be stated that ther significant correlation between total urban population and GDP, and between population in large cities and GDP on the basis of both, absolute value data and their logarithms. The adjustment on the basis of absolute value data in the case of population in large cities was slightly better than the one produced by total urban population data (R^2 = 0.89 against 0.82 for the 1960 data; 0.74 against 0.63 for 1990). The explanatory variable was highly significant and the other parameters for interpret- ing statistical results were more than satisfactory, con- sidering that they are models with only one explanatory variable. Also, other analyses were carried out applying the White test to determine whether there was het- eroskedasticity, which is frequent when working with cross-section series and variables of this size. Its exis- tence was indeed proved, but correction through balance of the explanatory variable still produced reliable t val- ues at 0% and it even improved the value of R^2 in the corrected equations. On the contrary, th te value data of total population and GDP produced a low correlation (R^2= 0.27 for 1960 and 0.21 for 1990), even when the variable was significant and models on logarithms produced better results. Results of the last type appear to be the ones that, in a way, supported the idea of a lack of causality between population growth and economic growth in analyses such as those carried out by Blanchet (1985-1991); Chesnasis (1985); Bairoch (1981) and others, Rference [29]. All these are mainly focused on the classical debate on whether population growth has a positive or negative effect on economic growth. After t een urbanization and economic growth, other models were used which consider the increase in the value of both variables over a certain period. In previous studies on this subj ere used data about GDP growth as annual growth per- centage accounted for by: a) the mean annual increase in Copyright © 2011 SciRes. ME  R. K.-F. BARILOCHE255 r- de order to avoid multiple co-linearity and m 60-1975 and 1975-1990 periods. , w AI-1. It sh - ta rrelation matrix between total urban po een analysed in order to be and results by fiv n GDP growth (response va details about the statistical re neral, the R^ the number of people living in mega-cities, with data for twenty three of them shifted one decade with respect to economic growth data, and: b) the initial GDP of the countries where the largest mega-cities were located. By introducing binary variables to the equation in o r to correct the cases of China and India - which were atypical for valid reasons - a good correlation was ob- tained (R2 = 0.81) with high significance of all the ex- planatory variables and with correct signs for theoretical interpretation. However, in agnitude asymmetry problems in cross-section series, very simple correlations were made on the basis of GDP increase in absolute values by five-year periods (the five-year period averages were chosen for the estima- tions in order to avoid distortions caused by simple criti- cal points in extreme years). Other correlations were made with urban population growth data in cities with over 750,000 inhabitants shifted backwards and forwards by two five-year periods in order to study possible inter- active causalities. The results have been very positive and are set out below. 2) Results for the 19 A very simple model is presented in these cases here the increase in absolute GDP values for these pe- riods is explained by the increase in the number of peo- ple living in large cities which took place a decade be- fore. Also, a binary variable is introduced in order to show whether the nation to which the data belongs is a developed or a developing country (DC), and another variable to deal with the case of India, with its problems of fast city growth - especially after the separation of Muslim Pakistan -, and its simultaneous low economic growth caused by the peculiarities of its culture. The results obtained are summarized in Table ould be noticed that the main explanatory variable for GDP growth expressed in absolute values is the popula- tion growth in large cities occurred earlier on. Thus, for instance, the explanatory variable for the GDP increase that took place between 1960 and 1975, is the population growth in large cities that took place between 1950 and 1960. For the GDP increase between 1975 and 1990, the explanatory variable is defined as the population growth in large cities between 1960 and 1975. According to the correlation matrix, the R value between population growth and GDP is 0.76 for GDP data in the 1960-1975 period, and 0.82 for GDP data in the 1975-1990 period. The correlations are very similar when considering to l urban population data, but they are not so similar if total population data is considered. The results obtained from shifts with total urban population data are shown in Table AI-2. The simple co pulation growth and GDP results in a value of 0.85 for GDP data in the 1960-1975 period, and a value of 0.83 for 1975-1990 data, but the values are considerably lower when dealing with data for total population growth: 0.45 and 0.55 respectively. It should be taken into ac- count that even this relatively good correlation between total population growth and GDP is explained because in some cases such growth values correspond mainly to urban population. On the other hand, the results of the correlations between population in large cities, total ur- ban population and total population, reveal a high degree of existing correlation, with R values between 0.8 and 0.9 in both cross-section series. Several other methods have b tter understand the degree of correlation existing be- tween urban population growth in large cities and GDP, taking into account the fact that, as was explained in i), this is an interactive type of phenomenon. 3) The problem of interactive causality e-year periods with the explanatory variable shifted “backwards” and “forwards”. Correlation exercises betwee riable) and urban population growth (explanatory variable) have been applied with data by five-year peri- ods between 1950 and 1990, with several degrees of dis- placement between both variables. The purpose of such displacements was to analyse more deeply the interactive causalities between both variables, taking into account the fact that, even if GDP growth may be partially attrib- uted to the migratory process, the latter depends, in turn, on job opportunities generated and/or promised by the growth process, for instance. In order to avoid excessive sults of the several displacements, Figure AI-1 shows the R^2 values obtained with data on population growth in large cities referring to: 1- two five-year periods pre- vious to the period to which GDP growth data belongs; 2- one previous five-year period; 3- the same five-year period; and 4- the subsequent five-year period. The results lead to many conclusions: in ge 2 value is higher (and the rest of statistical analysis parameters are better) with the adjustments made on the basis of data shifted “backwards” than with the syn- chronic data - those shifted “forwards”. It should be no- ticed that, in most of the five-year periods analysed, R^2 values obtained were between 0.6 and 0.8 for GDP growth “accounted for” by the population growth that took place in large cities in one or two of the previous five-year periods. In contrast, the correlations with syn- chronic data (third series) or with the explanatory vari- able shifted forwards by one five-year period (fourth series), in general showed lower R^2 values. On the other hand, it is important to remark that the analysis of Copyright © 2011 SciRes. ME 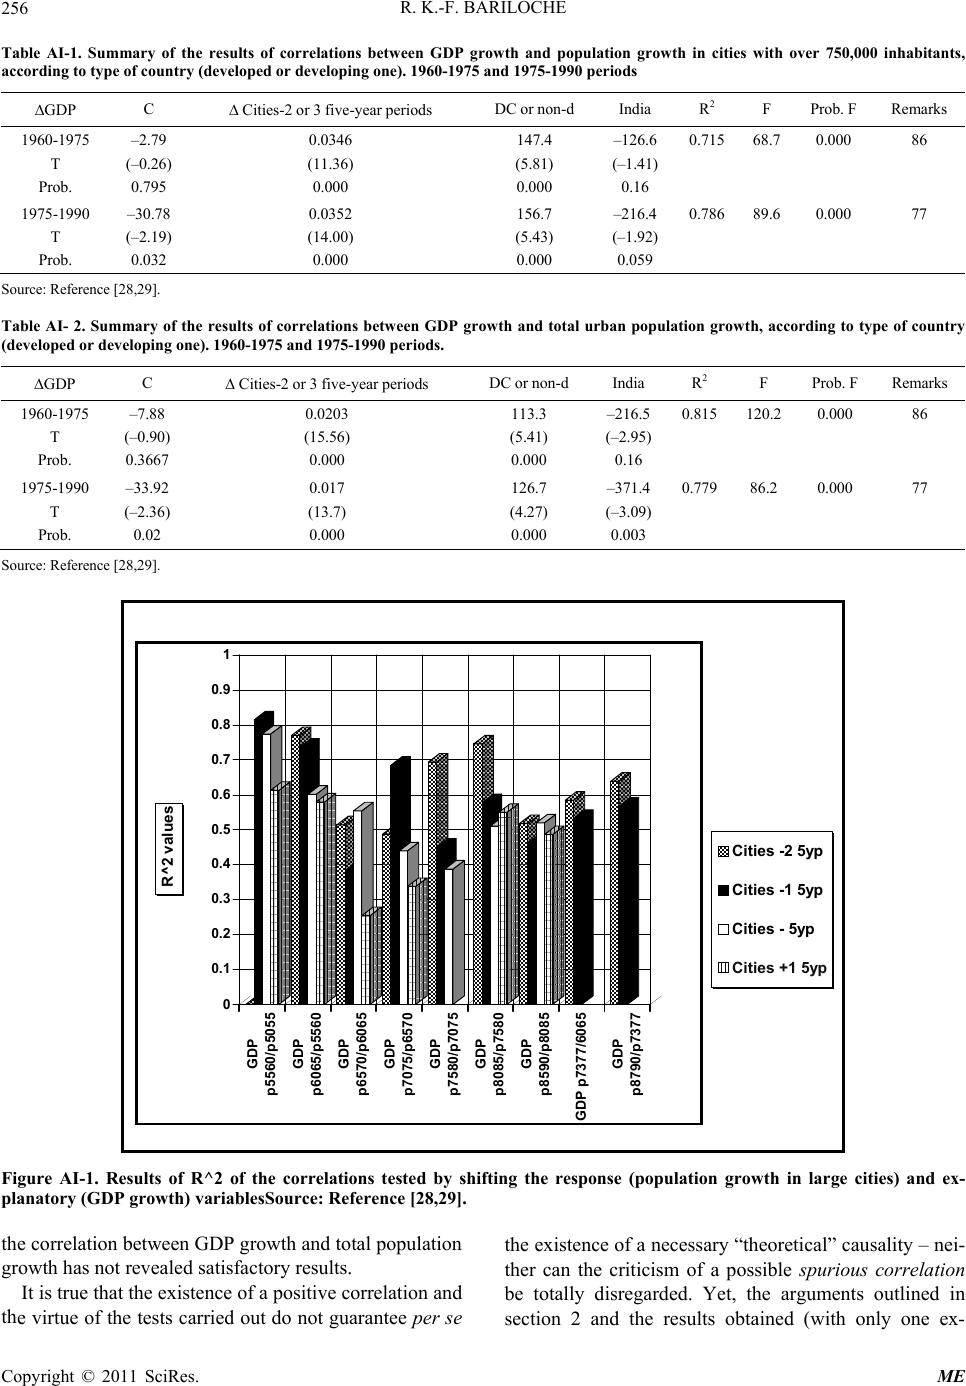 R. K.-F. BARILOCHE Copyright © 2011 SciRes. ME 256 owth and population growth in cities with over 750,000 inhabitants, GDP C Cities-2 or 3 five-year periods DC or non-d India R2 F Prob. F Remarks Table AI-1. Summary of the results of correlations between GDP gr according to type of country (developed or developing one). 1960-1975 and 1975-1990 periods 1 Pr – 0.6 960-1975 T ob. 2.79 (–0.26) 0.795 0.0346 (11.36) 0.000 147.4 (5.81) 0.000 –126.6 (–1.41) 0.16 715 8.7 0.000 86 190 Pr –0.78689.6 0.000 77 75-199 T ob. –30.78 (–2.19) 0.032 0.0352 (14.00) 0.000 156.7 (5.43) 0.000 216.4 (–1.92) 0.059 Sourcnce [2 e results of correlations between GDP growth and total urban population growth, according to type of country GDP C Cities-2 or 3 five-year periods DC or non-d India R2 F Prob. F Remarks e: Refere8,29]. able AI- 2. Summary of thT (developed or developing one). 1960-1975 and 1975-1990 periods. 1 P – 0.1 960-1975 T rob. 7.88 (–0.90) 0.3667 0.0203 (15.56) 0.000 113.3 (5.41) 0.000 –216.5 (–2.95) 0.16 815 20.2 0.000 86 190 P –0.77986.2 0.000 77 75-199 T rob. –33.92 (–2.36) 0.02 0.017 (13.7) 0.000 126.7 (4.27) 0.000 371.4 (–3.09) 0.003 Sourcnce [2 e: Refere8,29]. 0 0.1 0.2 0.3 0.4 0.5 0.6 0.7 0.8 0.9 1 R^2 values GDP p5560/p5055 GDP p6065/p5560 GDP p6570/p6065 GDP p7075/p6570 GDP p7580/p7075 GDP p8085/p7580 GDP p8590/p8085 GDP p7377/6065 GDP p8790/p7377 Cities -2 5yp Cities -1 5yp Cities - 5yp Cities +1 5yp Figure AI-1. Results of R^2 of the correlations tested by shifting the response (population growth in large cities) and ex- e correlation between GDP growth and total population rrelation and th the existence of a necessary “theoretical” causality – nei- planatory (GDP growth) variablesSource: Reference [28,29]. th growth has not revealed satisfactory results. It is true that the existence of a positive co e virtue of the tests carried out do not guarantee per se ther can the criticism of a possible spurious correlation be totally disregarded. Yet, the arguments outlined in section 2 and the results obtained (with only one ex-  R. K.-F. BARILOCHE257 ial structure (both urban and GDP) to account fo uration. c- to ther th planatory variable), are more than satisfactory to point to the need of analysing this issue more deeply in future research. The correlation obtained also shows the great inertia of the init r subsequent growths in both variables, which renders the controversial issue of convergence, References [13-15] between developed and developing countries relative, at least for 40- and 50-year periods. AI-3- Properties of the added value distribution func- tion with relation to product cycles and their d The starting point of this analysis is an aggregate function of supply price formation consisting of two fa rs: capital recovery (CR) and other factors (OFR). A simplified way to represent a distribution function of the part of social product resulting from factors o an capital (basically salaries and taxes) from a formula that considers the product-capital relationship and the capital recovery factor at the same time, is the following equation: 11CCii n or, likewise, 11GDPC iin since C GDP where: s the part f social product that constitutes the of factors other than capital Gto the adession io revenue is the value of the product/capital relationship C is the capital value DP is the gross domestic product, identical ded value and the expr 11iin is the ca grows (capital intensity de pi- tal recovery factor, with i being the discount rate and n the capital recovery term. The result is, therefore, that the value of rises when the product/capital relationship clines), which is trivial; but it falls with decreasing values of n in a non-linear manner. In fact, by deriving with respect to n, the following expression is obtained: **ln11212 2 n Ci iinin This shows the positive sign of the derivative ( rises when n rises, or it falls when n does) according to a qu shorter life-span or capital re- co result of the more basic and aggregate func- tio (o e distribution is totally compatible w h practically determines market pr continuous and rapid tech- no s in the investment and e distribution affects sala- rie 70s when the inflection point in di asi-hyperbolic function, which shows the particular sensitivity of the function with respect to the range of n values, especially when the variations occur with n val- ues lower than 15 years. It should be noticed that, in order to prevent the fall in as a consequence of a very term (in turn the result of continuous and rapid technological change), an important increase in produc- tivity (a drop in the Capital-Product relationship) must take place. As has already been stated, the previous function is actually the n of global supply prices formation. This latter func- tion is composed by the capital recovery factor (CR) and another factor comprising the total cost of the rest of the factors other than capital (basically salaries and taxes). As is known, if the i rate used to calculate the CR is the desired or expected IRR, and n is the project life span, r else the basis on which the IRR is calculated in the a priori project evaluation), then the supply prices formed by that CR guarantee the realization of the theoretical IRR of each project. Therefore, the analysis of the effect of the decrease of the n value on incom ith the theoretical notion that the IRR represents capital revenue. What is to be highlighted here is that in order to obtain an identical IRR because of the existence of dif- ferent capital recovery terms, shortened by forced (or accelerated) technical obsolescence, the distribution of aggregate value is modified in favor of capital and against the rest of the factors. This, however, does not imply greater capital revenue. In practice, this occurs by means of the process of sup- ply price formation, whic ices in a modern economy. Although there is still no empirical basis to analyse this aspect of the problem of logical change more deeply, the theoretical issue in- troduced here is hard to avoid. The capital-product relationship has been growing as can be deduced from the variation product rates, Reference [29]. It is to be noticed that the structural constraint imposed on the improvement of incom s as well as the portion of income devoted to finance public expenditure. At this point, it seems convenient to remember that it was just by the mid ‘ stribution patterns and also the urge to reduce public expenditure and tax pressure - both measures constrain- ing aggregate demand - became more noticeable. On the other hand, this was also the context in which active re-distribution policies led to the phenomenon of stagfla- tion - unknown in the 1950-1970 period. Yet, paradoxi- cally enough, once the urban life style has been adopted by large masses of population, public expenditure and income redistribution are most needed, for the reasons explained by Baumol (1967), Reference [49] in his pio- Copyright © 2011 SciRes. ME  R. K.-F. BARILOCHE 258 s are very impor- ta nce and the con- tin neer work on this topic, among others. Then, the issues addressed here, should foster a wide research program, since the implication nt and far-reaching. What is suggested here is that a great economic effort is being made, which would be somehow useless in terms of welfare. On the other hand, forced obsolesce uous creation of new products, bring about unneces- sary pressure on natural resources, a phenomenon of highly limited rationality in terms of sustainable devel- opment. Copyright © 2011 SciRes. ME |