Paper Menu >>
Journal Menu >>
 Energy and Power En gi neering, 2011, 3, 332-338 doi:10.4236/epe.2011.33041 Published Online July 2011 (http://www.SciRP.org/journal/epe) Copyright © 2011 SciRes. EPE Pyrolysis Oil from the Fruit and Cake of Jatropha curcas Produced Usi ng a L o w Temperature Conversion (LTC) Process: Analysis of a Pyrolysis Oil-Diesel Blend Monique Kort-Kamp Figueiredo1, Gilberto Alves Romeiro1, Raquel Vieira Santana Silva1, Priscila Alvares Pinto1, Raimundo Nonato Damasceno1, Luiz Antônio d’Avila2, Amanda P. Franco2 1Programa de Pós Graduação em Química, Instituto de Química, Universidade Federal Fluminense, Niterói, Brasil 2Escola de Química, Centro de Tecnologia, Universidade Federal do Rio de Janeiro, Rio de Janeiro, Brasil E-mail: moniquekort@yahoo.com.br, gilbertoromeiro@ig.com.br Received February 1, 2011; revised March 20, 2011; accepted April 5, 2011 Abstract Background: the LTC process is a technique that consists of heating solid residues at a temperature of 380˚C - 420˚C in an inert atmosphere and their products are evaluated individually: these products include pyrolysis oil, pyrolytic char, gas and water. The objective of this study was to compare the effects of the use of oils obtained by pyrolysis of Jatropha curcas as an additive for diesel in different proportions. Results: a Low Temperature Conversion (LTC) process carried out on samples of Jatropha curcas fruit and generated pyro- lysis oil, pyrolyic char, gas and aqueous fractions in relative amounts of 23%, 37%, 16% and 14% [w/w] re- spectively for Jatropha curcas fruit and 19%, 47%, 12% and 22% [w/w] respectively for Jatropha curcas cake. The oil fractions were analyzed by FTIR, 1H NMR, 13C NMR, GCMS and physicochemical analysis. The pyrolysis oil was added to final concentrations of 2%, 5%, 10% and 20% [w/w] to commercial diesel fuel. The density, viscosity, sulfur content and flash point of the mixtures were determined. Conclusions: the results indicated that the addition of the pyrolysis oil maintained the mixtures within the standards of the diesel directive, National Petroleum Agency (ANP nº 15, of 19/7/2006), with the exception of the viscosity of the mixtures containing 20% pyrolysis oil. Keywords: Jatropha curcas, Low Temperature Conversion, Fuel and Pyrolysis Oil 1. Introduction The LTC process was developed and refined over many years by Romeiro and colleagues [1-5]. This technique consists of heating the solid residue at a temperature of 380˚C in an inert atmosphere. The LTC products are evaluated individually: these products include pyrolysis oil, pyrolytic char, gas and water. Conversion at a low temperature can be seen as an alternative technology for power generation and can be part of strategy for envi- ronmental conservation through the reuse of waste be- cause other waste processing methods such as incinera- tion or landfilling are criticized for causing environ- mental damage. The pyrolysis process has been developed and the technique has been modified with respect to residence time in the pyrolysis reactor, [6] heating rate and tem- perature according to the required analysis, Table 1 [7,8]. Several parameters of Low Temperature Conversion developed by Bayer and co-works [9-12] can be varied including residence time (1.5 - 2.0 hours), heating race (medium), temperature (380˚C - 400˚C) and products (oil, char, gas and water). The LTC process involves only thermal decomposi- tion and does not involve the use of solvents or chemical reagents. Other methods to produce alternative fuels are more sophisticated with respect to the instruments re- quired. The LTC process produces pyrolysis oil that is constituted of oxygenated compounds among others. These oxygenated compounds increase the lubricity of the diesel oil like as observed in the case of B2 and B5 when fossil fuels (diesel) and methyl fatty esters (bio- diesel) are mixed. Various biomasses sources can, in principle, be used to produce biodiesel or used s diesel additives [13-21]. a  M. K.-K. FIGUEIREDO ET AL.333 Table 1. Pyrolysis methods and their variations. Pyrolysis technology Residence time Heating rate Temperature (˚C) Products Carbonization days very low 400 charcoal Conventional 5 - 30 min low 600 oil, gas, char Fast 0.5 - 5 s very high 650 bio-oil Flash liquid <1 s high <650 bio-oil Flash gas <1 s high <650 chemicals, gas Ultra <0.5 s very high 1000 chemicals, gas Vacuum 2 - 30 s medium 400 bio-oil Hydro-pyrolysis <10 s high <500 bio-oil Metano-pyrolysis <10 s high >700 chemicals The choice of material to use in a particular region or country depends on various factors; however, the avail- ability of the plant in that region is usually of major im- portance. Clearly, the components of the plant matrix or extract used must also be compatible with diesel oil and must be suitable for use in diesel engines. The property that best demonstrates this compatibility is the cetane number and additional properties such as density, sulfur content and flash point are important in determining the adequacy of biofuels as alternative fuels. Recently we described the production of pyrolysis oil from Castor seeds via a Low Temperature Conversion (LTC) process and showed that the use of this oil in a pyrolysis oil-diesel blend is a good option [22]. The Jatropha curcas plant is a Euphorbia that is being introduced in Brazil for the purpose of biodiesel produc- tion and income generation for people of small farmers. The use of the cake the co-product produced during the extraction of oil, has so far been limited due to the toxic- ity of the seed caused by the presence of curcin and diterpene esters [23]. The objective of this study was to compare the effects of the use of oils obtained by pyrolysis of Jatropha cur- cas as an additive for diesel in different proportions. The results of this study show that the pyrolysis oil can be used as an additive and that one of the two raw materials would be better used as an additive. 2. Methods 2.1. Low Temperature Conversion (LTC) Process Samples of Jatropha curcas fruit or cake were subjected to a Low Temperature Conversion process at 380˚C. Each experiment was repeated seven times using 400 g of material each time and the results for the seven repli- cates were averaged. Each sample was placed in the cen- tral region of a cylindrical glass tube, which was then introduced into a reactor coupled to a condensing system. Nitrogen gas was continuously applied, at 500 mL/min, before the start and during the course of the process. Af- ter 10 minutes of gas purging, heating was initiated at a rate of 10˚C/min and the temperature was then main- tained at 380˚C for 2 hours. After passing through the condenser the condensable gas, pyrolysis oil and water fractions, were collected in a graduated tube and were separated based on density. The pyrolytic char was re- tained in the middle of the reactor and was collected after cooling. The non-condensed gas was passed through three traps containing, successively, NaOH 10% (w/v), NaHCO3 10% (w/v) and HCl 10% (w/v) solutions. Pa- rameters such as temperature, time of reaction and nitro- gen flow were established prior to this work by Romeiro and co-workers, these values were determined to be the best due to the higher yield of oil, the shorter time re- quired for total conversion of the raw material and the smaller amount of energy used. 2.2. Apparatus Description The conversions were carried out in a Heraus R/O 100 batch scale instrument (Figure 1)—laboratory scale, consisting: 1) oven; 2) dried sample; 3) glass wool; 4) electric resistance; 5) gas N2 inlet; 6) condenser; 7 and 8) separator funnel; 9) gas washing system [22]. 2.3. Spectroscopy Analysis 2.3.1. Infrared Spectroscopy—FTIR The FTIR spectra (400 to 4000 cm−1) were obtained us- ing a Model 1420 Perkin-Elmer Spectrometer using an Copyright © 2011 SciRes. EPE 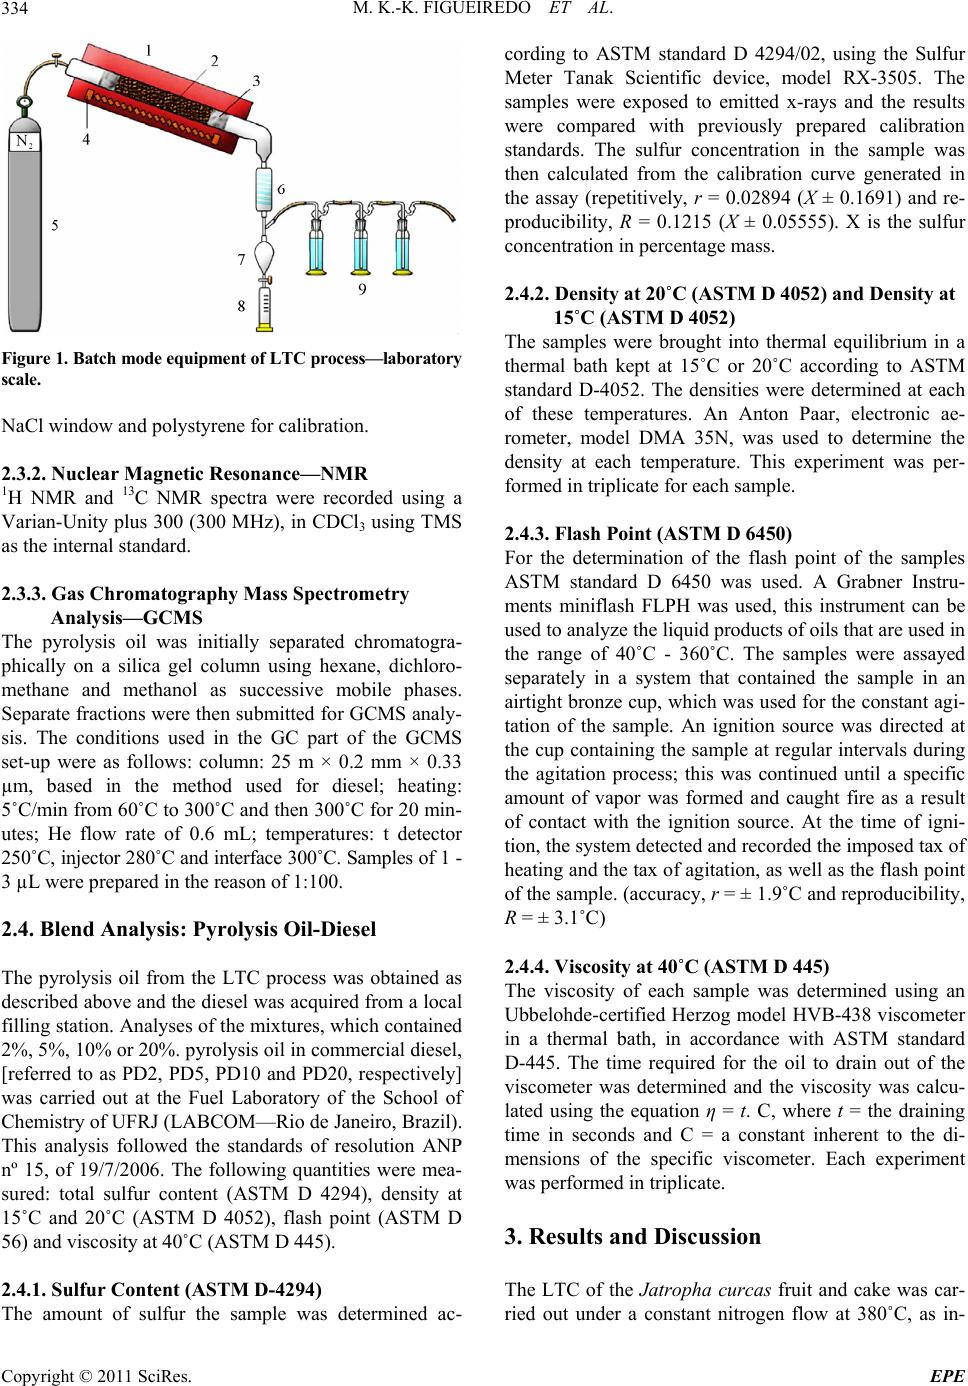 M. K.-K. FIGUEIREDO ET AL. 334 Figure 1. B atc h mode e qui p me n t of L T C pr oc es s— labo r at ory scale. NaCl window and polystyrene for calibration. 2.3.2. N uc lear Magnetic Res onance—NMR 1H NMR and 13C NMR spectra were recorded using a Varian-Unity plus 300 (300 MHz), in CDCl3 using TMS as the internal standard. 2.3.3. G as Chromatograph y Mass Spectrometry Analysis—GCMS The pyrolysis oil was initially separated chromatogra- phically on a silica gel column using hexane, dichloro- methane and methanol as successive mobile phases. Separate fractions were then submitted for GCMS analy- sis. The conditions used in the GC part of the GCMS set-up were as follows: column: 25 m × 0.2 mm × 0.33 µm, based in the method used for diesel; heating: 5˚C/min from 60˚C to 300˚C and then 300˚C for 20 min- utes; He flow rate of 0.6 mL; temperatures: t detector 250˚C, injector 280˚C and interface 300˚C. Samples of 1 - 3 µL were prepared in the reason of 1:100. 2.4. Blend Analysis: Pyrolysis Oil-Diesel The pyrolysis oil from the LTC process was obtained as described above and the diesel was acquired from a local filling station. Analyses of the mixtures, which contained 2%, 5%, 10% or 20%. pyrolysis oil in commercial diesel, [referred to as PD2, PD5, PD10 and PD20, respectively] was carried out at the Fuel Laboratory of the School of Chemistry of UFRJ (LABCOM—Rio de Janeiro, Brazil). This analysis followed the standards of resolution ANP nº 15, of 19/7/2006. The following quantities were mea- sured: total sulfur content (ASTM D 4294), density at 15˚C and 20˚C (ASTM D 4052), flash point (ASTM D 56) and viscosity at 40˚C (ASTM D 445). 2.4.1. Sul fur Conten t (ASTM D-4294) The amount of sulfur the sample was determined ac- cording to ASTM standard D 4294/02, using the Sulfur Meter Tanak Scientific device, model RX-3505. The samples were exposed to emitted x-rays and the results were compared with previously prepared calibration standards. The sulfur concentration in the sample was then calculated from the calibration curve generated in the assay (repetitively, r = 0.02894 (X ± 0.1691) and re- producibility, R = 0.1215 (X ± 0.05555). X is the sulfur concentration in percentage mass. 2.4.2. Density at 20˚C (ASTM D 4052) and Density at 15˚C (ASTM D 4052) The samples were brought into thermal equilibrium in a thermal bath kept at 15˚C or 20˚C according to ASTM standard D-4052. The densities were determined at each of these temperatures. An Anton Paar, electronic ae- rometer, model DMA 35N, was used to determine the density at each temperature. This experiment was per- formed in triplicate for each sample. 2.4.3. Flash Point (ASTM D 6450) For the determination of the flash point of the samples ASTM standard D 6450 was used. A Grabner Instru- ments miniflash FLPH was used, this instrument can be used to analyze the liquid products of oils that are used in the range of 40˚C - 360˚C. The samples were assayed separately in a system that contained the sample in an airtight bronze cup, which was used for the constant agi- tation of the sample. An ignition source was directed at the cup containing the sample at regular intervals during the agitation process; this was continued until a specific amount of vapor was formed and caught fire as a result of contact with the ignition source. At the time of igni- tion, the system detected and recorded the imposed tax of heating and the tax of agitation, as well as the flash point of the sample. (accuracy, r = ± 1.9˚C and reproducibility, R = ± 3.1˚C) 2.4.4. Vi scosity at 40˚C (ASTM D 44 5) The viscosity of each sample was determined using an Ubbelohde-certified Herzog model HVB-438 viscometer in a thermal bath, in accordance with ASTM standard D-445. The time required for the oil to drain out of the viscometer was determined and the viscosity was calcu- lated using the equation η = t. C, where t = the draining time in seconds and C = a constant inherent to the di- mensions of the specific viscometer. Each experiment was performed in triplicate. 3. Results and Discussion The LTC of the Jatropha curcas fruit and cake was car- ried out under a constant nitrogen flow at 380˚C, as in- Copyright © 2011 SciRes. EPE  M. K.-K. FIGUEIREDO ET AL.335 dicated in the experimental section. This process resulted in the production of four fractions: pyrolysis oil [23%], an aqueous fraction [12%], pyrolytic char [41%] and gas [24%] for Jatropha curcas fruit and pyrolysis oil [19%], an aqueous fraction [12%], pyrolytic char [47%] and gas [22%] for Jatropha curcas cake. 3.1. Spectroscopy Analyses of the Crude Oil Fraction Significant absorptions in the FTIR spectra of the crude pyrolysis oil, were found at 3418 cm–1 (axial deformation of OH); 2920 cm–1 and 2854 cm–1 (axial deformation of C-C aliphatic); 1700 cm–1 (carbonyl group) and 1463 cm–1 (angular deformation of CH3 and CH2) for Jatropha curcas fruit and 3407 cm–1 (axial deformation of OH); 2923 cm–1 and 2873 cm–1 (axial deformation of C-C ali- phatic); 1737 cm–1 (carbonyl group) and 1466 cm–1 (an- gular deformation of CH3 and CH2) for Jatropha curcas cake. The absorptions observed by FTIR show that the mixture contained hydrocarbons and carbonyl com- pounds in both cases and that there were probably hy- drogen bonds are present. In order to compare the 1H NMR data of the comer- cial diesel and the crude pyrolysis croud oil, we consi- dered the “Total aromatic” (δ 6.3 - 9.3 ppm) and “Total aliphatic” (δ 0.5 - 4.5 ppm) regions in the 1H NMR spec- tra. The high number of aliphatic hydrogens in both spectra demonstrated the presence of sp3 carbons. The most important difference was the presence of olefinic compounds in the pyrolysis oil from Jatropha curcas fruit and cake. The oils were then chromatographically separated using, hexane, dichloromethane and methanol as mobile phases. The fraction obtained with hexane (the apolar fraction) was analyzed by GCMS (retention times and m/z peaks) and 44 hydrocarbons were observed: 14 alkanes from C9 to C30, 22 alkenes from C9 to C20, 5 alkyl-aromatic compound and 3 alkyl-aliphatic com- ponds, Table 2. In the polar fractions, which were eluted with dichloromethane and methanol, Table 3, it was observed 8 acids (66%), 1 ester, 1 aldehyde and 1 ketone. In order to try to elucidate how these changes occured at 380˚C we compared the composition of the Jatropha curcas sample with the compounds obtained in the chromatographic analysis. The composition of the sam- ple before was as follows: 37% triglycerides, the identity of which depended on the fatty acid structure and distribution: palmitic— C16:0; palmitoleic—C16:1; estearic—C18:0; oleic— C18:1; linoleic—C18:2 and eicosanoic—C20:0 acids; and Table 2. Main compounds detected in the hexane fraction by GCMS of the Jatropha curcas fruit and cake. Compounds RT Quality m/z 1-nonene 3.075 90 126 nonane 3.194 93 128 1-decene 4.773 95 140 decane 4.950 97 142 (Z)-2-decene 5.054 94 140 (E)-2-decene 5.231 93 140 butylbenzene 6.196 97 134 1-undecene 7.025 97 154 undecane 7.233 97 156 (Z)-2-undecene 7.350 94 154 (E)-2-undecene 7.549 92 154 pentylbenzene 8.667 95 148 isobutyltoluene 8.875 90 148 1-dodecene 9.583 95 196 dodecane 9.808 97 170 (Z)-2-dodecene 9.926 96 168 (E)-2-dodecene 10.149 93 168 hexylbenzene 11.353 93 162 1-tridecene 12.225 96 224 tridecane 12.460 93 196 (Z)-2-tridecene 12.559 93 196 heptylbenzene 14.057 90 176 1-tetradecene 14.825 96 252 tetradecane 15.042 98 198 (Z)-2-tetradecene 15.156 91 198 undecylcyclopentane 16.233 94 224 1-pentadecene 17.342 97 210 pentadecane 17.558 98 212 n-pentadecylcyclohexane 18.767 91 294 cyclohexadecane 19.400 94 224 (Z)-8-hexadecene 19.542 93 224 1-hexadecene 19.733 96 210 hexadecane 19.925 96 240 (Z)-2-hexadecene 20.017 94 224 8-heptadecene 21.667 96 238 1-heptadecene 22.028 96 238 heptadecane 22.200 96 240 1-octadecene 24.191 92 252 octadecane 24.333 96 254 nonadecene 26.381 92 268 eicosane 28.344 93 282 heneicosane 30.224 94 296 docosane 32.019 93 310 tricosane 33.790 92 324 Copyright © 2011 SciRes. EPE 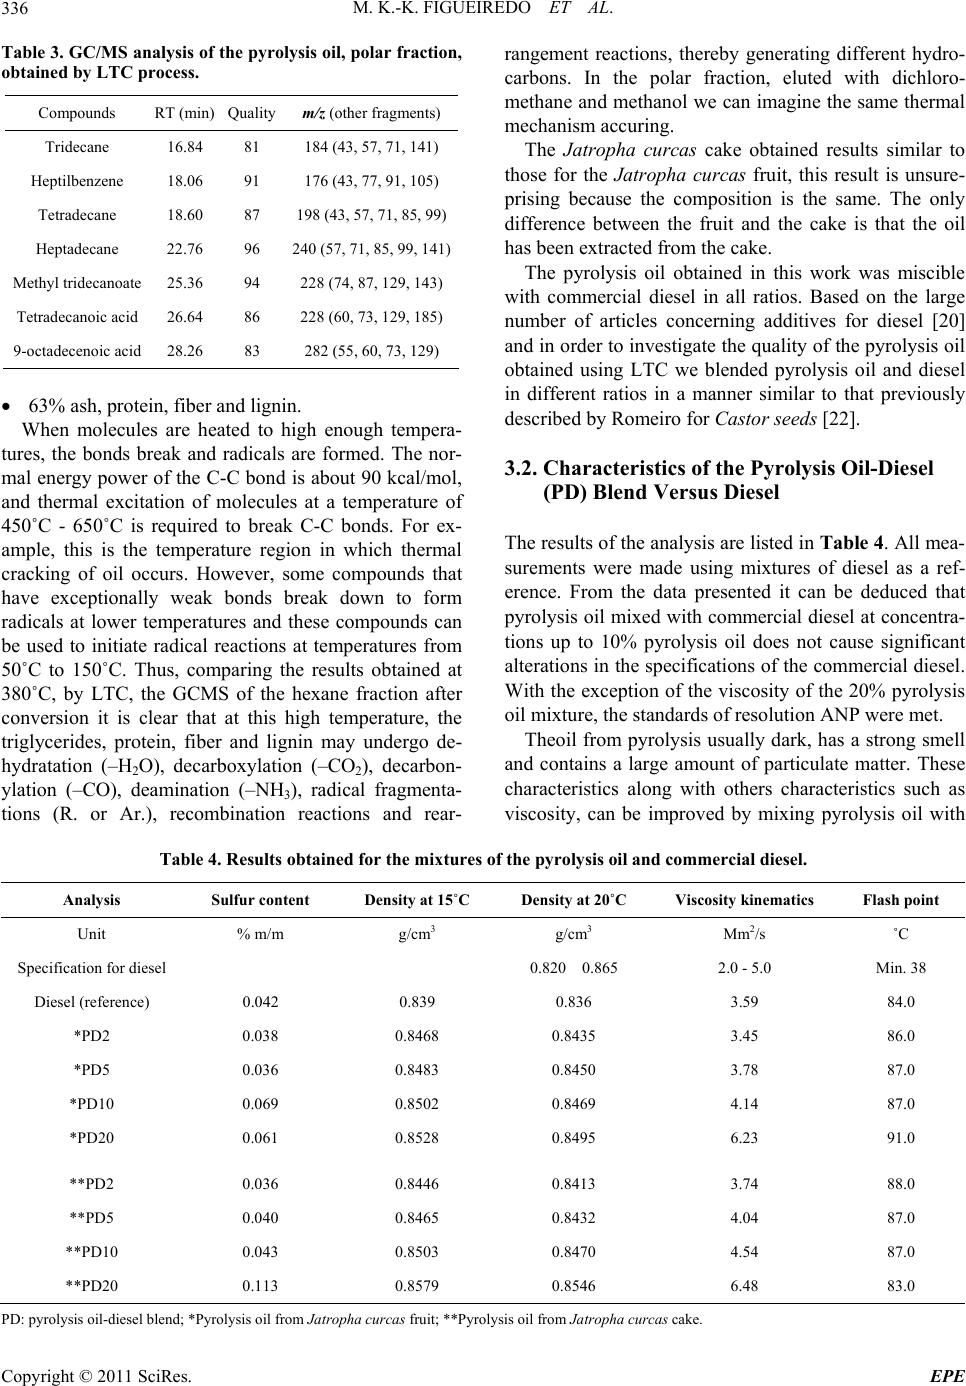 M. K.-K. FIGUEIREDO ET AL. Copyright © 2011 SciRes. EPE 336 Table 3. GC/MS analysis of the pyrolysis oil, polar fraction, obtained by LTC proce ss. Compounds RT (min) Quality m/z (other fragments) Tridecane 16.84 81 184 (43, 57, 71, 141) Heptilbenzene 18.06 91 176 (43, 77, 91, 105) Tetradecane 18.60 87 198 (43, 57, 71, 85, 99) Heptadecane 22.76 96 240 (57, 71, 85, 99, 141) Methyl tridecanoate 25.36 94 228 (74, 87, 129, 143) Tetradecanoic acid 26.64 86 228 (60, 73, 129, 185) 9-octadecenoic acid 28.26 83 282 (55, 60, 73, 129) 63% ash, protein, fiber and lignin. When molecules are heated to high enough tempera- tures, the bonds break and radicals are formed. The nor- mal energy power of the C-C bond is about 90 kcal/mol, and thermal excitation of molecules at a temperature of 450˚C - 650˚C is required to break C-C bonds. For ex- ample, this is the temperature region in which thermal cracking of oil occurs. However, some compounds that have exceptionally weak bonds break down to form radicals at lower temperatures and these compounds can be used to initiate radical reactions at temperatures from 50˚C to 150˚C. Thus, comparing the results obtained at 380˚C, by LTC, the GCMS of the hexane fraction after conversion it is clear that at this high temperature, the triglycerides, protein, fiber and lignin may undergo de- hydratation (–H2O), decarboxylation (–CO2), decarbon- ylation (–CO), deamination (–NH3), radical fragmenta- tions (R. or Ar.), recombination reactions and rear- rangement reactions, thereby generating different hydro- carbons. In the polar fraction, eluted with dichloro- methane and methanol we can imagine the same thermal mechanism accuring. The Jatropha curcas cake obtained results similar to those for the Jatropha curcas fruit, this result is unsure- prising because the composition is the same. The only difference between the fruit and the cake is that the oil has been extracted from the cake. The pyrolysis oil obtained in this work was miscible with commercial diesel in all ratios. Based on the large number of articles concerning additives for diesel [20] and in order to investigate the quality of the pyrolysis oil obtained using LTC we blended pyrolysis oil and diesel in different ratios in a manner similar to that previously described by Romeiro for Castor seeds [22]. 3.2. Characteristics of the Pyrolysis Oil-Diesel (PD) Blend Versus Diesel The results of the analysis are listed in Table 4. All mea- surements were made using mixtures of diesel as a ref- erence. From the data presented it can be deduced that pyrolysis oil mixed with commercial diesel at concentra- tions up to 10% pyrolysis oil does not cause significant alterations in the specifications of the commercial diesel. With the exception of the viscosity of the 20% pyrolysis oil mixture, the standards of resolution ANP were met. Theoil from pyrolysis usually dark, has a strong smell and contains a large amount of particulate matter. These characteristics along with others characteristics such as viscosity, can be improved by mixing pyrolysis oil with Table 4. Results obtained for the mixtures of the pyrolysis oil and commercial diesel. Analysis Sulfur content Density at 15˚C Density at 20˚C Viscosity kinematics Flash point Unit % m/m g/cm3 g/cm3 Mm2/s ˚C Specification for diesel 0.820 0.865 2.0 - 5.0 Min. 38 Diesel (reference) 0.042 0.839 0.836 3.59 84.0 *PD2 0.038 0.8468 0.8435 3.45 86.0 *PD5 0.036 0.8483 0.8450 3.78 87.0 *PD10 0.069 0.8502 0.8469 4.14 87.0 *PD20 0.061 0.8528 0.8495 6.23 91.0 **PD2 0.036 0.8446 0.8413 3.74 88.0 **PD5 0.040 0.8465 0.8432 4.04 87.0 **PD10 0.043 0.8503 0.8470 4.54 87.0 **PD20 0.113 0.8579 0.8546 6.48 83.0 PD: pyrolysis oil-diesel blend; *Pyrolysis oil from Jatropha curcas fruit; **Pyrolysis oil from Jatropha curcas cake. 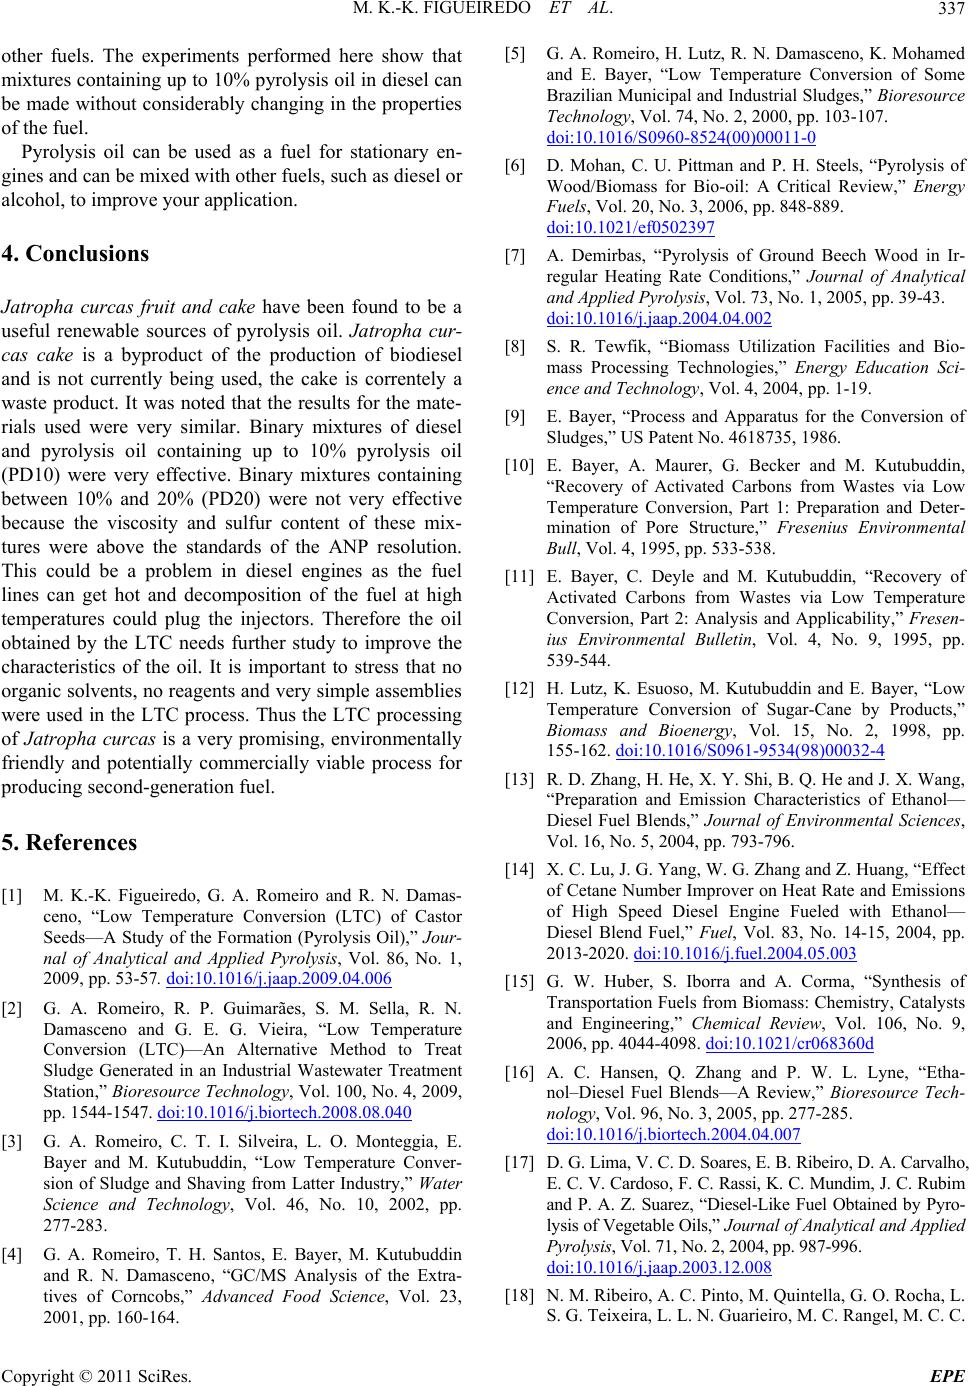 M. K.-K. FIGUEIREDO ET AL. Copyright © 2011 SciRes. EPE 337 other fuels. The experiments performed here show that mixtures containing up to 10% pyrolysis oil in diesel can be made without considerably changing in the properties of the fuel. Pyrolysis oil can be used as a fuel for stationary en- gines and can be mixed with other fuels, such as diesel or alcohol, to improve your application. 4. Conclusions Jatropha curcas fruit and cake have been found to be a useful renewable sources of pyrolysis oil. Jatropha cur- cas cake is a byproduct of the production of biodiesel and is not currently being used, the cake is correntely a waste product. It was noted that the results for the mate- rials used were very similar. Binary mixtures of diesel and pyrolysis oil containing up to 10% pyrolysis oil (PD10) were very effective. Binary mixtures containing between 10% and 20% (PD20) were not very effective because the viscosity and sulfur content of these mix- tures were above the standards of the ANP resolution. This could be a problem in diesel engines as the fuel lines can get hot and decomposition of the fuel at high temperatures could plug the injectors. Therefore the oil obtained by the LTC needs further study to improve the characteristics of the oil. It is important to stress that no organic solvents, no reagents and very simple assemblies were used in the LTC process. Thus the LTC processing of Jatropha curcas is a very promising, environmentally friendly and potentially commercially viable process for producing second-generation fuel. 5. References [1] M. K.-K. Figueiredo, G. A. Romeiro and R. N. Damas- ceno, “Low Temperature Conversion (LTC) of Castor Seeds—A Study of the Formation (Pyrolysis Oil),” Jour- nal of Analytical and Applied Pyrolysis, Vol. 86, No. 1, 2009, pp. 53-57. doi:10.1016/j.jaap.2009.04.006 [2] G. A. Romeiro, R. P. Guimarães, S. M. Sella, R. N. Damasceno and G. E. G. Vieira, “Low Temperature Conversion (LTC)—An Alternative Method to Treat Sludge Generated in an Industrial Wastewater Treatment Station,” Bioresource Technology, Vol. 100, No. 4, 2009, pp. 1544-1547. doi:10.1016/j.biortech.2008.08.040 [3] G. A. Romeiro, C. T. I. Silveira, L. O. Monteggia, E. Bayer and M. Kutubuddin, “Low Temperature Conver- sion of Sludge and Shaving from Latter Industry,” Water Science and Technology, Vol. 46, No. 10, 2002, pp. 277-283. [4] G. A. Romeiro, T. H. Santos, E. Bayer, M. Kutubuddin and R. N. Damasceno, “GC/MS Analysis of the Extra- tives of Corncobs,” Advanced Food Science, Vol. 23, 2001, pp. 160-164. [5] G. A. Romeiro, H. Lutz, R. N. Damasceno, K. Mohamed and E. Bayer, “Low Temperature Conversion of Some Brazilian Municipal and Industrial Sludges,” Bioresource Technology, Vol. 74, No. 2, 2000, pp. 103-107. doi:10.1016/S0960-8524(00)00011-0 [6] D. Mohan, C. U. Pittman and P. H. Steels, “Pyrolysis of Wood/Biomass for Bio-oil: A Critical Review,” Energy Fuels, Vol. 20, No. 3, 2006, pp. 848-889. doi:10.1021/ef0502397 [7] A. Demirbas, “Pyrolysis of Ground Beech Wood in Ir- regular Heating Rate Conditions,” Journal of Analytical and Applied Pyrolysis, Vol. 73, No. 1, 2005, pp. 39-43. doi:10.1016/j.jaap.2004.04.002 [8] S. R. Tewfik, “Biomass Utilization Facilities and Bio- mass Processing Technologies,” Energy Education Sci- ence and Technology, Vol. 4, 2004, pp. 1-19. [9] E. Bayer, “Process and Apparatus for the Conversion of Sludges,” US Patent No. 4618735, 1986. [10] E. Bayer, A. Maurer, G. Becker and M. Kutubuddin, “Recovery of Activated Carbons from Wastes via Low Temperature Conversion, Part 1: Preparation and Deter- mination of Pore Structure,” Fresenius Environmental Bull, Vol. 4, 1995, pp. 533-538. [11] E. Bayer, C. Deyle and M. Kutubuddin, “Recovery of Activated Carbons from Wastes via Low Temperature Conversion, Part 2: Analysis and Applicability,” Fresen- ius Environmental Bulletin, Vol. 4, No. 9, 1995, pp. 539-544. [12] H. Lutz, K. Esuoso, M. Kutubuddin and E. Bayer, “Low Temperature Conversion of Sugar-Cane by Products,” Biomass and Bioenergy, Vol. 15, No. 2, 1998, pp. 155-162. doi:10.1016/S0961-9534(98)00032-4 [13] R. D. Zhang, H. He, X. Y. Shi, B. Q. He and J. X. Wang, “Preparation and Emission Characteristics of Ethanol— Diesel Fuel Blends,” Journal of Environmental Sciences, Vol. 16, No. 5, 2004, pp. 793-796. [14] X. C. Lu, J. G. Yang, W. G. Zhang and Z. Huang, “Effect of Cetane Number Improver on Heat Rate and Emissions of High Speed Diesel Engine Fueled with Ethanol— Diesel Blend Fuel,” Fuel, Vol. 83, No. 14-15, 2004, pp. 2013-2020. doi:10.1016/j.fuel.2004.05.003 [15] G. W. Huber, S. Iborra and A. Corma, “Synthesis of Transportation Fuels from Biomass: Chemistry, Catalysts and Engineering,” Chemical Review, Vol. 106, No. 9, 2006, pp. 4044-4098. doi:10.1021/cr068360d [16] A. C. Hansen, Q. Zhang and P. W. L. Lyne, “Etha- nol–Diesel Fuel Blends—A Review,” Bioresource Tech- nology, Vol. 96, No. 3, 2005, pp. 277-285. doi:10.1016/j.biortech.2004.04.007 [17] D. G. Lima, V. C. D. Soares, E. B. Ribeiro, D. A. Carvalho, E. C. V. Cardoso, F. C. Rassi, K. C. Mundim, J. C. Rubim and P. A. Z. Suarez, “Diesel-Like Fuel Obtained by Pyro- lysis of Vegetable Oils,” Journal of Analytical and Applied Pyrolysis, Vol. 71, No. 2, 2004, pp. 987-996. doi:10.1016/j.jaap.2003.12.008 [18] N. M. Ribeiro, A. C. Pinto, M. Quintella, G. O. Rocha, L. S. G. Teixeira, L. L. N. Guarieiro, M. C. Rangel, M. C. C.  M. K.-K. FIGUEIREDO ET AL. 338 Veloso, M. J. C. Rezende, R. S. Cruz, A. M. Oliveira, E. A. Torres and J. B. Andrade, “The Role of Additives for Diesel and Diesel Blended (Ethanol or Biodiesel) Fuels: A Review,” Energy and Fuels, Vol. 21, No. 4, 2007, pp. 2433-2445. doi:10.1021/ef070060r [19] K. H. Song, P. Nag, T. A. Litzinger and D. C. Haworth, “Effects of Oxygenated Additives on Aromatic Species in Fuel-Rich, Premixed Ethane Combustion: A Modeling Study,” Combustion and Flame, Vol. 135, No. 3, 2003, pp. 341-349. doi:10.1016/S0010-2180(03)00180-9 [20] S. L. Dmytryshyn, A. K. Dalai, S. T. Claudhari, H. K. Mishra and M. J. Reaney, “Synthesis and Characterization of Vegetable Oil Derived Esters: Evaluation for Their Die- sel Additive Properties,” Bioresource Technology, Vol. 92, No. 1, 2004, pp. 55-64. doi:10.1016/j.biortech.2003.07.009 [21] X. Shi, Y. Yu, H. He, S. Shuai, J. Wang and R. Li, “Emission Characteristics Using Methyl Soyate-Ethanol- Diesel Fuel Blends on a Diesel Engine,” Fuel, Vol. 84, No. 12-13, 2005, pp. 1543-1549. doi:10.1016/j.fuel.2005.03.001 [22] M. K.-K. Figueiredo, G. A. Romeiro, R. N. Damasceno, L. A. d’Avila and A. P. Franco, “The Isolation of Pyrolysis Oil from Castor Seeds via a Low Temperature Conversion (LTC) Process and Its Use in a Pyrolysis Oil—Diesel Blend,” Fuel, Vol. 88, No. 11, 2009, pp. 2193-2198. doi:10.1016/j.fuel.2009.05.025 [23] J. Heller, “Physic Nut (Jatropha curcas)—Promoting the Conservation and Use of Underutilized and Neglected Crops,” Institute of Plant Genetics and Crop Plant Re- search, Gatersleben/International Plant Genetic Resources Institute, Rome, 1996, p. 66. Copyright © 2011 SciRes. EPE |