Paper Menu >>
Journal Menu >>
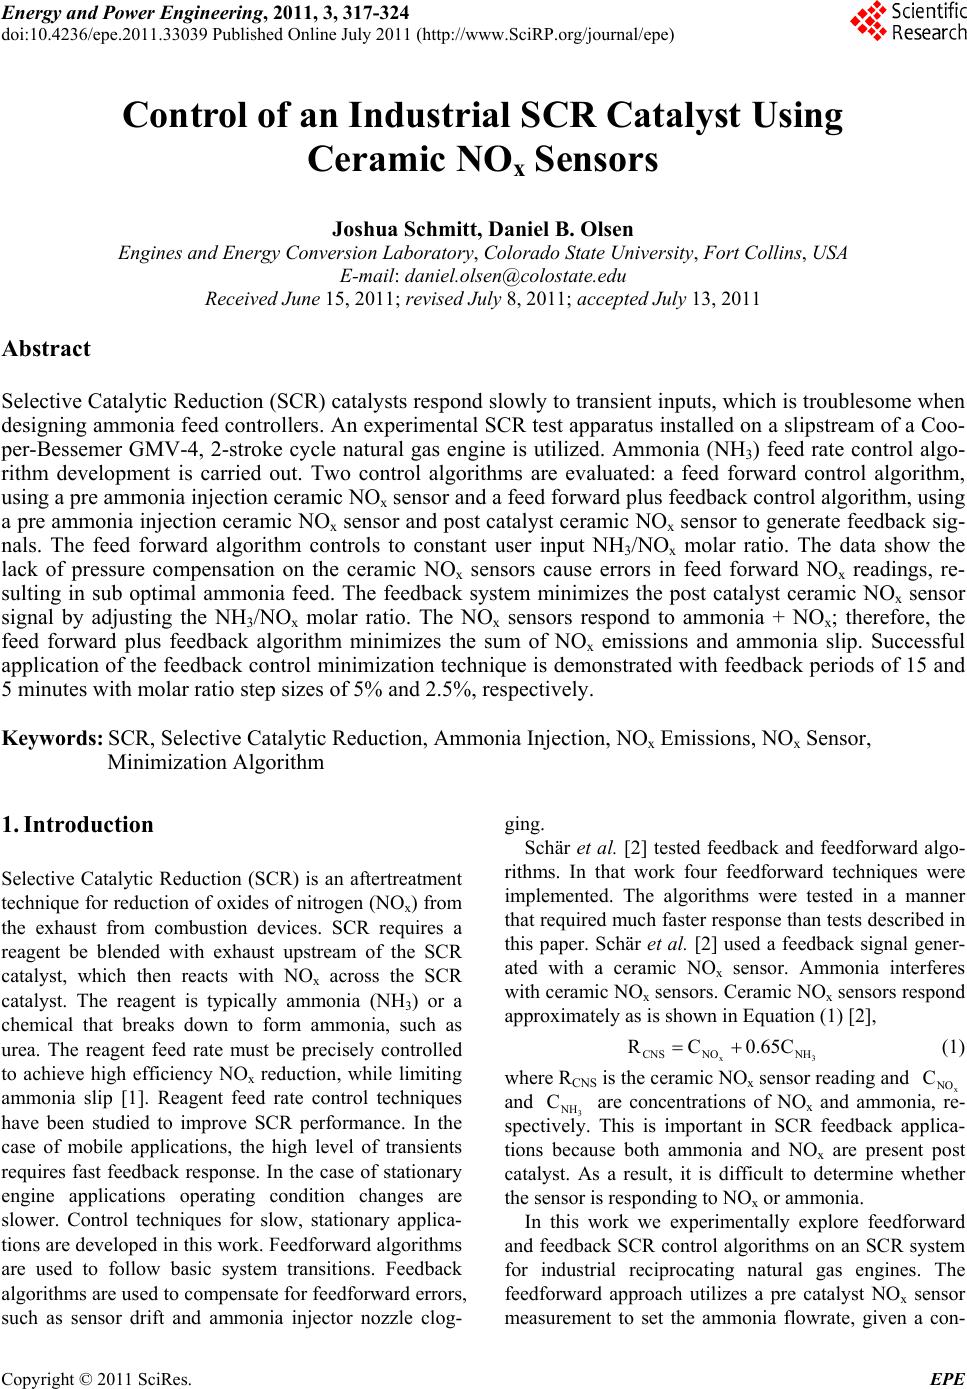 Energy and Power En gi neering, 2011, 3, 317-324 doi:10.4236/epe.2011.33039 Published Online July 2011 (http://www.SciRP.org/journal/epe) Copyright © 2011 SciRes. EPE Control of an Industrial SCR Catalyst Using Ceramic NOx Sensors Joshua Schmitt, Daniel B. Olsen Engines and Energy Conversion Laboratory, Colorado State University, Fort Collins, USA E-mail: daniel.olsen@colostate.edu Received June 15, 2011; revised July 8, 2011; accepted July 13, 2011 Abstract Selective Catalytic Reduction (SCR) catalysts respond slowly to transient inputs, which is troublesome when designing ammonia feed controllers. An experimental SCR test apparatus installed on a slipstream of a Coo- per-Bessemer GMV-4, 2-stroke cycle natural gas engine is utilized. Ammonia (NH3) feed rate control algo- rithm development is carried out. Two control algorithms are evaluated: a feed forward control algorithm, using a pre ammonia injection ceramic NOx sensor and a feed forward plus feedback control algorithm, using a pre ammonia injection ceramic NOx sensor and post catalyst ceramic NOx sensor to generate feedback sig- nals. The feed forward algorithm controls to constant user input NH3/NOx molar ratio. The data show the lack of pressure compensation on the ceramic NOx sensors cause errors in feed forward NOx readings, re- sulting in sub optimal ammonia feed. The feedback system minimizes the post catalyst ceramic NOx sensor signal by adjusting the NH3/NOx molar ratio. The NOx sensors respond to ammonia + NOx; therefore, the feed forward plus feedback algorithm minimizes the sum of NOx emissions and ammonia slip. Successful application of the feedback control minimization technique is demonstrated with feedback periods of 15 and 5 minutes with molar ratio step sizes of 5% and 2.5%, respectively. Keywords: SCR, Selective Catalytic Reduction, Ammonia Injection, NOx Emissions, NOx Sensor, Minimization Algorithm 1. Introduction Selective Catalytic Reduction (SCR) is an aftertreatment technique for reduction of oxides of nitrogen (NOx) from the exhaust from combustion devices. SCR requires a reagent be blended with exhaust upstream of the SCR catalyst, which then reacts with NOx across the SCR catalyst. The reagent is typically ammonia (NH3) or a chemical that breaks down to form ammonia, such as urea. The reagent feed rate must be precisely controlled to achieve high efficiency NOx reduction, while limiting ammonia slip [1]. Reagent feed rate control techniques have been studied to improve SCR performance. In the case of mobile applications, the high level of transients requires fast feedback response. In the case of stationary engine applications operating condition changes are slower. Control techniques for slow, stationary applica- tions are developed in this work. Feedforward algorithms are used to follow basic system transitions. Feedback algorithms are used to compensate for feedforward errors, such as sensor drift and ammonia injector nozzle clog- ging. Schär et al. [2] tested feedback and feedforward algo- rithms. In that work four feedforward techniques were implemented. The algorithms were tested in a manner that required much faster response than tests described in this paper. Schär et al. [2] used a feedback signal gener- ated with a ceramic NOx sensor. Ammonia interferes with ceramic NOx sensors. Ceramic NOx sensors respond approximately as is shown in Equation (1) [2], x CNS NONH RC 0.65C 3 (1) where RCNS is the ceramic NOx sensor reading and x NO and 3 NH are concentrations of NOx and ammonia, re- spectively. This is important in SCR feedback applica- tions because both ammonia and NOx are present post catalyst. As a result, it is difficult to determine whether the sensor is responding to NOx or ammonia. C C In this work we experimentally explore feedforward and feedback SCR control algorithms on an SCR system for industrial reciprocating natural gas engines. The feedforward approach utilizes a pre catalyst NOx sensor measurement to set the ammonia flowrate, given a con- 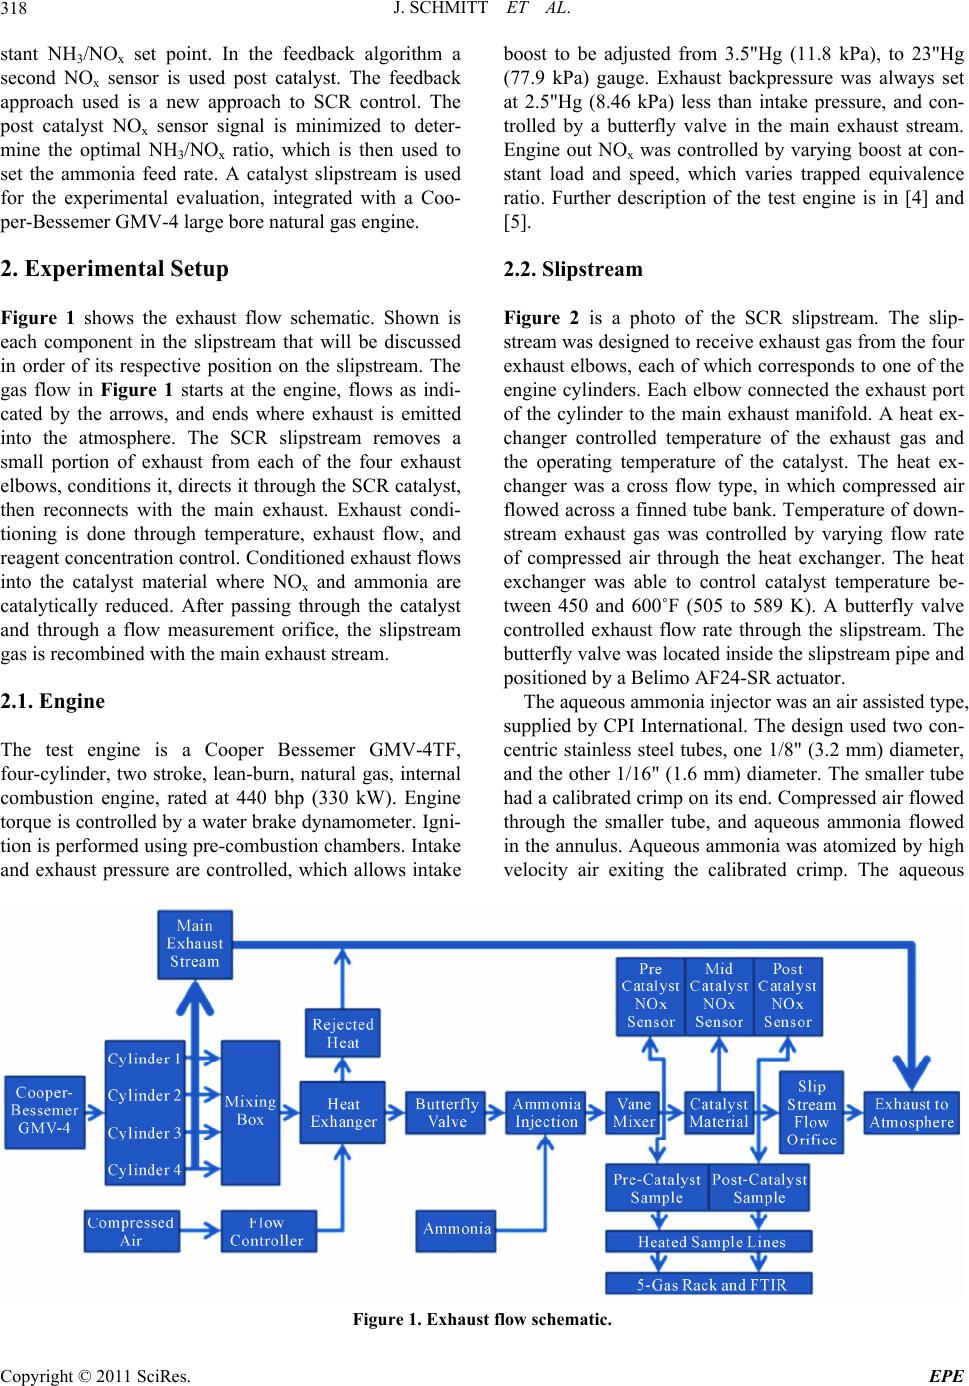 J. SCHMITT ET AL. 318 stant NH3/NOx set point. In the feedback algorithm a second NOx sensor is used post catalyst. The feedback approach used is a new approach to SCR control. The post catalyst NOx sensor signal is minimized to deter- mine the optimal NH3/NOx ratio, which is then used to set the ammonia feed rate. A catalyst slipstream is used for the experimental evaluation, integrated with a Coo- per-Bessemer GMV-4 large bore natural gas engine. 2. Experimental Setup Figure 1 shows the exhaust flow schematic. Shown is each component in the slipstream that will be discussed in order of its respective position on the slipstream. The gas flow in Figure 1 starts at the engine, flows as indi- cated by the arrows, and ends where exhaust is emitted into the atmosphere. The SCR slipstream removes a small portion of exhaust from each of the four exhaust elbows, conditions it, directs it through the SCR catalyst, then reconnects with the main exhaust. Exhaust condi- tioning is done through temperature, exhaust flow, and reagent concentration control. Conditioned exhaust flows into the catalyst material where NOx and ammonia are catalytically reduced. After passing through the catalyst and through a flow measurement orifice, the slipstream gas is recombined with the main exhaust stream. 2.1. Engine The test engine is a Cooper Bessemer GMV-4TF, four-cylinder, two stroke, lean-burn, natural gas, internal combustion engine, rated at 440 bhp (330 kW). Engine torque is controlled by a water brake dynamometer. Igni- tion is performed using pre-combustion chambers. Intake and exhaust pressure are controlled, which allows intake boost to be adjusted from 3.5"Hg (11.8 kPa), to 23"Hg (77.9 kPa) gauge. Exhaust backpressure was always set at 2.5"Hg (8.46 kPa) less than intake pressure, and con- trolled by a butterfly valve in the main exhaust stream. Engine out NOx was controlled by varying boost at con- stant load and speed, which varies trapped equivalence ratio. Further description of the test engine is in [4] and [5]. 2.2. Slipstream Figure 2 is a photo of the SCR slipstream. The slip- stream was designed to receive exhaust gas from the four exhaust elbows, each of which corresponds to one of the engine cylinders. Each elbow connected the exhaust port of the cylinder to the main exhaust manifold. A heat ex- changer controlled temperature of the exhaust gas and the operating temperature of the catalyst. The heat ex- changer was a cross flow type, in which compressed air flowed across a finned tube bank. Temperature of down- stream exhaust gas was controlled by varying flow rate of compressed air through the heat exchanger. The heat exchanger was able to control catalyst temperature be- tween 450 and 600˚F (505 to 589 K). A butterfly valve controlled exhaust flow rate through the slipstream. The butterfly valve was located inside the slipstream pipe and positioned by a Belimo AF24-SR actuator. The aqueous ammonia injector was an air assisted type, supplied by CPI International. The design used two con- centric stainless steel tubes, one 1/8" (3.2 mm) diameter, and the other 1/16" (1.6 mm) diameter. The smaller tube had a calibrated crimp on its end. Compressed air flowed through the smaller tube, and aqueous ammonia flowed in the annulus. Aqueous ammonia was atomized by high velocity air exiting the calibrated crimp. The aqueous Figure 1. Exhaust flow schematic. Copyright © 2011 SciRes. EPE 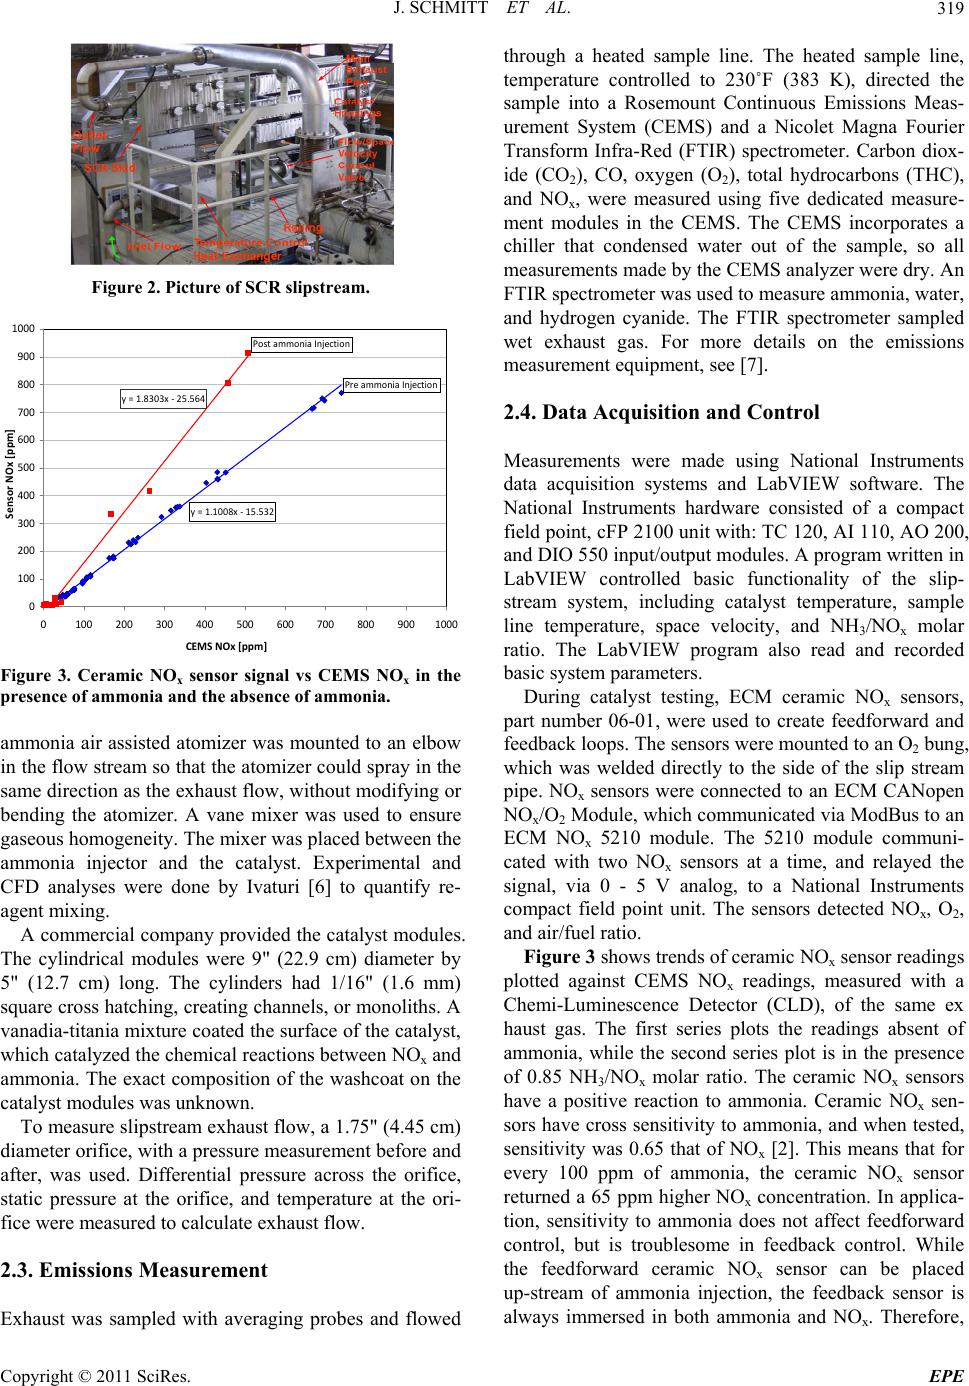 J. SCHMITT ET AL. Copyright © 2011 SciRes. EPE 319 Figure 2. Picture of SCR slipstream. y=1.1008x‐15.532 y=1.8303x‐25.564 0 100 200 300 400 500 600 700 800 900 1000 0100 200 300 400 500 600 700 800 9001000 CEMSNOx [pp m ] SensorNOx[ppm] PreammoniaInjection PostammoniaInjection Figure 3. Ceramic NOx sensor signal vs CEMS NOx in the presence of ammonia and the absence of ammonia. ammonia air assisted atomizer was mounted to an elbow in the flow stream so that the atomizer could spray in the same direction as the exhaust flow, without modifying or bending the atomizer. A vane mixer was used to ensure gaseous homogeneity. The mixer was placed between the ammonia injector and the catalyst. Experimental and CFD analyses were done by Ivaturi [6] to quantify re- agent mixing. A commercial company provided the catalyst modules. The cylindrical modules were 9" (22.9 cm) diameter by 5" (12.7 cm) long. The cylinders had 1/16" (1.6 mm) square cross hatching, creating channels, or monoliths. A vanadia-titania mixture coated the surface of the catalyst, which catalyzed the chemical reactions between NOx and ammonia. The exact composition of the washcoat on the catalyst modules was unknown. To measure slipstream exhaust flow, a 1.75" (4.45 cm) diameter orifice, with a pressure measurement before and after, was used. Differential pressure across the orifice, static pressure at the orifice, and temperature at the ori- fice were measured to calculate exhaust flow. 2.3. Emissions Measurement Exhaust was sampled with averaging probes and flowed through a heated sample line. The heated sample line, temperature controlled to 230˚F (383 K), directed the sample into a Rosemount Continuous Emissions Meas- urement System (CEMS) and a Nicolet Magna Fourier Transform Infra-Red (FTIR) spectrometer. Carbon diox- ide (CO2), CO, oxygen (O2), total hydrocarbons (THC), and NOx, were measured using five dedicated measure- ment modules in the CEMS. The CEMS incorporates a chiller that condensed water out of the sample, so all measurements made by the CEMS analyzer were dry. An FTIR spectrometer was used to measure ammonia, water, and hydrogen cyanide. The FTIR spectrometer sampled wet exhaust gas. For more details on the emissions measurement equipment, see [7]. 2.4. Data Acquisition and Control Measurements were made using National Instruments data acquisition systems and LabVIEW software. The National Instruments hardware consisted of a compact field point, cFP 2100 unit with: TC 120, AI 110, AO 200, and DIO 550 input/output modules. A program written in LabVIEW controlled basic functionality of the slip- stream system, including catalyst temperature, sample line temperature, space velocity, and NH3/NOx molar ratio. The LabVIEW program also read and recorded basic system parameters. During catalyst testing, ECM ceramic NOx sensors, part number 06-01, were used to create feedforward and feedback loops. The sensors were mounted to an O2 bung, which was welded directly to the side of the slip stream pipe. NOx sensors were connected to an ECM CANopen NOx/O2 Module, which communicated via ModBus to an ECM NOx 5210 module. The 5210 module communi- cated with two NOx sensors at a time, and relayed the signal, via 0 - 5 V analog, to a National Instruments compact field point unit. The sensors detected NOx, O2, and air/fuel ratio. Figure 3 shows trends of ceramic NOx sensor readings plotted against CEMS NOx readings, measured with a Chemi-Luminescence Detector (CLD), of the same ex haust gas. The first series plots the readings absent of ammonia, while the second series plot is in the presence of 0.85 NH3/NOx molar ratio. The ceramic NOx sensors have a positive reaction to ammonia. Ceramic NOx sen- sors have cross sensitivity to ammonia, and when tested, sensitivity was 0.65 that of NOx [2]. This means that for every 100 ppm of ammonia, the ceramic NOx sensor returned a 65 ppm higher NOx concentration. In applica- tion, sensitivity to ammonia does not affect feedforward control, but is troublesome in feedback control. While the feedforward ceramic NOx sensor can be placed up-stream of ammonia injection, the feedback sensor is always immersed in both ammonia and NOx. Therefore, 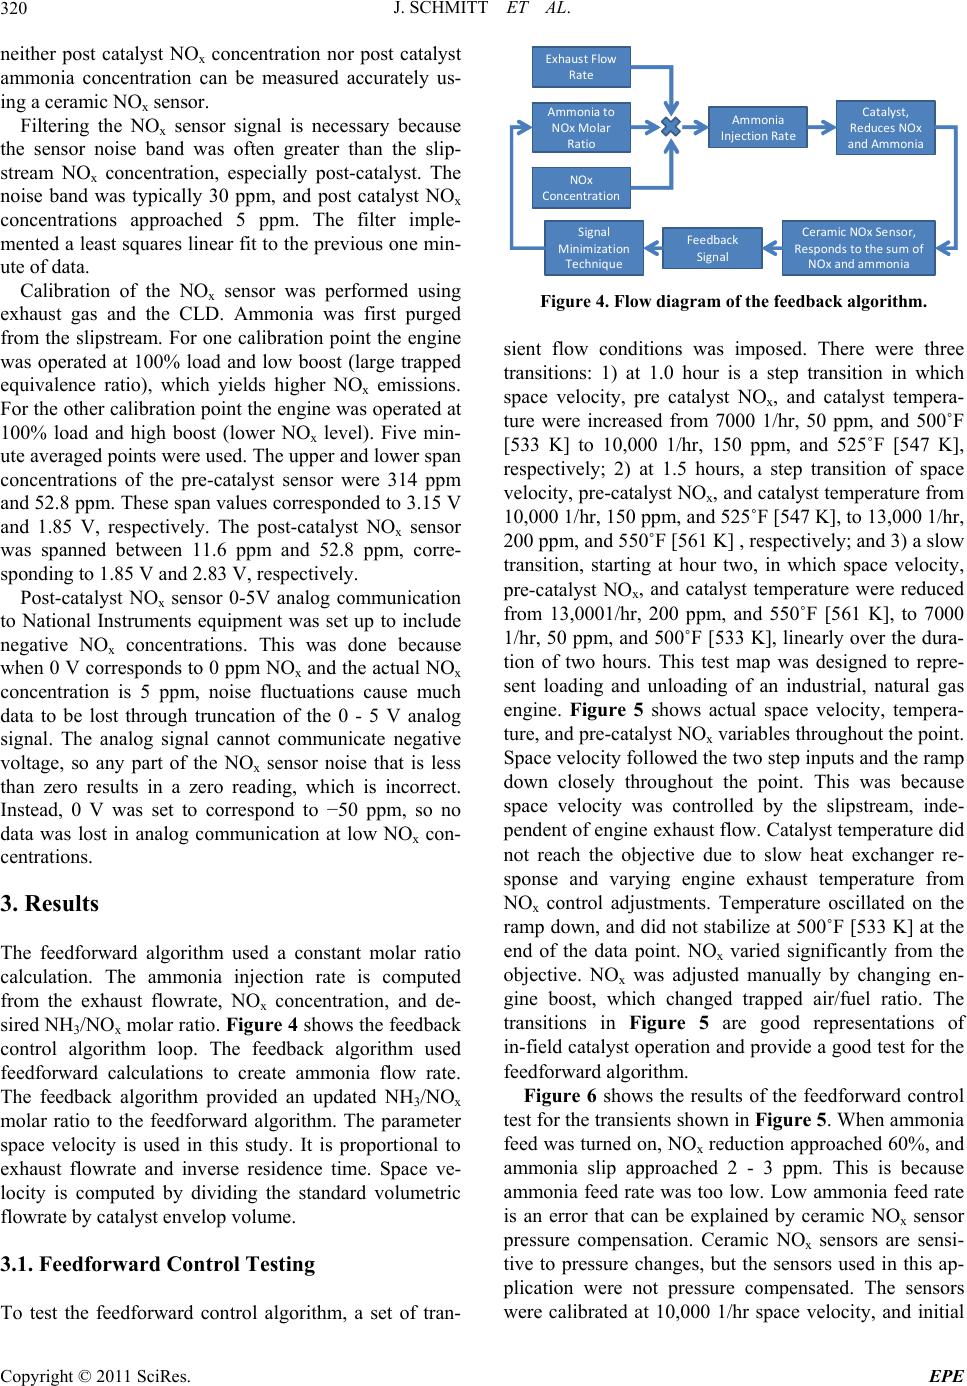 J. SCHMITT ET AL. 320 neither post catalyst NOx concentration nor post catalyst ammonia concentration can be measured accurately us- ing a ceramic NOx sensor. Filtering the NOx sensor signal is necessary because the sensor noise band was often greater than the slip- stream NOx concentration, especially post-catalyst. The noise band was typically 30 ppm, and post catalyst NOx concentrations approached 5 ppm. The filter imple- mented a least squares linear fit to the previous one min- ute of data. Calibration of the NOx sensor was performed using exhaust gas and the CLD. Ammonia was first purged from the slipstream. For one calibration point the engine was operated at 100% load and low boost (large trapped equivalence ratio), which yields higher NOx emissions. For the other calibration point the engine was operated at 100% load and high boost (lower NOx level). Five min- ute averaged points were used. The upper and lower span concentrations of the pre-catalyst sensor were 314 ppm and 52.8 ppm. These span values corresponded to 3.15 V and 1.85 V, respectively. The post-catalyst NOx sensor was spanned between 11.6 ppm and 52.8 ppm, corre- sponding to 1.85 V and 2.83 V, respectively. Post-catalyst NOx sensor 0-5V analog communication to National Instruments equipment was set up to include negative NOx concentrations. This was done because when 0 V corresponds to 0 ppm NOx and the actual NOx concentration is 5 ppm, noise fluctuations cause much data to be lost through truncation of the 0 - 5 V analog signal. The analog signal cannot communicate negative voltage, so any part of the NOx sensor noise that is less than zero results in a zero reading, which is incorrect. Instead, 0 V was set to correspond to −50 ppm, so no data was lost in analog communication at low NOx con- centrations. 3. Results The feedforward algorithm used a constant molar ratio calculation. The ammonia injection rate is computed from the exhaust flowrate, NOx concentration, and de- sired NH3/NOx molar ratio. Figure 4 shows the feedback control algorithm loop. The feedback algorithm used feedforward calculations to create ammonia flow rate. The feedback algorithm provided an updated NH3/NOx molar ratio to the feedforward algorithm. The parameter space velocity is used in this study. It is proportional to exhaust flowrate and inverse residence time. Space ve- locity is computed by dividing the standard volumetric flowrate by catalyst envelop volume. 3.1. Feedforward Control Testing To test the feedforward control algorithm, a set of tran- Ex haust Flow Rate NOx Concentration Ammoniato NOxMolar Ratio Ammoni a InjectionRate Catalyst, Re duc e s NOx andAmmonia CeramicNOx Sens o r, Respondstothesumof NOxandammonia Fee dba c k Sign a l Signal Minimization Technique Figure 4. Flow diagram of the feedba ck algorithm. sient flow conditions was imposed. There were three transitions: 1) at 1.0 hour is a step transition in which space velocity, pre catalyst NOx, and catalyst tempera- ture were increased from 7000 1/hr, 50 ppm, and 500˚F [533 K] to 10,000 1/hr, 150 ppm, and 525˚F [547 K], respectively; 2) at 1.5 hours, a step transition of space velocity, pre-catalyst NOx, and catalyst temperature from 10,000 1/hr, 150 ppm, and 525˚F [547 K], to 13,000 1/hr, 200 ppm, and 550˚F [561 K] , respectively; and 3) a slow transition, starting at hour two, in which space velocity, pre-catalyst NOx, and catalyst temperature were reduced from 13,0001/hr, 200 ppm, and 550˚F [561 K], to 7000 1/hr, 50 ppm, and 500˚F [533 K], linearly over the dura- tion of two hours. This test map was designed to repre- sent loading and unloading of an industrial, natural gas engine. Figure 5 shows actual space velocity, tempera- ture, and pre-catalyst NOx variables throughout the point. Space velocity followed the two step inputs and the ramp down closely throughout the point. This was because space velocity was controlled by the slipstream, inde- pendent of engine exhaust flow. Catalyst temperature did not reach the objective due to slow heat exchanger re- sponse and varying engine exhaust temperature from NOx control adjustments. Temperature oscillated on the ramp down, and did not stabilize at 500˚F [533 K] at the end of the data point. NOx varied significantly from the objective. NOx was adjusted manually by changing en- gine boost, which changed trapped air/fuel ratio. The transitions in Figure 5 are good representations of in-field catalyst operation and provide a good test for the feedforward algorithm. Figure 6 shows the results of the feedforward control test for the transients shown in Figure 5. When ammonia feed was turned on, NOx reduction approached 60%, and ammonia slip approached 2 - 3 ppm. This is because ammonia feed rate was too low. Low ammonia feed rate is an error that can be explained by ceramic NOx sensor pressure compensation. Ceramic NOx sensors are sensi- tive to pressure changes, but the sensors used in this ap- plication were not pressure compensated. The sensors were calibrated at 10,000 1/hr space velocity, and initial Copyright © 2011 SciRes. EPE 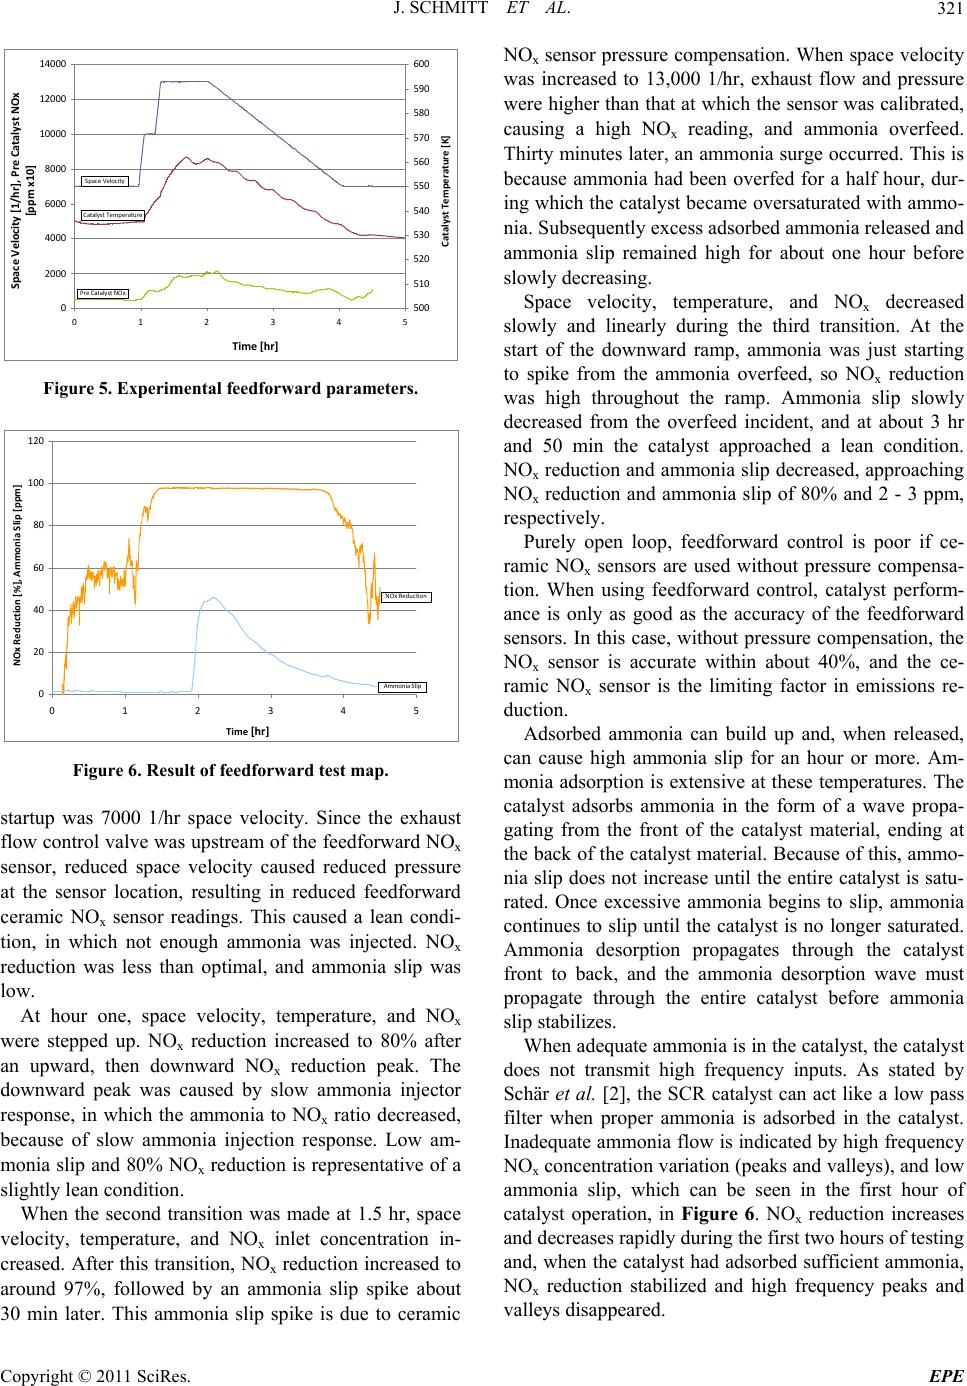 J. SCHMITT ET AL.321 0 2000 4000 6000 8000 10000 12000 14000 012345 Time[hr] SpaceVelocity[1/hr], PreCatalystNOx [ppm x10] 500 510 520 530 540 550 560 570 580 590 600 CatalystTemperature[K] CatalystTemperature SpaceVelocity PreCatalystNOx Figure 5. Experimental feedforward parameters. 0 20 40 60 80 100 120 012345 Time [hr] NOxReduction[%],AmmoniaSlip[ppm] NOxReduction AmmoniaSlip Figure 6. Result of feedforward test map. startup was 7000 1/hr space velocity. Since the exhaust flow control valve was upstream of the feedforward NOx sensor, reduced space velocity caused reduced pressure at the sensor location, resulting in reduced feedforward ceramic NOx sensor readings. This caused a lean condi- tion, in which not enough ammonia was injected. NOx reduction was less than optimal, and ammonia slip was low. At hour one, space velocity, temperature, and NOx were stepped up. NOx reduction increased to 80% after an upward, then downward NOx reduction peak. The downward peak was caused by slow ammonia injector response, in which the ammonia to NOx ratio decreased, because of slow ammonia injection response. Low am- monia slip and 80% NOx reduction is representative of a slightly lean condition. When the second transition was made at 1.5 hr, space velocity, temperature, and NOx inlet concentration in- creased. After this transition, NOx reduction increased to around 97%, followed by an ammonia slip spike about 30 min later. This ammonia slip spike is due to ceramic NOx sensor pressure compensation. When space velocity was increased to 13,000 1/hr, exhaust flow and pressure were higher than that at which the sensor was calibrated, causing a high NOx reading, and ammonia overfeed. Thirty minutes later, an ammonia surge occurred. This is because ammonia had been overfed for a half hour, dur- ing which the catalyst became oversaturated with ammo- nia. Subsequently excess adsorbed ammonia released and ammonia slip remained high for about one hour before slowly decreasing. Space velocity, temperature, and NOx decreased slowly and linearly during the third transition. At the start of the downward ramp, ammonia was just starting to spike from the ammonia overfeed, so NOx reduction was high throughout the ramp. Ammonia slip slowly decreased from the overfeed incident, and at about 3 hr and 50 min the catalyst approached a lean condition. NOx reduction and ammonia slip decreased, approaching NOx reduction and ammonia slip of 80% and 2 - 3 ppm, respectively. Purely open loop, feedforward control is poor if ce- ramic NOx sensors are used without pressure compensa- tion. When using feedforward control, catalyst perform- ance is only as good as the accuracy of the feedforward sensors. In this case, without pressure compensation, the NOx sensor is accurate within about 40%, and the ce- ramic NOx sensor is the limiting factor in emissions re- duction. Adsorbed ammonia can build up and, when released, can cause high ammonia slip for an hour or more. Am- monia adsorption is extensive at these temperatures. The catalyst adsorbs ammonia in the form of a wave propa- gating from the front of the catalyst material, ending at the back of the catalyst material. Because of this, ammo- nia slip does not increase until the entire catalyst is satu- rated. Once excessive ammonia begins to slip, ammonia continues to slip until the catalyst is no longer saturated. Ammonia desorption propagates through the catalyst front to back, and the ammonia desorption wave must propagate through the entire catalyst before ammonia slip stabilizes. When adequate ammonia is in the catalyst, the catalyst does not transmit high frequency inputs. As stated by Schär et al. [2], the SCR catalyst can act like a low pass filter when proper ammonia is adsorbed in the catalyst. Inadequate ammonia flow is indicated by high frequency NOx concentration variation (peaks and valleys), and low ammonia slip, which can be seen in the first hour of catalyst operation, in Figure 6. NOx reduction increases and decreases rapidly during the first two hours of testing and, when the catalyst had adsorbed sufficient ammonia, NOx reduction stabilized and high frequency peaks and valleys disappeared. Copyright © 2011 SciRes. EPE 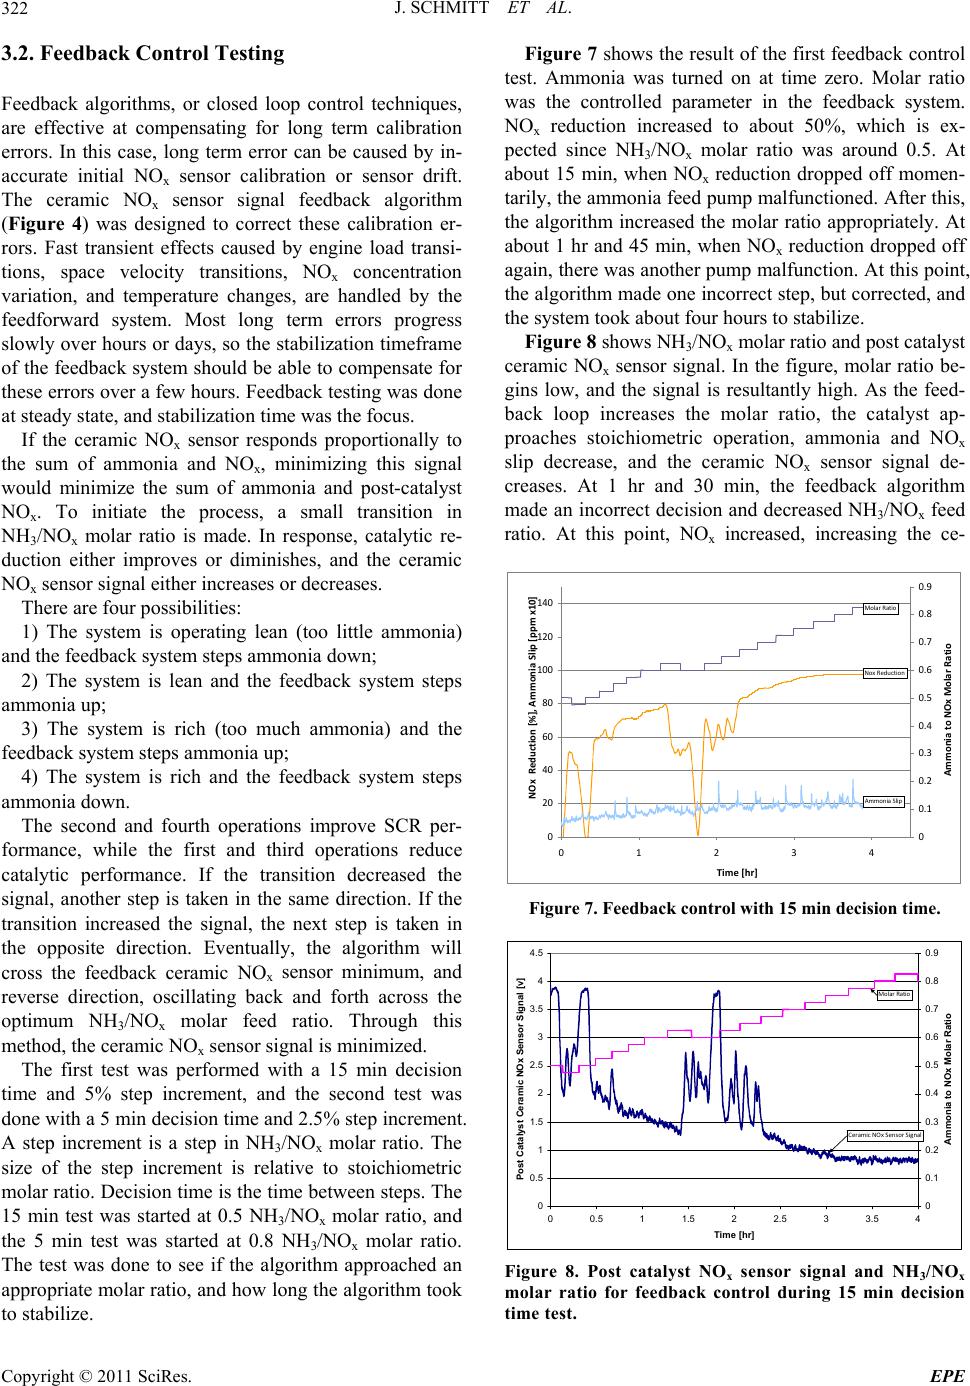 J. SCHMITT ET AL. 322 3.2. Feedback Control Testing Feedback algorithms, or closed loop control techniques, are effective at compensating for long term calibration errors. In this case, long term error can be caused by in- accurate initial NOx sensor calibration or sensor drift. The ceramic NOx sensor signal feedback algorithm (Figure 4) was designed to correct these calibration er- rors. Fast transient effects caused by engine load transi- tions, space velocity transitions, NOx concentration variation, and temperature changes, are handled by the feedforward system. Most long term errors progress slowly over hours or days, so the stabilization timeframe of the feedback system should be able to compensate for these errors over a few hours. Feedback testing was done at steady state, and stabilization time was the focus. If the ceramic NOx sensor responds proportionally to the sum of ammonia and NOx, minimizing this signal would minimize the sum of ammonia and post-catalyst NOx. To initiate the process, a small transition in NH3/NOx molar ratio is made. In response, catalytic re- duction either improves or diminishes, and the ceramic NOx sensor signal either increases or decreases. There are four possibilities: 1) The system is operating lean (too little ammonia) and the feedback system steps ammonia down; 2) The system is lean and the feedback system steps ammonia up; 3) The system is rich (too much ammonia) and the feedback system steps ammonia up; 4) The system is rich and the feedback system steps ammonia down. The second and fourth operations improve SCR per- formance, while the first and third operations reduce catalytic performance. If the transition decreased the signal, another step is taken in the same direction. If the transition increased the signal, the next step is taken in the opposite direction. Eventually, the algorithm will cross the feedback ceramic NOx sensor minimum, and reverse direction, oscillating back and forth across the optimum NH3/NOx molar feed ratio. Through this method, the ceramic NOx sensor signal is minimized. The first test was performed with a 15 min decision time and 5% step increment, and the second test was done with a 5 min decision time and 2.5% step increment. A step increment is a step in NH3/NOx molar ratio. The size of the step increment is relative to stoichiometric molar ratio. Decision time is the time between steps. The 15 min test was started at 0.5 NH3/NOx molar ratio, and the 5 min test was started at 0.8 NH3/NOx molar ratio. The test was done to see if the algorithm approached an appropriate molar ratio, and how long the algorithm took to stabilize. Figure 7 shows the result of the first feedback control test. Ammonia was turned on at time zero. Molar ratio was the controlled parameter in the feedback system. NOx reduction increased to about 50%, which is ex- pected since NH3/NOx molar ratio was around 0.5. At about 15 min, when NOx reduction dropped off momen- tarily, the ammonia feed pump malfunctioned. After this, the algorithm increased the molar ratio appropriately. At about 1 hr and 45 min, when NOx reduction dropped off again, there was another pump malfunction. At this point, the algorithm made one incorrect step, but corrected, and the system took about four hours to stabilize. Figure 8 shows NH3/NOx molar ratio and post catalyst ceramic NOx sensor signal. In the figure, molar ratio be- gins low, and the signal is resultantly high. As the feed- back loop increases the molar ratio, the catalyst ap- proaches stoichiometric operation, ammonia and NOx slip decrease, and the ceramic NOx sensor signal de- creases. At 1 hr and 30 min, the feedback algorithm made an incorrect decision and decreased NH3/NOx feed ratio. At this point, NOx increased, increasing the ce- 0 20 40 60 80 100 120 140 01234 Time[hr] NOxReduction[%],AmmoniaSlip[ppmx10] 0 0.1 0.2 0.3 0.4 0.5 0.6 0.7 0.8 0.9 AmmoniatoNOxMolarRatio NoxReduction AmmoniaSlip MolarRatio Figure 7. Feedback control with 15 min decision time. 0 0.5 1 1.5 2 2.5 3 3.5 4 4.5 00.511.522.533.54 Time [hr] Post Catalyst Ceramic NOx Sensor Signal [v] 0 0.1 0.2 0.3 0.4 0.5 0.6 0.7 0.8 0.9 Ammonia to NOx Molar Ratio CeramicNOxSensorSignal MolarRatio Figure 8. Post catalyst NOx sensor signal and NH3/NOx molar ratio for feedback control during 15 min decision time test. Copyright © 2011 SciRes. EPE  J. SCHMITT ET AL.323 ramic NOx sensor signal. The algorithm reversed its di- rection, and continued to an appropriate molar ratio. The minimization algorithm proved very effective and robust with a 15 minute decision time and a 5% incre- ment. The system approached an appropriate molar ratio, despite equipment malfunctions. The equipment mal- functions, although unplanned, displayed control algo- rithm robustness. Figure 9 shows the result of the second feedback con- trol test. In Figure 9, ammonia was turned on and NOx reduction increased to about 90%. The algorithm, at this point, made incorrect decisions, decreasing molar ratio to 0.7, until NOx reduction decreased to 85%, and the con- troller began making correct decisions. Over the course of the next hour and a half, the system increased molar ratio to somewhere between 0.8 and 0.85, and stabilized. Figure 10 shows the inputs and outputs of the feed- back algorithm during the test. In the beginning, the post catalyst ceramic NOx sensor detected a surge. This is because NOx reduction was low at the beginning of this 0 20 40 60 80 100 120 140 01 Time[hr] NOxReduction[% ],AmmoniaSlip[p pmx10] 0 0.1 0.2 0.3 0.4 0.5 0.6 0.7 0.8 0.9 Ammonia/NOxMolarRatio 2 MolarRatio NOxReduction AmmoniaSlip Figure 9. Feedback control with 5 min decision time. 0 0.5 1 1.5 2 2.5 3 3.5 4 4.5 00.25 0.5 0.7511.25 1.5 1.75 Time [hr] Post Catalyst Ceramic NOx Sensor Signal [v] 0 0.1 0.2 0.3 0.4 0.5 0.6 0.7 0.8 0.9 Ammonia to NOx Molar Ratio CeramicNOxSensorSignal MolarRatio Figure 10. Post catalyst ceramic NOx sensor signal and NH3/NOx molar ratio during five minute decision time test. data point. As ammonia feed was turned on, NOx reduc- tion dropped quickly. As the algorithm initially made incorrect decisions, the post catalyst ceramic NOx signal increased. Around 0.5 hours, the algorithm began mak- ing correct decisions. The post catalyst ceramic NOx sensor signal began decreasing. At about 1.25 hours, the system stabilized. The post catalyst ceramic NOx signal leveled, and the molar ratio control signal oscillated above and below the optimum. With a 5 min decision time and 2.5% step size, the system made incorrect decisions, but stabilized much faster than the 15 min decision time algorithm. When the system was turned on, NOx reduction increased, de- creasing the feedback signal from the ceramic NOx sen- sor. The algorithm reduced molar ratio for several steps, which was incorrect. Although the 5 min decision time is significantly faster than the 15 min decision time feed- back system, the 15 min system is fast enough to correct for sensor drift, and more robust than the 5 min system. The 15 min decision time system made very few incor- rect decisions during stabilization, whereas the 5 min decision time system made many incorrect decisions. The feedback system should ensure that long term sensor drift does not significantly affect engine emissions. Since sensor drift occurs in the timeframe of hours and days, both the 5 min and 15 min systems should be sufficiently fast. NOx reduction was around 98% on both systems at the stabilization point, while maintaining ammonia slip under 5 ppm. This shows that the control technique is very effective at ensuring the catalyst is operating prop- erly. These tests showed the algorithm response given con- stant space velocity, temperature, and NOx concentration. The tests did not test the feedback algorithm sensitivity to varying inputs. If NOx, were to increase rapidly, caus- ing rapid ammonia slip or NOx reduction transition, the feedback algorithm might respond to the varying input, as if the transition was initiated by a feedback step. More research is needed to evaluate the feedback algorithm with variable inputs. Incorporation of pressure compen- sated NOx sensors may be necessary to achieve accept- able performance with variable inputs. 4. Conclusions Control systems were developed for SCR systems to control ammonia injection flow rate. Two algorithms were experimentally evaluated. The first was a feedfor- ward control algorithm that used a ceramic NOx sensor to detect pre catalyst NOx. The second was a feedforward plus feedback algorithm which used a pre and post cata- lyst ceramic NOx sensor to generate feedforward and feedback signals, respectively. Copyright © 2011 SciRes. EPE  J. SCHMITT ET AL. Copyright © 2011 SciRes. EPE 324 The feedforward control algorithm was inaccurate following space velocity transients, because the ceramic NOx sensor was not pressure compensated. This lead to overfeeding of ammonia at high space velocities and underfeeding of ammonia at low space velocities. The feedforward plus feedback algorithm used an al- gorithm that minimized the post catalyst ceramic NOx sensor signal. This feedback technique controlled the molar ratio set point. Minimization of the post catalyst ceramic NOx sensor signal is a new approach for utiliz- ing ceramic NOx sensors that is independent of sensor calibration. This approach capitalizes on NOx sensor ammonia interference to improve SCR control. Two de- cision times were tested, a 15 min decision time and a 5 min decision time. The 15 min decision time algorithm was able to approach appropriate ammonia feed, a 40% correction, in about 4 hours at steady state feedforward conditions. The 15 min decision time algorithm was ro- bust and operated fast enough to account for sensor drift in stationary engine applications. The 5 min decision time algorithm stabilized much faster, in about 1.5 hours, but was less robust. 5. Acknowledgements This work was funded by the Pipeline Research Council International. 6. References [1] M. Chen and S. Williams, “Modeling and Optimization of SCR-Exhaust Aftertreatment Systems,” SAE Interna- tional, 2005, Article No. 2005-01-0969. [2] C. M. Schär, C. H. Onder and H. P. Geering, “Control of an SCR Catalytic Converter System for a Mobile Heavy-Duty Application,” IEEE Transactions on Control Systems Technology, Vol. 14, No. 4, 2006, pp. 641-653. doi:10.1109/TCST.2006.876634 [3] C. M. Schär, “Control of a Selective Catalytic Reduction Process,” IMRT Press c/o Institut für Messund Regeltech- nik, ETH Zentrum, 2003. [4] D. Simpson, “Precombustion Chamber Design for Emis- sions Reduction from Industrial Natural Gas Engines,” Master’s Thesis, Colorado State University, Fort Collins, 2009. [5] J. Lisowski, “Diagnostic Techniques for Precombustion Chambers in Large Bore Lean Burn Natural Gas En- gines,” Master’s Thesis, Colorado State University, Fort Collins, 2007. [6] K. Ivaturi, “Experimental and CFD Investigation of Re-agent Mixing in an SCR System,” Master’s Thesis, Colorado State University, Fort Collins, 2007. [7] T. Moosman, “FTIR Spectroscopy for 2-Stroke, Lean Burn Gas Engines Emphasizing Low-Level Detection of HAPs,” Master’s Thesis, Colorado State University, Fort Collins, 2005. |