Paper Menu >>
Journal Menu >>
 J. Biomedica doi:10.4236/jbi Published Onl Predic t durati o irradia t Sung Jang C Morristown-H a Email: sung.ch u Received 12 M a ABSTRA C A clear and dose of radi a known beca u enable to de t irradiation. A il y from ra d atomic bom b from the 'p r probabilit y i s g eneral for m tion of dose bod y irradia a g reement b e estimated L D probabilities . probabilit y i n mi g ht be hel p in j ur y , and f u Keywords: M 1. INTRO D A clear and e x of radiation a b ecause of la c termine LD 50 ysis of huma n accidents, ra d [1-9]. Van Middl e vels of 131 I fa l weapon tests reactor accid e 1954-1987 [9 - Consequen t l Science and se.2011.47063 P ine April 201 1 t ive for m o n of ex p t ion in h C hung a mblen Healthc a u ng@comcast. n a y 2011; revise d C T exact quanti t a tion and mo r u se of lack o t ermine LD5 0 A nal y sis of h u d iation accid e b victims.The d r obacent'-pro s emplo y ed i n m ula of mort a rate and du r tion in hum a e tween form u D 50 and als . The formu l n lethal radi a p ful in preve n u rther for saf e M ortality Prob a D UCTION x act quantitati a nd mortality i c k of human d for humans i n n data has b e d iotherapy an d e sworth publi s l lout in anima l and also i m e nt at Chern o - 11]. t ly, laborator y En g ineerin g, P ublished Onli n in SciRes. htt p m ulas e x p osure a h uman s a re System, Mo r n et d 5 June 2011; a t ative relatio n r talit y in hu m o f human da 0 for human s u man data ha s e nts, radioth e d eath rate eq u babilit y mo d n this stud y t o a lit y probabi l r ation of ex p a ns. There is u la-predicted o between b l as of LD50 a tion exposu r n tin g radiati o e t y in radiot h a bility; Total B ve relationshi p i n humans is s d ata that woul n total body ir r e en primarily d the atomic s hed worldwi d l thyroid glan d m mediately af t o byl during t h y animals hav e , 2011, 4, 497 - n e July 2011 (ht t p ://www.scirp. o x pressi n a nd mo r s r ristown, USA. a ccepted 17 Jun e n ship betwee m ans is still n o ta that woul s in total bo d s been prima r e rap y and t h u ation derive d el of surviv a o construct t h l ity as a fun c p osure in tot a a remarkab l and publishe b oth mortali t ans mortali t r e for huma n o n hazard an h erap y . ody Irradiatio n p between do s s till not kno w d enable to d e r adiation. Ana l from radiati o bomb victi m d e increased l e d s after nucle a t er the nucle a h e period fro m e been used t - 505 t p://www.SciRP . o rg/journal/JBi S n g relat i r tality p e 2009. n o t d dy r - h e d a l h e c - a l l e d ty ty n s d n s e w n e - l - o n m s e - a r a r m t o invest i and bi o ther to formu l Sac h avera g durati o Gomp e to the d of the G functi o sented The mathe m literat u data o f The rate, E al mo r Gomp e where Eq. total e l Weibu l Gomp e Eq. cent’- p p roba b where (abbre v to be a ‘proba and m e . org/journal/jbi s S E i onship p robabi l i gate the relat i o medical effe c possibly deri v l a expressing a h er reported c g e survival tim e o n of life [12, e rtz model se e d ata on age-s p G ompertz mo d o n of dose rat in the Sacher ’ Gompertz m o m atical expres u re that are us e f a population author repor t E q. 1 [21-23] w r tality data o f e rtz model [23 (log D D is death rat e (1) also seem l derly popula t l l and the lo g e rtz model [23 (1) was d e p robability m o b ility of a pop u P S = 10/√2π ∫ - ∞ S is percent s v iation of pro a relative biolo cent’ of 0, 50 a e an + 5 SD, re s e / ). among l ity in t o i onship betwe e c ts in total bo d v e a general p r a dose-effect c u omprehensive e s in mice irr a 13].He stated e med to be ap p p ecific death r a d el that might e of radiation ’ s article. o del (1825) is o sions among m e d to describe [18-20]. t ed that a for m w as found to b e f total elderl y ]. ) c = a + b · e , t is age; c, a ed to better f i t ion, 2001 th a g normal distri b ]. e rived from o del, Eq. (2) t h u lation [21]. P γ = A - B · lo g ∞ p exp [- (P – 5 s urvival proba b bability perce gical amount o a nd 100 corre s spectively. Th dose r a o tal bo d e n radiation e x d y irradiation, r edictive mat h u rve [1,12-17] experimental a diated daily d u in his article p roximately a p a tes. A general express death is, however, o ne of the we l m ortality mod e mortality and m ula expressi n e tter fi t the U S y population t log t and b are con s i t death rate o f a n the expone n b utions as we the author’s h at expresses g t 5 0) 2 /200] dp b ility; P is ‘p r ntage) and c o o f reserve for s s ponds to -5 S e unit of ‘pro b JBiSE a te, d y x posures and fur- h ematical . data on u ring the that the p plicable formula rate as a not p r e- l l-known e ls in the survival n g death S nation- t han the (1) s tants. f the US n tial, the ll as the ‘proba- survival (2a) (2b) r obacent’ o nsidered s urvival; D, mean b acent’ is 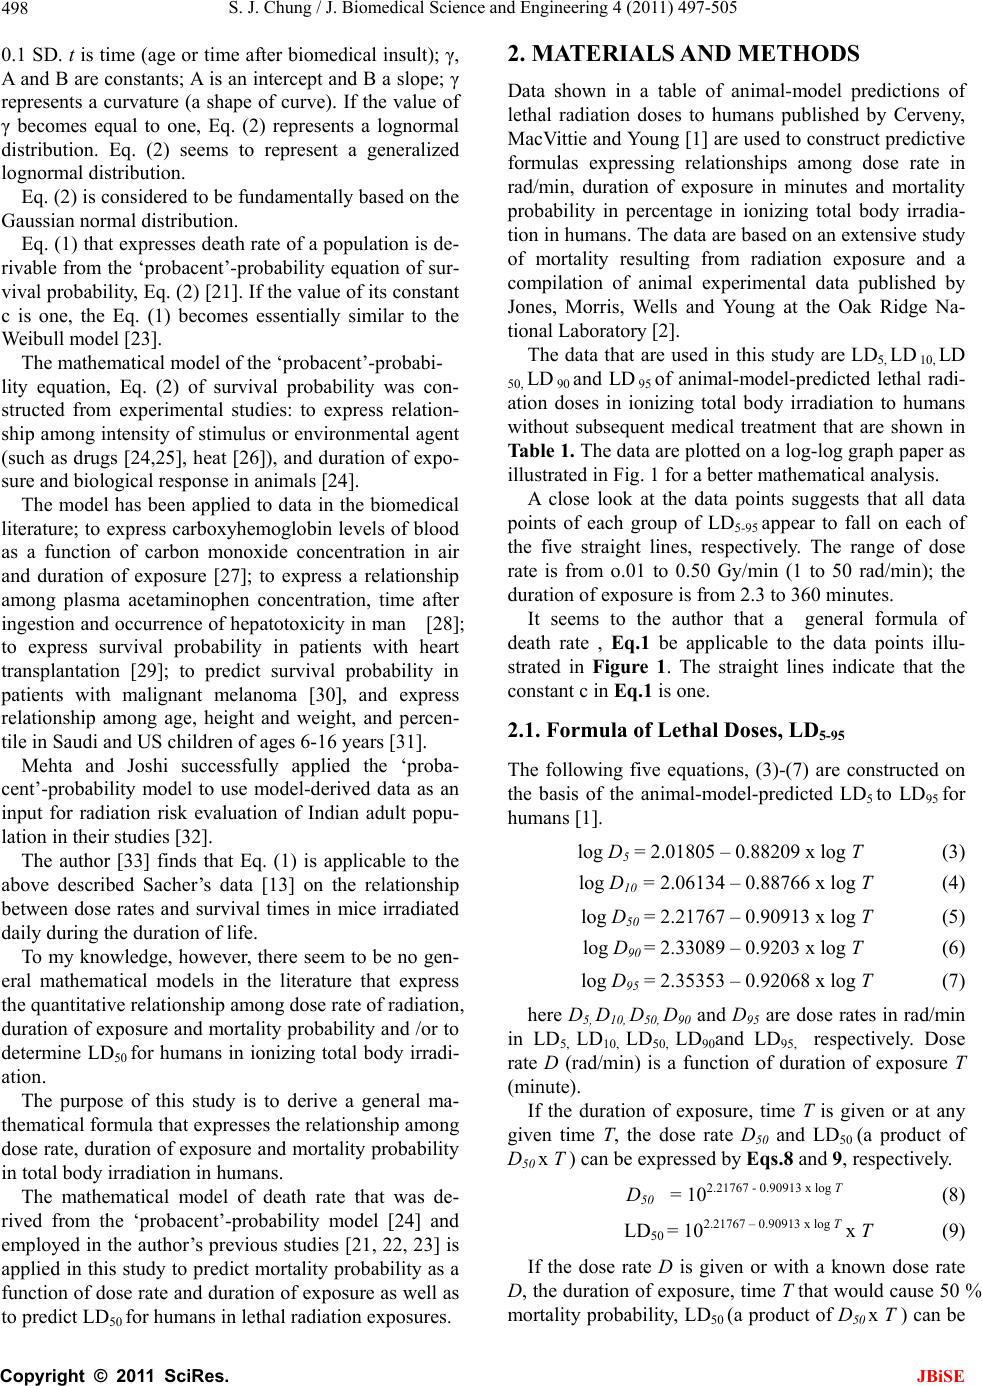 S. J. Chung / J. Biomedical Science and Engineering 4 (2011) 497-505 Copyright © 2011 SciRes. JBiSE 498 0.1 SD. t is time (age or time after biomedical insult); γ, A and B are constants; A is an intercept and B a slope; γ represents a curvature (a shape of curve). If the value of γ becomes equal to one, Eq. (2) represents a lognormal distribution. Eq. (2) seems to represent a generalized lognormal distribution. Eq. (2) is considered to be fundamentally based on the Gaussian normal distribution. Eq. (1) that expresses death rate of a population is de- rivable from the ‘probacent’-probability equation of sur- vival probability, Eq. (2) [21]. If the value of its constant c is one, the Eq. (1) becomes essentially similar to the Weibull model [23]. The mathematical model of the ‘probacent’-probabi- lity equation, Eq. (2) of survival probability was con- structed from experimental studies: to express relation- ship among intensity of stimulus or environmental agent (such as drugs [24,25], heat [26]), and duration of expo- sure and biological response in animals [24]. The model has been applied to data in the biomedical literature; to express carboxyhemoglobin levels of blood as a function of carbon monoxide concentration in air and duration of exposure [27]; to express a relationship among plasma acetaminophen concentration, time after ingestion and occurrence of hepatotoxicity in man [28]; to express survival probability in patients with heart transplantation [29]; to predict survival probability in patients with malignant melanoma [30], and express relationship among age, height and weight, and percen- tile in Saudi and US children of ages 6-16 years [31]. Mehta and Joshi successfully applied the ‘proba- cent’-probability model to use model-derived data as an input for radiation risk evaluation of Indian adult popu- lation in their studies [32]. The author [33] finds that Eq. (1) is applicable to the above described Sacher’s data [13] on the relationship between dose rates and survival times in mice irradiated daily during the duration of life. To my knowledge, however, there seem to be no gen- eral mathematical models in the literature that express the quantitative relationship among dose rate of radiation, duration of exposure and mortality probability and /or to determine LD50 for humans in ionizing total body irradi- ation. The purpose of this study is to derive a general ma- thematical formula that expresses the relationship among dose rate, duration of exposure and mortality probability in total body irradiation in humans. The mathematical model of death rate that was de- rived from the ‘probacent’-probability model [24] and employed in the author’s previous studies [21, 22, 23] is applied in this study to predict mortality probability as a function of dose rate and duration of exposure as well as to predict LD50 for humans in lethal radiation exposures. 2. MATERIALS AND METHODS Data shown in a table of animal-model predictions of lethal radiation doses to humans published by Cerveny, MacVittie and Young [1] are used to construct predictive formulas expressing relationships among dose rate in rad/min, duration of exposure in minutes and mortality probability in percentage in ionizing total body irradia- tion in humans. The data are based on an extensive study of mortality resulting from radiation exposure and a compilation of animal experimental data published by Jones, Morris, Wells and Young at the Oak Ridge Na- tional Laboratory [2]. The data that are used in this study are LD5, LD 10, LD 50, LD 90 and LD 95 of animal-model-predicted lethal radi- ation doses in ionizing total body irradiation to humans without subsequent medical treatment that are shown in Table 1. The data are plotted on a log-log graph paper as illustrated in Fig. 1 for a better mathematical analysis. A close look at the data points suggests that all data points of each group of LD5-95 appear to fall on each of the five straight lines, respectively. The range of dose rate is from o.01 to 0.50 Gy/min (1 to 50 rad/min); the duration of exposure is from 2.3 to 360 minutes. It seems to the author that a general formula of death rate , Eq.1 be applicable to the data points illu- strated in Figure 1. The straight lines indicate that the constant c in Eq.1 is one. 2.1. Formula of Lethal Doses, LD5-95 The following five equations, (3)-(7) are constructed on the basis of the animal-model-predicted LD5 to LD95 for humans [1]. log D5 = 2.01805 – 0.88209 x log T (3) log D10 = 2.06134 – 0.88766 x log T (4) log D50 = 2.21767 – 0.90913 x log T (5) log D90 = 2.33089 – 0.9203 x log T (6) log D95 = 2.35353 – 0.92068 x log T (7) here D5, D10, D50, D90 and D95 are dose rates in rad/min in LD5, LD10, LD50, LD90and LD95, respectively. Dose rate D (rad/min) is a function of duration of exposure T (minute). If the duration of exposure, time T is given or at any given time T, the dose rate D50 and LD50 (a product of D50 x T ) can be expressed by Eqs.8 and 9, respectively. D50 = 102.21767 - 0.90913 x log T (8) LD50 = 102.21767 – 0.90913 x log T x T (9) If the dose rate D is given or with a known dose rate D, the duration of exposure, time T that would cause 50 % mortality probability, LD50 (a product of D50 x T ) can be  S. J. Chung / J. Biomedical Science and Engineering 4 (2011) 497-505 Copyright © 2011 SciRes. JBiSE 499 Table 1. Comparison of Formula-derived and animal-model-predicted lethal radiation doses to humans. Lethal Dose Rate (Gy/minute) Dose 0.01 0.02 0.05 0.10 0.20 0.50 LD5 Formula- Derived * 194.0 176.9156.4 142.7 130.0 115.0 Model- Predicted ** 194 177 156 143 130 115 LD10 Formula- Derived 210.0 192.3171.3 156.9 143.8 128.0 Model- Predicted 210 192 171 157 144 128 LD50 Formula- Derived 275.0 256.6234.1 218.4 203.9 186.0 Model- Predicted 275 257 234 218 204 186 LD90 Formula- Derived 341.0 321.1296.7 279.3 263.1 243.0 Model- Predicted 341 321 297 279 263 243 LD95 Formula- Derived 360.0 339.1313.4 295.2 278.1 257.0 Model- Predicted 360 339 313 295 278 257 *Formula-derived lethal radiation doses are calculated from Eqs. (3)-(7), obtaining total doses (rad) by dose rate (rad/minute), D multiplied by duration of exposure, time T(minute). (see text). **Model-predicted lethal radiation doses are obtained from Ref- erence [1]. P > 0.995. Figure 1. Relationship among dose rate of radiation, duration of exposure and lethal radiation dose (LD5-95) in total radiation body irradiation to humans. The abscissa represents duration of exposure in minutes (log scale). The ordinate represents dose rate in rad/min (log scale). Data points indicate lethal doses of LD5-95 and appear to fall on the five formula-predicted straight lines in each group, respectively (see text).  S. J. Chung / J. Biomedical Science and Engineering 4 (2011) 497-505 Copyright © 2011 SciRes. JBiSE 500 expressed by Eqs. (10) and (11), respectively. T = 10 (1/0.90913) x (2.21767 – log D) (10) LD50 = 10(1/0.90913) x (2.21767 – log D) x D (11) Therefore, LD50 is dependent on both dose rate and duration of exposure. If the duration of exposure, time T is given as 10 or 100 minutes, dose rates that would cause 5, 10, 50, 90 and 95 % of mortality probability can be calculated by Eqs. (3)-(7), respectively as aforementioned. Table 2 shows formula-predicted relationship between dose rates, LD values, mortality probabilities or ‘probacent’ in cases of the durations of 10 or 100 minutes. Data points in those two cases are illustrated in Figure 2. ‘Probacent’ Tab le 2. Formula-predicted relationship between dose rate and mortality probability or ‘probacent’ in cases of duration of exposure, 10 and 100 minutes in total body irradiation. Duration of exposure 10 minutes 100 minutes Dose rate(rad/min) 13.714.9 20.3 25.7 27.1 1.79 1.93 2.51 3.09 3.25 Lethal dose (LD5-95) LD5LD10 LD50 LD90 LD95 LD5LD10 LD50 LD90 LD95 Mortality probability 5% 10% 50% 90% 95% 5% 10% 50% 90% 95% ‘Probacent’ (P)** 33.5537.18 50.0 62.82 66.45 33.55 37.15 50.0 62.82 66.45 Figure 2. Relationship among dose rate, mortality probability (Q) and ‘probacent’ (P) in cases of durations of exposure, times 10 and 100 minutes in total body irradiation to hu- mans. The upper abscissa represents dose rate in rad/min in case of duration of 10 minutes; the lower abscissa represents dose rate in rad/min in case of duration exposure of 100 mi- nutes, respectively. The ordinate on the right side represents percent mortality probability (Q). The ordinate on the left side represents ‘probacent’ corresponding to mortality proba- bility (Q) as shown in Table 2. Data points indicate 5, 10, 50, 90 and 95 % of mortality probabilities corresponding to LD5, LD10, LD50, LD90 and LD95. Data points of durations of exposure of 10 and 100 minutes appear to fall overall on the two straight ‘probacent’ lines, respectively (see text). 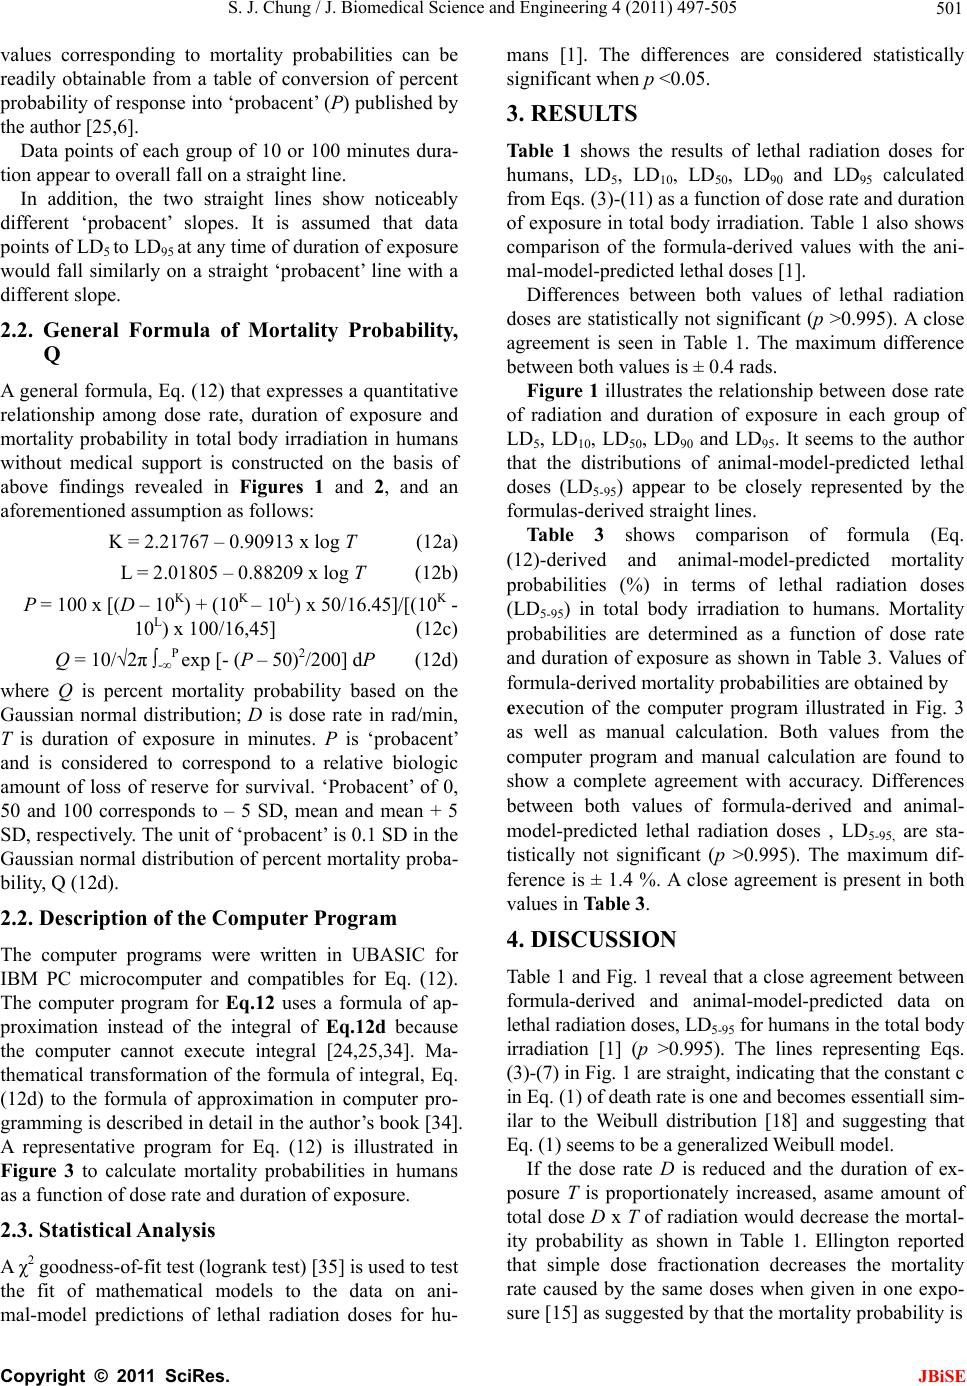 S. J. Chung / J. Biomedical Science and Engineering 4 (2011) 497-505 Copyright © 2011 SciRes. JBiSE 501 values corresponding to mortality probabilities can be readily obtainable from a table of conversion of percent probability of response into ‘probacent’ (P) published by the author [25,6]. Data points of each group of 10 or 100 minutes dura- tion appear to overall fall on a straight line. In addition, the two straight lines show noticeably different ‘probacent’ slopes. It is assumed that data points of LD5 to LD95 at any time of duration of exposure would fall similarly on a straight ‘probacent’ line with a different slope. 2.2. General Formula of Mortality Probability, Q A general formula, Eq. (12) that expresses a quantitative relationship among dose rate, duration of exposure and mortality probability in total body irradiation in humans without medical support is constructed on the basis of above findings revealed in Figures 1 and 2, and an aforementioned assumption as follows: K = 2.21767 – 0.90913 x log T (12a) L = 2.01805 – 0.88209 x log T (12b) P = 100 x [(D – 10K) + (10K – 10L) x 50/16.45]/[(10K - 10L) x 100/16,45] (12c) Q = 10/√2π ∫-∞P exp [- (P – 50)2/200] dP (12d) where Q is percent mortality probability based on the Gaussian normal distribution; D is dose rate in rad/min, T is duration of exposure in minutes. P is ‘probacent’ and is considered to correspond to a relative biologic amount of loss of reserve for survival. ‘Probacent’ of 0, 50 and 100 corresponds to – 5 SD, mean and mean + 5 SD, respectively. The unit of ‘probacent’ is 0.1 SD in the Gaussian normal distribution of percent mortality proba- bility, Q (12d). 2.2. Description of the Computer Program The computer programs were written in UBASIC for IBM PC microcomputer and compatibles for Eq. (12). The computer program for Eq.12 uses a formula of ap- proximation instead of the integral of Eq.12d because the computer cannot execute integral [24,25,34]. Ma- thematical transformation of the formula of integral, Eq. (12d) to the formula of approximation in computer pro- gramming is described in detail in the author’s book [34]. A representative program for Eq. (12) is illustrated in Figure 3 to calculate mortality probabilities in humans as a function of dose rate and duration of exposure. 2.3. Statistical Analysis A χ2 goodness-of-fit test (logrank test) [35] is used to test the fit of mathematical models to the data on ani- mal-model predictions of lethal radiation doses for hu- mans [1]. The differences are considered statistically significant when p <0.05. 3. RESULTS Table 1 shows the results of lethal radiation doses for humans, LD5, LD10, LD50, LD90 and LD95 calculated from Eqs. (3)-(11) as a function of dose rate and duration of exposure in total body irradiation. Table 1 also shows comparison of the formula-derived values with the ani- mal-model-predicted lethal doses [1]. Differences between both values of lethal radiation doses are statistically not significant (p >0.995). A close agreement is seen in Table 1. The maximum difference between both values is ± 0.4 rads. Figure 1 illustrates the relationship between dose rate of radiation and duration of exposure in each group of LD5, LD10, LD50, LD90 and LD95. It seems to the author that the distributions of animal-model-predicted lethal doses (LD5-95) appear to be closely represented by the formulas-derived straight lines. Table 3 shows comparison of formula (Eq. (12)-derived and animal-model-predicted mortality probabilities (%) in terms of lethal radiation doses (LD5-95) in total body irradiation to humans. Mortality probabilities are determined as a function of dose rate and duration of exposure as shown in Table 3. Values of formula-derived mortality probabilities are obtained by execution of the computer program illustrated in Fig. 3 as well as manual calculation. Both values from the computer program and manual calculation are found to show a complete agreement with accuracy. Differences between both values of formula-derived and animal- model-predicted lethal radiation doses , LD5-95, are sta- tistically not significant (p >0.995). The maximum dif- ference is ± 1.4 %. A close agreement is present in both values in Table 3. 4. DISCUSSION Table 1 and Fig. 1 reveal that a close agreement between formula-derived and animal-model-predicted data on lethal radiation doses, LD5-95 for humans in the total body irradiation [1] (p >0.995). The lines representing Eqs. (3)-(7) in Fig. 1 are straight, indicating that the constant c in Eq. (1) of death rate is one and becomes essentiall sim- ilar to the Weibull distribution [18] and suggesting that Eq. (1) seems to be a generalized Weibull model. If the dose rate D is reduced and the duration of ex- posure T is proportionately increased, asame amount of total dose D x T of radiation would decrease the mortal- ity probability as shown in Table 1. Ellington reported that simple dose fractionation decreases the mortality rate caused by the same doses when given in one expo- sure [15] as suggested by that the mortality probability is 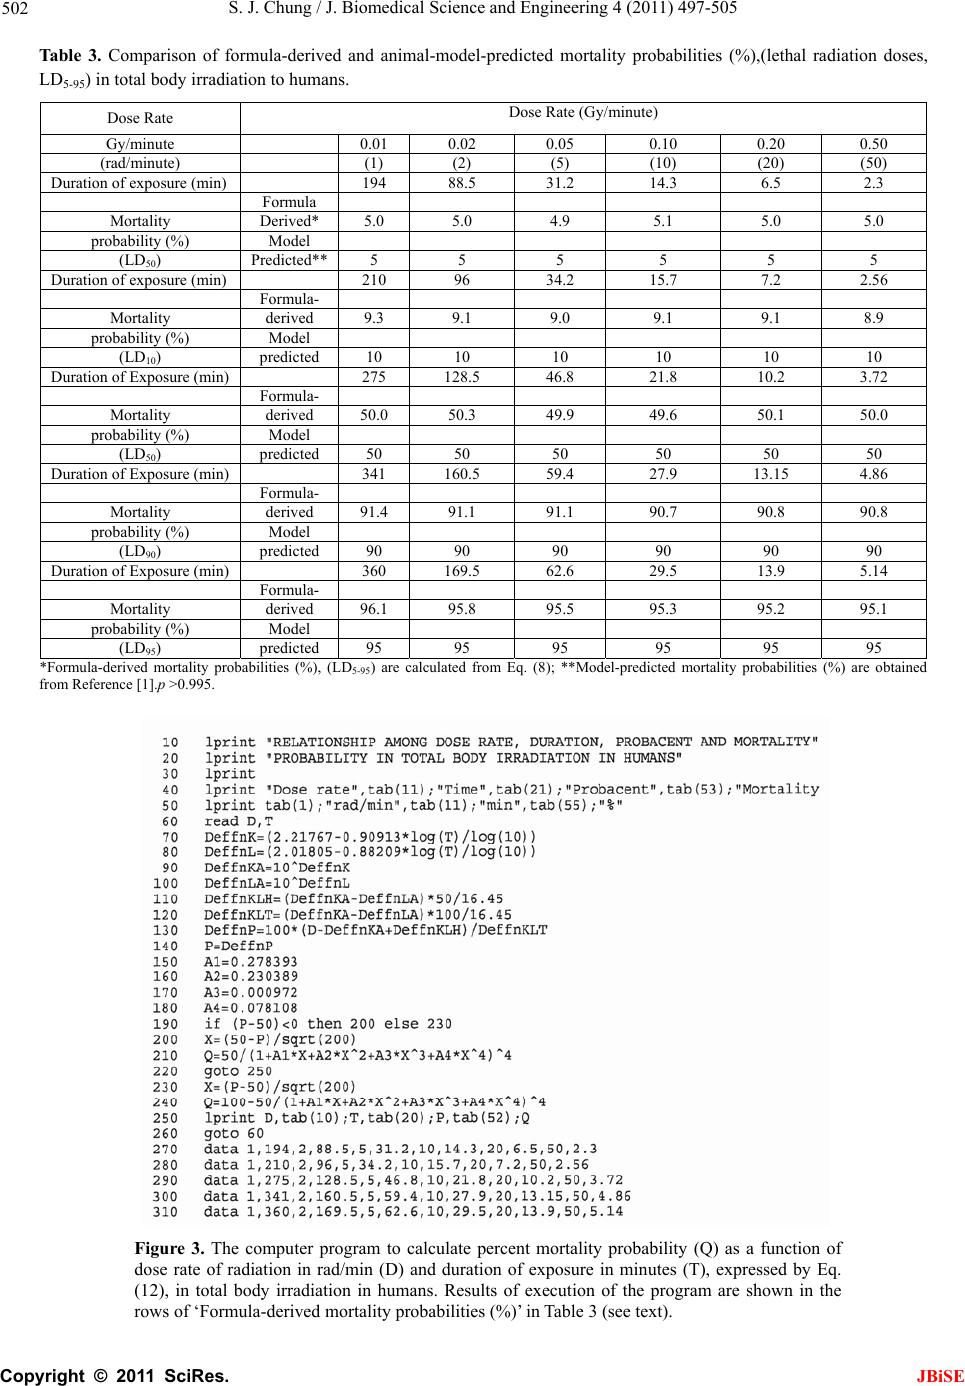 S. J. Chung / J. Biomedical Science and Engineering 4 (2011) 497-505 Copyright © 2011 SciRes. JBiSE 502 Tabl e 3. Comparison of formula-derived and animal-model-predicted mortality probabilities (%),(lethal radiation doses, LD5-95) in total body irradiation to humans. Dose Rate Dose Rate (Gy/minute) Gy/minute 0.01 0.02 0.05 0.10 0.20 0.50 (rad/minute) (1) (2) (5) (10) (20) (50) Duration of exposure (min) 194 88.5 31.2 14.3 6.5 2.3 Formula Mortality Derived* 5.0 5.0 4.9 5.1 5.0 5.0 probability (%) Model (LD50) Predicted** 5 5 5 5 5 5 Duration of exposure (min) 210 96 34.2 15.7 7.2 2.56 Formula- Mortality derived 9.3 9.1 9.0 9.1 9.1 8.9 probability (%) Model (LD10) predicted 10 10 10 10 10 10 Duration of Exposure (min) 275 128.5 46.8 21.8 10.2 3.72 Formula- Mortality derived 50.0 50.3 49.9 49.6 50.1 50.0 probability (%) Model (LD50) predicted 50 50 50 50 50 50 Duration of Exposure (min) 341 160.5 59.4 27.9 13.15 4.86 Formula- Mortality derived 91.4 91.1 91.1 90.7 90.8 90.8 probability (%) Model (LD90) predicted 90 90 90 90 90 90 Duration of Exposure (min) 360 169.5 62.6 29.5 13.9 5.14 Formula- Mortality derived 96.1 95.8 95.5 95.3 95.2 95.1 probability (%) Model (LD95) predicted 95 95 95 95 95 95 *Formula-derived mortality probabilities (%), (LD5-95) are calculated from Eq. (8); **Model-predicted mortality probabilities (%) are obtained from Reference [1].p >0.995. Figure 3. The computer program to calculate percent mortality probability (Q) as a function of dose rate of radiation in rad/min (D) and duration of exposure in minutes (T), expressed by Eq. (12), in total body irradiation in humans. Results of execution of the program are shown in the rows of ‘Formula-derived mortality probabilities (%)’ in Table 3 (see text).  S. J. Chung / J. Biomedical Science and Engineering 4 (2011) 497-505 Copyright © 2011 SciRes. JBiSE 503 a function of dose rate and duration of exposure as ex- pressed by Eq.(12). Extrapolation of the five straight lines in Fig. 1 might be possible as shown with dashed lines beyond the upper and lower ends of the lines. However, it would require further animal-model-predicted data on lethal radiation doses and relevant human data to examine the extrapolation. A quantitative dose-response relationship in lethal io- nizing radiation exposure in humans is not known [1]. Several investigators have derived hypothetical dose-response curve based on experiences with reactor accidents and the atomic exposure in Japan. From these observations, the LD50(60) for humans exposed to a single dose of radiation delivered over a period of less than 24 hours is believed to be in the range of 2.50 to 4.0 Gy (250 to 400 rads) [36]. If extrapolation is allowed and the duration of expo- sure is assumed to be 1,400 minutes (less than 24 hours), LD50 calculated from Eq. (9) will be 3.19 Gy that is in the range of 2.50 to 4.0 Gy. Levin, Young and Stohler [37] published an estimate of the median lethal dose on humans exposed to ionizing total body irradiation and not subsequently treated for radiation sickness. The median lethal dose was estimated from calculated doses to young adults who were inside two reinforced concrete buildings that remained standing in Nagasaki, Japan after the atomic detonation. Median lethal dose estimates were calculated using both loga- rithmic (2.9 Gy) and linear (3.4 Gy) dose scales. Both calculations supported previous estimates of the median lethal dose based solely on human data, which clustered around 3 Gy. The LD50 estimate, based on a log probit calculation, was 2.9 Gy to the bone marrow. The LD50 of 2.9 Gy was surprisingly consistent with estimates made by other researchers; 2.45 Gy by Langham (1967), 2.86 Gy by Lushbaugh et al. (1967), 2.65-2.70 Gy by Bond and Robertson (1957) [37]. Fujita, Kato and Schull [38] reported that the LD50(60) is 2.3-2.6 Gy on the basis on a total of 7,593 persons exposed to the atomic bombing of Hiroshima. The range of 2.3-2.6 Gy is noticeably in a good agreement with the values of LD50 shown in Table 1. Therefore, if it is taken into consideration that LD50 is a function of dose rate and duration of exposure, there seems to be a remarkable agreement between formu- la-predicted LD50 in Tables 1 and 3 and above described published-estimated LD50 for humans [36-38]. According to Tokyo Electric Power Company’s report, radiation leaking from the damaged reactors of the Fu- kushima Daiich Nuclear Power Plant caused by the 9.0 magnitude earthquake and tsunami recently hitting Japan (March 11, 2011, [40]) was 600 mSv per hour [41]. If Eq. (12) is possibly applied in this grave situation to calcu- late mortality probabilities for one hour, 25 or 10 mi- nutes of exposure to ionizing radiation, results are as follows: In one hour of exposure to radiation, mortality proba- bility (Q) = 5.295x10⁻³ %, and ‘probacent’ (P) = 8.148. In 25 minutes of exposure that was for total 250 mSv as a maximum limit dose allowed to each emergency res- cue worker, mortality probability (Q) = 1.318 x 10⁻³ %, and ‘probacent’ (P) = 3.084. In 10 minutes of exposure that was for total 100 mSv as a low dose limit allowed to each rescue worker, mortality probability (Q) = 1.063 x 10 -3 %, and ‘probacent’ (P) = 2.278 [42]. The above results might suggest a potential risk of 5-6 deaths (one-hour exposure), and 1-2 deaths (25-minutes exposure) and one death (10-minutes exposure) in 100,0000 ordinary persons exposed to radiation without clinical support, respectively. Hematopoietic cells of bone marrow, intestinal tract, and central nervous system are most vulnerable to radia- tion effects [5,8,17,39]. Body responses to lethal radia- tion effects reflect status of living body in which physi- ologic response, repair and regeneration of recovery process, pathologic changes and aging process are con- currently occurring [4,6,13,14,36,39]. Death is caused by multi-organ failure. In cases of relatively high doses, infection and hemorrhage are ear- liest contributing factors to death, resulting from the damage to the most sensitive hematopoietic cells in total body irradiation [1,13,36]. Clinical support with transfu- sion of fresh platelets and granulocytes, antibiotics, and infusion of fluids is capable of treating radiation sickness and raising LD50 [1]. 5. CONCLUSIONS A formula of death rate, Eq. (1) derived from the ‘pro- bacent’-probability equation for survival probability [21] is applied in this study to construct a general formula that expresses a quantitative relationship among dose rate of radiation, duration of exposure and mortality probability in total body irradiation in humans. The gen- eral formula, Eq. (12) is developed on the basis of the animal- model predictions of lethal radiation doses for humans published by Cerveny, MacVitte and Young [1]. The data on animal-model predictions are based on the extensive study of mortality resulting from radiation exposure and a compilation of animal experimental data published by Jones, Morris, Wells and Young [2]. The LD50 for humans is mathematically predictable as a function of dose rate and/or duration exposure. A close agreement is present between both values of formula-derived and animal-model-predicted LD50 as well as mortality probabilities. The formula-predicted  S. J. Chung / J. Biomedical Science and Engineering 4 (2011) 497-505 Copyright © 2011 SciRes. JBiSE 504 LD50 seems to remarkably agree with published esti- mates of LD50 [36-38]. The general formula, Eq. (12) might be hopefully helpful in preventing radiation ha- zard and injury, and further for safety in radiotherapy. The general formulas, Eqs. (9)-(11) and (12) that es- timates human LD50 and mortality probability are con- structed based on animal-model-predicted lethal radia- tion doses and so would need further research on animal experiments and relevant human data for their verifica- tion. 6. ABSTRACT Jones, Morris, Wells and Young at the Oak Ridge Na- tional Laboratory, Oak Ridge, Tennessee published an extensive study on mortality resulting from radiation exposure and a compilation of animal experimental data [2]. Cerveny, MacVittie and Young [1] published a table of animal-model predictions of lethal radiation doses for humans that is based on the publication of the Oak Ridge National Laboratory by Jones, Morris, Wells and Young [2]. A general formula, Eq. (12) that expresses a rela- tionship among dose rate, duration of exposure and per- cent mortality probability in total body irradiation in humans without subsequent medical treatment is con- structed on the basis of the data published by Cerveny, MacVittie and Young [1]. The LD50 for humans is ex- pressed by Eq. (9) and (11). A close agreement is present between formula-derived and animal-model-predicted mortality probabilities as well as LD50. The death rate equation (1) derived from the ‘proba- cent’-probability model of survival probability, Eq. (2) is employed in this study to construct the general formula, Eq. (12) of mortality probability as a function of dose rate and duration of exposure in total body irradiation in humans. There seems to be a remarkable agreement be- tween formula-predicted and published estimated LD50 (36-38) and also between both mortality probabilities (see Tables 1 a nd 3). The formulas, Eqs. (9)-(11), and (12) for LD50 and mortality probability in lethal radiation exposures might be hopefully helpful in preventing radiation hazard and injury, and further for safety in radiotherapy. The general formulas are constructed based on animal-model- pre- dicted lethal radiation doses for humans in this study and so would need further research on animal experiments and relevant human data for their verification. 7. KEY WORDS Total Body Irradiation, Lethal Radiation Dose, Formula of Mortality Probability, Formula of LD50 , Computer Program, Nuclear Reactor Accident, Safety in Radiothe- rapy, Radiation Hazard and Injury. 8. ACKNOWLEDGEMENT The author is thankful to Karl Friedrich Gauss, Dr. C. W. Sheppard and my teachers in mathematics, not named in my papers, for their shared knowledge that made my articles possibly published to the academic world. REFERENCES [1] T.J. Cerveny, T. J. MacVittie and R. W. Young, “Acute radiation syndrome in humans,” In: R. I. Walker and T. J. Cerveny, Ed., Medical Consequences of Nuclear Warfare, TMM Publications, Office of the Surgeon Gen- eral, Falls Church, Virginia, 1989, pp. 15-36. [2] T. J. Jones, M. D. Morris, S. M. Wells and R. W. Young, “Animal Mortality Resulting From Uniform Exposures To Photon Radiations: Calculated LD50 and a Compila- tion of Experimental Data,” Oak Ridge National Labora- tory, Oak Ridge, Tennessee, 1986. doi:10.2172/6940829 [3] J. Nénot, “Radiation accidents over the last 60 years,” Journal of Radiological Protection, Vol. 29, 2009, pp. 301-320. doi:10.1088/0952-4746/29/3/R01 [4] S. Abrahamson, M.A. Bender, R. B. Boecker, et al., “Health Effect Models for Nuclear Power Plant Accident Consequence Analysis,” US Government Printing Office, Washington, D. C. 1993. [5] E. H. Donnelly, J. B. Nemhauser, M. Smith, et al., “ Acute radiation syndrome: Assessment and manage- ment,” Southern Medical Journal, vol. 103, pp. 541-544. doi:10.1097/SMJ.0b013e3181ddd571 [6] Department of Radiology, University of Illinois, “Acute effects of whole body irradiation: Lesson from Cher- nobyl,” 1990. InternetAvailable: http//:www.uic.edu/com/uhrd/manuscript/section4/sectio n4.html [7] K. F. Baverstock, P. J. D. Ash, ”A review of radiation accidents involving whole body exposure and the relev- ance to the LD 50/60 for man,” British Journal of Radi- ology, Vol. 56, 1983, 837-849. doi:10.1259/0007-1285-56-671-837 [8] S. Warren, “The Pathology of Ionizing Radiation,” Charles C. Thomas Publisher, Springfield, 1961. [9] L. Van Middlesworth, “Worldwide iodine fallout in ani- mal thyroid, 1954-1987,” In: Radiation and the Thyroid, Excerpta Medica, Amsterdam-Prinston-Hong Kong-Tokyo-Sydney, 1989, pp. 36-56. [10] L. Van Middlesworth, “ Effects of radiation on the thy- roid gland,” Advanced Internal Medicine, Vol. 34, 1989, pp. 265-284. [11] S. L. Simon, A. Bouville and C. E. Land, “Fallout from nuclear weapons tests and cancer risks,” American Scientist, vol. 94, 2006, pp. 48-57. [12] G. A. Sacher, “On the statistical nature of mortality, with especial reference to chronic radiation mortality,” Radi- ology, Vol. 67, 1956, pp. 250-257. [13] G. A. Sacher, “On the relation of radiation lethality to radiation injury and its relevance for the prediction prob- lem,” IX th International Congress of Radiology, 23 VII-30 VII, 1959 in München, Germany, Georg Thieme Verlag, Stuttgart, 1960, pp. 1223-1232.  S. J. Chung / J. Biomedical Science and Engineering 4 (2011) 497-505 Copyright © 2011 SciRes. JBiSE 505 [14] E. L. Travis, L. G. Peters, H. D. Thames, et al., “Effect of dose-rate on total body irradiation: Lethality and patho- logic findings,” Radiotherapy and Oncology, vol. 4, 1985, pp. 341-351. doi:10.1016/S0167-8140(85)80122-5 [15] F. Ellington, “Influence of dose fractionation on the le- thal X-ray effect produced by total body irradiation in mice,” Radiology, Vol. 47, 1947, pp. 238-241. [16] D. Grahn, “Acute radiation response of mice from a cross between radio-sensitive and radio-resistant strains,” Ge- netics, Vol. 43, 1958, pp. 835-843. [17] E. A. Komarova, R. V. Kondratov, K. Wang, et al., “Dual effect of p53 on radiation sensitivity in vivo: p53 promotes hematopoietic injury, but protects from ga- stro-intestinal syndrome in mice,” Oncogene, Vol. 23, 2004, pp. 3265-3271. doi:10.1038/sj.onc.1207494 [18] E. T. Lee and J. W. Wang, “Statistical Methods for Sur- vival Data,” John Wiley & Sons, Hoboken, 2003, pp. 8-197. doi:10.1002/0471458546.ch2 [19] L. Heligman and J. H. Pollard, “The age pattern of mor- tality,” Journal of Inst. Actuaries, Vol. 107, 1980, pp. 49-80. [20] B. Gompertz, “Parametric models,” I n: Statistical Me- thods in Medical Research, Blackwell Science, Cam- bridge, 1994, pp. 482-483. [21] S. J. Chung, “Formulas expressing life expectancy, sur- vival probability and death rate in life table at various ages in US adults,” International Journal of Bio-Medical Computing, Vol. 39, 1995, pp. 209-217. doi:10.1016/0020-7101(94)01068-C [22] S. J. Chung, “Comprehensive life table of comput- er-assisted predictive mathematical relationship between age and life expectancy, survival probability or death rate in US adults,” Computer Methods and Programs in Bio- medicine, Vol. 52, 1997, pp. 67-73. doi:10.1016/S0169-2607(96)01778-6 [23] S. J. Chung, “Computer-assisted predictive formulas expressing survival probability and life expectancy in US adults, men and women, 2001,” Computer Methods and Programs in Biomedicine, Vol. 86, 2007, pp. 197-209. doi:10.1016/j.cmpb.2007.02.009 [24] S. J. Chung, “Studies on a mathematical relationship between stress and response in biological phenomena,” Rep of Korea Journal of National Academy of Sciences, Vol. 2, 1960, pp. 115-162. [25] S. J. Chung, “Computer-assisted predictive mathematical relationship among metrazol and time and mortality in mice,” Computer Methods and Programs in Biomedicine, Vol. 22, 1986, pp. 275-284. doi:10.1016/0169-2607(86)90004-0 [26] C. C. Kim and S. J. Chung, “Studies on a relationship between stress, duration of exposure and percentage of response in goldfish to single, double and triple stresses of acceleration, electroshock, heat, chemical and osmotic stimuli,” Republic of Korea Theses of Catholic Medical College, Vol. 5, 1962, pp. 257-336. [27] S. J. Chung, ”Formula expressing carboxyhemoglobin resulting from carbon monoxide exposure,” Veterinary and Human Toxicology, Vol. 30, 1988, pp. 528-532. [28] S. J. Chung, “Computer-assisted predictive mathematical relationship among plasma acetaminophen concentration and time after ingestion and occurrence of hepatotoxicity in man,” Computer Methods and Programs in Biomedi- cine, Vol. 28, 1989, pp. 37-43. doi:10.1016/0169-2607(89)90179-X [29] S. J. Chung, “Formula predicting survival probability in patients with heart transplantation,” International Journal of Biomedical Computing, Vol. 32, 1993, pp. 211-221. doi:10.1016/0020-7101(93)90015-X [30] S. J. Chung, ”Formulas expressing relationship among lesion thickness, time after diagnosis, and survival prob- ability in patients with malignant melanoma,” Interna- tional Journal of Biomedical Computing, Vol. 37, 1994, pp. 171-180. doi:10.1016/0020-7101(94)90139-2 [31] S. J. Chung, “Formulas expressing relationship among age, height and weight, and percentile in Saudi and US children of ages 6-16 years,” International Journal of Biomedical Computing, Vol. 37, 1994, pp. 259-272. doi:10.1016/0020-7101(94)90124-4 [32] S. C. Mehta and H. C. Joshi, “Model based point esti- mates of survival/death rates: An input for radiation risk evaluation in Indian context,” Indian Journal of Nuclear Medicine, Vol. 19, 2004, pp. 16-18 [33] S. J. Chung, “Predictive formulas expressing mathemati- cal relationship between dose rate of total body irradia- tion and survival time in mice,” unpublished, 2011. [34] S. J. Chung, “Seeking a New World: a New Philosophy of Confucius and Kim Hang,” iUniverse, Bloomington, 2009, pp. 69-76. [35] W. J. Dixon and F. S. Massey Jr., “χ2 test for good- ness-of-fit”, In: Introduction to Statistical Analysis, MacGraw-Hill, New York, 1957, pp. 226-227. [36] I. Damjanov and J. Linder, Ed. “Anderson’s Pathology”, 10th Edition, Mosby, New York, 1996, pp. 484-512. [37] S. G. Levin, R. W. Young and R. L. Stohler, “Estimation of median human lethal radiation dose computed from data on occupants of reinforced concrete structure in Nagasaki, Japan,” Health Physics, Vol. 63, 1992, pp. 522-531. doi:10.1097/00004032-199211000-00003 [38] S. Fujita, H. Kato and W. J. Schull, “The LD50 associated with exposure to the atomic bombing of Hiroshima,” Journal of Radiation Research (Tokyo), Vol. 30, 1989, pp. 359-381. doi:10.1269/jrr.30.359 [39] Y. Cui, H. Hisha, G. Yang, et al., “Optimal protocol for total body irradiation for allogeneic bone marrow trans- plantation in mice,” Bone Marrow Transplantation, Vol. 30, 2002, pp. 843-849. doi:10.1038/sj.bmt.1703766 [40] N. Gibbs, “The 9.0 quake that hit Japan on March 11 was powerful enough to shift the earth on its axis and make it spin a little faster, shortening the day by 1.8 millionths of a second,” Time, March 28, 2011, p. 26. [41] Donga Ilbo, “A Strong Earthquake in the East Japan”, http:// www.donga.com, March 18. 2011. [42] A. Morse, ”Behind Reactor Battle, a Legion of Grunts,” The Wall Street Journal, March 24, 2011, p. A7. |