Journal of Computer and Communications
Vol.04 No.03(2016), Article ID:64145,6 pages
10.4236/jcc.2016.43010
Investigation of Resonator BWO-Based Spectroscopy of the Atmosphere in the THz Region
Yuwen Wang1, Zhiwei Dong2,3, Xun Zhou3,4, Zhenfei Luo3,4
1Graduate School of Chinese Academy of Engineering Physics, Beijing, China
2Institute of Applied Physics and Computational Mathematics, Beijing, China
3Terahertz Research Center, Chinese Academy of Engineering Physics, Mianyang, China
4Research Center of Laser Fusion, Chinese Academy of Engineering Physics, Mianyang, China


Received 4 January 2016; accepted 26 February 2016; published 2 March 2016
ABSTRACT
This paper intends to give a code about atmospheric propagation effects affecting terahertz (THz) communication system. The main focus is on attenuation caused by atmospheric gases with the radiation transmission theory and the empirical continuum absorption based on the HITRAN database. Theoretical aspects about them are presented, emphasizing on those which deserve special attention as frequency increases. Laboratory measurements of the absorption spectra of laboratory air and major atmospheric gases mixed with water vapor in the 250 - 350 GHz frequency range at atmospheric pressure and room temperature on a basis of backward wave oscillators (BWOs) are obtained. The results of experiments are compared with the calculations. It is found that the water vapor transmittance is greater than the calculation. Data of these measurements agree with the results of analysis of atmospheric spectra with in statistical accuracy of experiments. Accurate measurements are also needed for further studies of the physics of the molecules and their interactions. The investigation makes it significant for enhancing accuracy of models of radiation propagation in the atmosphere.
Keywords:
Terahertz, Backward Wave Oscillators, Absorption Spectrum, Water Vapor

1. Introduction
THz radiation has been found more and more application owing to its interesting properties. The atmospheric propagation of THz waves depends on a large of extent on the molecular absorption by oxygen and water vapor. A number of water vapor transitions are directly used or their influence must be accounted for remote sensing of the Earth’s atmosphere from satellite, airborne and ground based techniques.
A primary obstacle to THz applications is the attenuation by the ambient atmosphere due mainly to intense rotational transitions of the water molecules. The problem has been studied theoretically by a number of authors. Much work has been performed to characterize and understand the absorption peaks of water vapor [1] [2]. In addition, a large amount of papers are devoted to experimental investigation of water vapor absorption in the terahertz regime [3] [4].
In order to test and further improve the knowledge on atmospheric propagation at THz frequencies, it is extremely important to have experimental data on the special transmission windows. In this paper, the measurements of terahertz atmospheric transmission in the range of 250 - 350 GHz frequency are carried out by BWOs under known conditions of path length, temperature, and pressure. The atmospheric absorption coefficient values are calculated using the radiation transmission model, and compared with the experimental data in the frequency region.
2. Experimental Setup
Figure 1 and Figure 2 show the schematic and photo of the experimental setup for the long-path THz transmission measurements, respectively. The backward-wave oscillator (BWO, Microtech Instruments QS1-370) used as the source generates a continuous essentially monochromatic THz wave at a frequency that can be controlled in the case of our source in the approximate range of 0.22 - 0.37 THz by the high voltage applied to the electrodes of its internal tube. The maximum THz output power is about 10 mW. The long-path gas cell is a device provided an optical path length of 33 meters, and it is connected to a mechanical pump and a H2O-N2 gas mixture source to achieve different relative humidity values. First, the output THz wave is collimated by a 2 inch focal length TPX (polymethylpentene) lens. Next the collimated THz wave passes through a chopper and then it is reflected into the long-path gas cell. The exiting THz wave is collected by an off-axis parabolic mirror and focused into a Golay cell. The data acquisition unit (DAU) is used to control the frequency output of the BWO and meanwhile collect the data from the Golay cell.
It is significant to ensure access THz wave stability at the beginning by giving the system power and preheating half an hour. Then, the THz wave, transmitted through the entire system filled with dry air, are measured. The THz wave, transmitted through the system filled with laboratory humid air, are measured. This sequence is repeated several times during the complete transmission measurement, in order to reduce the experimental error. Relative humidity and temperature were measured with traceable hydrometer/thermometer with an accuracy 5% RH and 1˚C.
3. Transmittance Calculation
The influence of atmosphere on the propagation character of THz wave can mainly fall into two categories: the scattering of the particles in the atmosphere and the absorption of atmosphere molecules, which can be divided into two aspects: line absorption and continuum absorption.

Figure 1. Schematic of the experimental setup.

Figure 2. The experiment system photo of low-frequency THz atmospheric propagation.
3.1. Line Absorption
The determined absorption depends on three parameters: center of the line, strength of the line, and line broadening. While the first parameter is well determined for all of the lines because it depends only on the molecule inner structure, the other two are much more difficult to predict because they depend on the molecule interactions.
 (1)
(1)
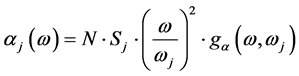
Equation (1) is the simulation of a single water vapor absorption line [5], where  is the number density in molecules/(m3),
  is the resonant line center frequency in MHz,
  is lineshape function performed in the Van Vleck-Weisskopf lineshape function [6]. The total absorption coefficient due to all of the resonant
water vapor absorption lines is shown as . the water vapor line parameters on relative humidity,
temperature and pressure are accounted for in atmospheric transmittance codes such as the high-resolution transmission molecular absorption database (HITRAN) [7].
3.2. Continuum Absorption
It has been known for a long time that the line contribution is not enough to reproduce the experimentally measured atmospheric absorption, with calculated absorption being as much as an order of magnitude too small. In order to explain the discrepancy the so-called continuum absorption is defined. The physical mechanisms of the continuum absorption are still not well explained. The water vapor continuum can be calculated using [8]
 (2)
(2)
where  and
and  are the self- and foreign-continuum coefficients,
  ,
,  is the temperature in Kelvin. The total absorption
  in all the stated models is described by a line absorption
  term and a continuum absorption
  term:
term: .
.
The absorption coefficient is done by use of the Beer-Lambert Law given in the following equation:
 (3)
(3)
The normalized transmission is shown as ,
,  is the absorption coefficient, and
  is the path length of the cell.
3.3. Absorption Spectra
Using radiosounding data from Beijing at an altitude of 32 m in 2015 (air temperature T = 298.35 K, air pressure P = 1001.3 hpa, vapor humidity ρ = 75%, oxygen density ρ = 299 g/m3), Combining HITRAN2012 database, the specific attenuation of the atmosphere at frequencies up to 1 THz due to dry air and water vapor can be evaluated at any value of pressure, temperature and humidity with the ITU-R model [9] and the model of this paper.
As shown in Figure 3, the major contributions to the total absorption in a regular medium come from the molecules of water vapor. These spectra represent the total absorption, consisting of spectral line and continuum contributions. The well known water vapor absorption peaks and oxygen absorption peaks are observed. Peaks are found around 325, 380, 448, 557, 752, 916, 970 and 987 GHz, especially the two resonances at 557 GHz and 752 GHz show very high attenuation of more than 104 dB/km. An isolated attenuation peak due to oxygen is observed at 118.75 GHz. However, outside of these resonances the diagram consists of windows with relatively low attenuations and consequently higher available bandwidths which can be used for high speed data transmissions. For the windows below 400 GHz, as the frequency is reduced the continuum absorption becomes larger than the line absorption. This situation has driven much interest in submillimeter wave applications, for which the continuum absorption is the major component.
The new model is determined and shown in Figure 3, in good agreement with the results of ITU-R model in the frequencies below 1 THz, however, using different continuum absorption parameters causes a slight deviation in the atmospheric window. As a result of this, the new model of this paper has been jointly developed with the previous model, which is valid at frequencies up to 10 THz based on HITRAN database.
4. Comparison and Discussions
Since atmospheric transmission windows exist in the lower THz frequency range, the use of frequencies above 275 GHz is one of the strong concerns among radio scientists and engineers, because these frequency bands have not yet allocated at specific applications, and there is a possibility to employ extremely large bandwidths for ultra-broadband wireless communications. The beginning development is accompanied by standardization activities addressing the lower THz range, already.
Here, we pay more attention to atmospheric propagation characteristic in the 250 - 350 GHz frequency range. Figure 4 shows a quantitative comparison of the results obtained with calculation and measurement. The plots show the transmission of terahertz radiation through air at relative humidity levels of 67% for path lengths of 33 m, temperature of 298 K and air pressures of 1atm. As can be seen in Figure 4, some of the experimental values are in good agreement with the calculated values while others are not. The absorption at the peak is somewhat higher than predicted by calculation, and that, far from the absorption lines (in the so-called transparency windows), the more experimental points lie below the theoretical curve. The average error across the data range, excluding regions of low signal to noise, is 5.3%. This discrepancy could be due to two reasons: first, no set of continuum parameters is able to exactly model the experimental spectra across the whole frequency region for all datasets; second, the measurement technique has an instrumentation distortion, each measurement has an experimental errors, and this distortion or errors must be accounted for an accurate comparison of any data.
The processing routine outlined above was applied identically to both the sample scans and the corresponding open background scans. The transmission was then calculated by normalizing the sample scans to the open background scans. Finally the transmission data was corrected to remove any distortions acquired from the range gating mathematics. Figure 5 shows a plot of the transmittance of the absorption peak between the observed and

Figure 3. Calculated atmospheric attenuation in the frequency range from 0.05 to 1 THz.

Figure 4. Comparison of atmospheric attenuation between measurement and calculation for frequencies from 250 to 350 GHz.

Figure 5. Comparison of atmospheric attenuation between measurement and calculation for frequencies from 310 to 340 GHz.
calculated spectra for the BWOs measurements in the frequency range from 310 to 340 GHz. The black plot is the original simulated spectrum while the red plot is the experimental spectrum after passing through the range gating mathematics. As can be seen in Figure 5, the predicted and measured spectra in general show very good agreement. Deviation of the calculated transmittance from the experimental ones varies with 0.5% - 3%.
5. Conclusion
Experimental atmospheric transmission data is still the most reliable source for obtaining the attenuation coefficient. The transmission spectra in the 250 - 350 GHz region are recorded using BWOs and the absorption coefficient as a function of frequency is calculated. Using a new model based on the HITRAN database, the resonant line absorption spectra and the continuum absorption are calculated. The calculated spectra obtains coincide with the result of measurements and a small discrepancy is remained owing to experimental errors. Accurate measurements are also needed for further studies of the physics of the molecules and their interactions. The analysis of the broad-band atmospheric spectra is an useful tool for both spectroscopy applications and THz communication.
Cite this paper
Yuwen Wang,Zhiwei Dong,Xun Zhou,Zhenfei Luo, (2016) Investigation of Resonator BWO-Based Spectroscopy of the Atmosphere in the THz Region. Journal of Computer and Communications,04,68-73. doi: 10.4236/jcc.2016.43010
References
- 1. Liebe, H.J. (1989) MPM—An Atmospheric Millimeter-Wave Propagation Model. International Journal of Infrared and Millimeter Waves, 10, 631-650. http://dx.doi.org/10.1007/BF01009565
- 2. Pardo, J.R., Cernicharo, J. and Serabyn, E. (2001) Atmospheric Transmission at Microwaves (ATM): An Improved Model for Millimeter/Submillimeter Applications. IEEE Transactions on Antennas and Propagation, 49, 1683-1694. http://dx.doi.org/10.1109/8.982447
- 3. Slocum, D.M., Slingerland, E.J., Giles, R.H. and Goyette, T.M. (2013) At-mospheric Absorption of Terahertz Radiation and Water Vapor Continuum Effects. Journal of Quantitative Spectroscopy and Radiative Transfer, 127, 49-63. http://dx.doi.org/10.1016/j.jqsrt.2013.04.022
- 4. Yang, Y.H., Mandehgar, M. and Grischkowsky, D. (2014) Deter-mination of the Water Vapor Continuum Absorption by THz-TDS and Molecular Response Theory. Optics Express, 22, 4388-4403. http://dx.doi.org/10.1364/OE.22.004388
- 5. Wang, Y.W., Fang, Y.Y., Dong, Z.W. and Li, H.Y. (2015) Terahertz Transmission Attenuation along the Atmospheric Slant Path. Chinese Journal of Radio Science, 30, 783-788.
- 6. Van Vleck, J.H. and Weisskopf, V.F. (1945) On the Shape of Collision-Broadened Lines. Reviews of Modern Physics, 17, 227-236. http://dx.doi.org/10.1103/RevModPhys.17.227
- 7. Rothman, L.S., Gordon, I.E., Babikov, Y., Barbe, A., Benner, D.C., Bernath, P.F. and Wagner, G. (2013) The HITRAN2012 Molecular Spectroscopic Database. Journal of Quantitative Spectroscopy and Radiative Transfer, 130, 4-50. http://dx.doi.org/10.1016/j.jqsrt.2013.07.002
- 8. Pardo, J.R., Cernicharo, J. and Serabyn, E. (2001) Submillimeter Atmospheric Transmission Measurements on Mauna Kea during Extremely Dry El Nino Conditions: Implications for Broadband Opacity Contributions. Journal of Quantitative Spectroscopy and Radiative Transfer, 68, 419-433. http://dx.doi.org/10.1016/S0022-4073(00)00034-0
- 9. Attenuation by Atmospheric Gases, International Telecommunication Union ITU-R Recommendation, Sep. 2013, pp. 676-10.