Open Journal of Social Sciences
Vol.04 No.03(2016), Article ID:64095,10 pages
10.4236/jss.2016.43005
Proactive Control Models for Gold Processing Plant Input Reagents Consumption Management. Case Study: Goldfields Ghana Limited, Tarkwa
James Obiri-Yeboah
Unit Manager-Technical, Goldfields Ghana Limited-Tarkwa Mine, Tarkwa, Ghana


Received 4 February 2016; accepted 26 February 2016; published 1 March 2016
ABSTRACT
Authentically, this case study shows that, proactive approach to resolve reagent input supply problems at the Process Plant of Goldfields Ghana Limited-Tarkwa Mine is the key to ensuring higher productive and competitive advantage in today’s business environment. Pragmatically, the cases studied revealed the existent to which reagent control models used at Goldfields Ghana Limited-Tarkwa Mine and pointed out the lack of advance warnings with regard to reagent inventory control chart, quality control model and lime consumption control method. Additionally, the minimum and maximum model application has limited control over inventory to meet abrupt changes in rate of usage. Clearly, the paper identifies lack of proactive measures in the area of limits set for taking corrective actions of the various models. Notably, the future warning signal of slope analysis depends on the focus of the given reference variables. Consequently, convergence of opposing focus variables depicts a deteriorating future while’s divergence point to a better future. Conversely, convergence of similar focus variables point to better future while as divergence indicates deteriorating future. The paper recommended applicable slope analysis approach as complementary methods to enhance proactive assessment of all the reagent control models to ensure the achievement of competitive advantage in the company’s endeavour. Cost and consumption variances analysis model was the further research work recommended by this paper as another method that will go a long way to enhance proactive reagent control at the Goldfields Ghana Limited-Tarkwa Mine Mineral Processing Plant operations.
Keywords:
reagents, control models, Consumption, Convergence and divergence

1. Introduction
Generally, input reagents for processing or production plant are resources that are put into a system to obtain a desired output. These resources include; human, financial and material input [4]. Control models for input reagent (material input) consumption management relate to strategic management systems put in place to enhance the efficient use of material input resources. Specifically, at gold processing plant, example gold processing plant at Goldfields Ghana Limited-Tarkwa Mine in Ghana, the term reagent is used to describe material input that the plant needs to generate physical and chemical reactions that lead to the extraction of the mineral of interest. Therefore, the reagents under consideration in this paper are Lime, Steel Ball, Sodium Cyanide, Caustic soda, flocculant, Hydrochloric acid, Antiscalant and fuel (diesel). Additionally, the importance of other reagents such as Borax, potassium nitrate, silica and soda ash to the extraction of gold cannot be overemphasized [6].
Clearly, the high total production cost dependency on reagent cost center, call for development of effective and proactive cost control measures to mitigate any adverse effect associated with daily use of the elements of the said cost center. In most mineral processing plant, automation is used as a measure to resolve the problem of over usage of input reagents. However, automation does not provide enough proactive measure that relates to the purity of reagents and other reactants characteristics which can introduce adverse consumption effect with resultant total cost increment. Additionally, the minimum and maximum model application has limited control over inventory to meet abrupt changes in rate of usage. The aim of this paper is to provide the needed information and tools that will close the lack of proactive measure gap existing in reagent control to enhance efficiency in reagent usage at mineral processing plants. Also, this paper seeks to develop more proactive reagent usage control methods for Goldfields Ghana Limited-Tarkwa Mine by critically looking at the existing reagent management tools and proactive elements in the various reagent control models use at the Mine. The underlining framework for this case study is the assessment of the advance warning signal associated with the applied reagent usage control models and their effects on production input stock supply turnaround time.
2. Reagent Usage at Goldfields Ghana Limited-Tarkwa Mine
Goldfields Ghana Limited, Tarkwa Mine Processing Plant is divided into communition, leaching, extractive, technical and engineering sections. The types of reagents use at the communition and leaching sections of the plant are lime, steel ball, flocculant, antiscalant, activated carbon, compressed air (oxygen) and sodium cyanide. Reagents that are used at extractive section (elution and gold-room sections of the plant) include hydrochloric acid, caustic soda, fuel (diesel), borax, potassium nitrate, silica and soda ash. The lime and steel balls are fed into the communition stream in its solid form at a budgeted consumption rate of 1092 g/t and 700 - 1000 g/t of ore milled respectively whiles flocculant and antiscalant are fed in the liquid state at a budgeted consumption rate 8 g/t and 19 g/t of ore respectively. The budgeted consumption rates for activated carbon, compressed air (oxygen) and sodium cyanide used at the leaching section are 40 g/t of ore, 10 - 20 ppm of excess oxygen in slurry and 210 g/t of ore respectively. Hydrochloric acid, caustic soda and fuel (diesel) are fed into the elution process at a consumption rate of 1160 kg/elution (15t of carbon), 1200 kg/elution (15t of carbon) and 0.256 l/t of ore respectively. Borax, potassium nitrate, silica and sodium hydroxide (soda ash) are added to dried electrowining concentrate at a consumption rate of 45%, 15%, 5% and 12% respectively. The underlining assumptions for these budget figures are based on various thumb rules and on the yearly run average actual consumptions in relation to plant design parameters [1].
Logically, the underlining assumptions provide subjective value by virtue of its failure to take care of intermittent day to day malfunctioning of respective equipment’s components and stock increment to mitigate future emergencies which may result in over usage of a given reagent. Therefore, the need for proactive and effective consumption control model cannot be overemphasized.
3. Cases of Proactive reagent consumption Control Models at Goldfields Ghana Limited-Tarkwa Mine
Proactive means acting ahead of an expected change. This involves purposefully and unswervingly changing things through the establishment of new settings or the active modification of existing ones. Basically, characteristics of proactive steps are scanning for change opportunities, setting effective change-oriented goals, anticipating and preventing problems, do things differently, take the needed action, persevere and achieve results [2] [4]. Therefore, proactive reagents consumption control models development involve scanning for adverse changes that may occur in reagents with regard to set targets and put up mitigating actions or systems that can result in a consistent resolution of the anticipated problems.
Imperatively, [8] pointed out the fundamental requirement for winners in business as leaders of upwards and downward product curves of development cycle with time whiles losers are described as fire fighters of the same product curves scenarios. This implies that control parameters of a given input resource for production should be monitored to eliminate any substandard parameter or parameters that may result in anticipated adverse effect. Hence winners in gold process business should formulate control systems or models that can enhance advance determination defective reagent parameters before usage. These parameters may be control through proactive models of inventory control chart, quality control analysis and consumption control models alongside effective supervisory monitoring. The proactive characteristics of the mentioned models or charts as well as other models are in the predictability mode that may be incorporated in a given model system. The features of reagents control models for consumption management at Goldfields Ghana Limited-Tarkwa Mine, gold processing plant are tabulated in chapter 3.1.
3.1. Features of reagents Control Models
Features of reagent control models are distinctive characteristics of logical mechanism instituted for reagent usage to regulate the level of consumption, accurately and efficiently within the set budgets [4]. Table 1, Tables 2(a)-2(e), Table 3(a) and 3(b) are extracts from Goldfields Ghana Limited-Tarkwa Mine, September, 2014 monthly metallurgical plant reports which show the various respective features required to achieve the set budgets. These extracts from the monthly reports relate to reagent inventory control model, quality control analysis charts and consumption control models.

Table 1. Daily Reagent inventory monitoring chart.
(a) (b) (c) (d) (e)
Table 2. (a) Caustic quality analysis; (b) sodium Cyanide quality analysis; (c) hydrochloric Acid quality analysis; (d) chemical Composition of steel grinding medium (Element %Wt); (e) the required hardness levels steel grinding medium.
(a) (b)
Table 3. (a) Lime consumption analysis; (b) lime average size fractions.
3.1.1. Reagent inventory control Model
Reagent inventory control model is a mechanism used in keeping the number or amount of items (unit quantity of reagent) at the optimal level in order to prevent interruption of the services that depend on the item being regulated to meet the demand rate. The importance of reagent inventory control increases with need to release surplus operating capital tied up in excessive inventories. This enhances the release of liquidity tied up in excessive inventory to finance new projects (2; 11).
From Table 1, the reagent inventory control chart depict various reagents and their respective quantity consumed daily, stock at hand (i.e. quantity at stock), Stock to last (i.e. number of days for the stock at hand to finish, if not replenish) MTD usage (month to date quantity used), MTD usage rate (month to date usage rate which is the unit consumption with reference to quantity of ore containing mineral of interest input) and stock received (i.e. the replenish quantity of the various reagent that vendors supply). Proactive pointer set from the reagent inventory control chart is seven days “stock to last” limit which stakeholders use to prompt respective venders to replenish “total stock on hand”.
3.1.2. Quality control analysis Charts
Quality control is a practice or set of measures envisioned to ensure that an industrial product or executed service sticks to a defined set of distinctive standards or meets the requirements of the client or customer [4]. Essentially, quality control system is part of inventory development process for limited resources. Quality control focus on enhancement of accuracy and reduction of uncertainty needed to establish a balance between rations for suitability and cost effectiveness [10]. Therefore, this quality control analysis seeks to achieve that balance and as well as incessant enhancement of inventory evaluations. Invariably, items (reagents) that undergo quality control checks at the Goldfields Ghana Limited-Tarkwa Mine are: caustic, sodium cyanide, hydrochloric acid (HCl) and steel balls. Samples of quality control checks done on the various mentioned reagents are shown in Tables 2(a)-2(e).
These Tables 2(a)-2(e) show the quality control measurements for caustic (sodium hydroxide), sodium cyanide, HCl (hydrochloric acid), steel ball elemental composition and steel ball hardness levels respectively. Average percentage difference of greater or less than 3% is the tolerance deviation for the purity level of sodium cyanide, caustic, hydrochloric acid and the steel ball elemental compositions. Other tolerance levels are 55 - 60 HRc, 40 - 45 HRc and 0.03 mm for surface hardness, center hardness and size tolerance respectively. Any level of quality control measurement that fall outside these given tolerance limit call for effective proactive controls by respective vendor to align the defective reagent or pay a penalty that can mitigate the loss incurred.
3.1.3. Consumption control models
Consumption control model in the context of reagent at the Goldfields Ghana Limited-Tarkwa Mine is the method of regulating the use of a given reagent in a quantity of ore (gold bearing rock) tonnage treated within a given period [4]. Basically, the independent changes in concentration resulting from the reaction between the reagents and ore provide fields of evaluating the quantity of the product and reagent (i.e. reactant) concentrations consumed, without having to isolate them from the reaction mixture. This nature of reaction between reagent and ore makes it possible to follow the amount of decreases in quantity of the reagents and resultant increases in quantity of the products. Subsequently, using this method the consumption of lime in a quantity of ore treated can be established [7]. Therefore, the rate of consumption is calculated by evaluating the quantity in a given mass unit (i.e. Kilogram-Kg or gram-g) of reagent per quantity in mass unit (i.e. tonnage-t) of ore. Lime consumption analysis shown in Table 3(a) is a typical example of a base line consumption setting for lime per the material (i.e. ore) treated from different areas, call Pit of the mine. Representative samples were taken from each pit (i.e. Teb, Akont, Kott, Undp and Akocen). Each sample was subjected to laboratory test to establish a base line consumption shown on table 3(a).
From Table 3(a), base pit lime consumptions for Teb, Akon, Ppe, Kott Undp and Akocen were given as 0.96 Kg/t, 1.02 Kg/t, 1.35 Kg/t, 0.66 Kg/t, 0.92 Kg/t and 0.82 Kg/t respectively. The base pit lime consumption is evaluated monthly from sample taken from respective pit. The total amount of lime to be consumed in a given month is evaluated from the sum of the product of various pits plan tonnages expected to be supplied and their respective base pit lime consumptions. Table 3(b) indicates finess of the lime supplied with regard to the set point of 90% cumulative passing 2.36 mm as pointer to effective dissolution (formation of lime and ore slurry homogeneous mixture) of overall end product. The proactive pointer in this model is the chart’s consumption rate which can be used to estimate the needed lime consumption ahead of a given raw material (ore) to be supplied for processing or production.
4. Analysis of the Existing Reagent control Methods
Imperatively, the extremely competitive business environment and the constantly unstable gold price in the world market, place high premium on striving to reduce production cost and cycle time in doing business. Hence, the need to use tools that have the potential of providing advance warning indicators to enhance discerning into a shift in leverages or factors of production before their occurrences are essential. The application of such tools will go a long way to curve adverse factors on production ahead of time. The advance warning indication sensitivity of an evaluation tool is a pointer to its level of proactivity. That is, proactive level of an evaluation tool is function of the timely potential of a given tool to detect occurrences, be it future adverse factor or favorable factor [8].
The timely detection potential of the existing proactive tools that are used at the Goldfields Ghana Limited- Tarkwa Mine, do not provide the needed advance warning to enhance early mitigation of future adverse factors with regards to reagent usage. Hence, the existing gap of ineffective proactive measures of reagent usage controls methods. For instance, the seven days “stock to last” limit of the reagent inventory control chart lacks the potency of giving advance warning signal that relates to rate of supply and consumption which have effect on the overall planning of the reagent inventory. Similarly, the 3% deviation limit set for quality control model shows only an instant deviation of a given reagent. It is more of postmortem examination than proactive evaluation, since the percentage purities of the various reagents are obtained after supply of goods. Though, the base line consumption indications of the various pits are good proactive pointer to the control of lime usage as advance warning of the monthly expected consumption, the size fraction which is used as check of the type of lime input being supplied, lacks the needed mode of advance warning indication to mitigate the supplier’s shortfalls in meeting the set point. Consequently, in my candid opinion, the shortfalls in the existing proactive methods can be addressed by subjecting the various given models to appropriate and applicable slope analysis models in the context of reagent usage factors that can bring out the needed advance warning insight for stakeholders’ benefit.
5. Application of Slope Analysis Ideology on the Existing reagent control Methods to Develop more Proactive enhancement methods
Generally, slope analysis relates key variables in straight line graphical trends of actual data over a period of reference points which can be extrapolated to future period to forecast an outcome. Basically, slope analysis relates the trend of one variable to another by comparing the extent of their convergence and divergence. The future warning signal of slope analysis depends on the focus of the given reference variables to indicate the level of the future results. The focus of variables in slope analysis context, relate to their enhancement of the end result of either gain or lost in an endeavour under consideration. Consequently, convergence of opposing focus variables depicts a deteriorating future while’s divergence point to a better future. On the other hand convergence of similar focus variables shows a better future while divergence point to a deteriorating future. For instance, converging and diverging gross margin analysis which determine the variation between gross margin and revenue over a period, has the two variables (gross margin and revenue) having a common focus of measuring cash inflow into a business. Therefore, the similar feature of cash inflow focus makes convergence of the slope of the two variables point unto better future whiles divergence depicts deteriorating future [8].
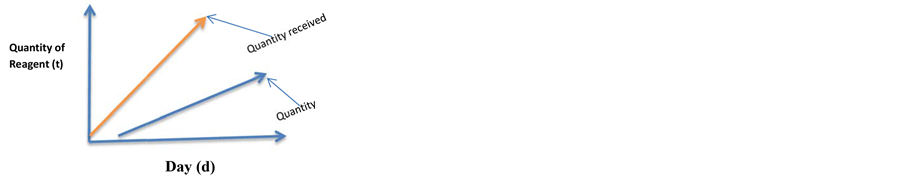
First of all, from the case of reagent inventory control model factors, the quantity consumed per day and the quantity received per day are two parameters that have the potential of exposing advance warning signal when subjected to slope analysis. This is because the variables of the two factors have opposing focus. The quantity consumed relates to the user or consumer as lost or outflow of stock and the quantity received is a gain or inflow of stock. Hence the convergence of these two variables depict deterioration whiles divergence of the two point to a favorable situation having enough stock.
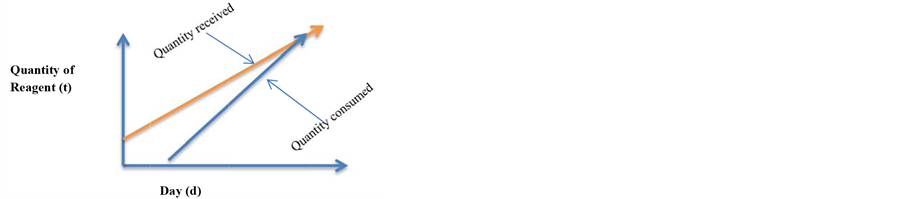
Figures 1(a) and (b) paint pictures of the possible outcomes of slope analysis on the existing reagent inventory control model under the assumption of keeping a minimum stock level 10% higher than the rate of reagent quantity usage. The divergent mode, that is Figure 1(a), points to future favorable or better scenario which means that, the consumption rate of the given reagent is lower than the rate of stock supply or replenish. Therefore, the condition of divergent mode points to a situation of having enough or surplus stock at all times. On the other hand, Figure 1(b) which is a convergent condition, points to a deficit future situation that need immediate attention to keep continuous operation. Table 4 and Figure 1(c) show the prevailing values and slope analysis mode of the reagent inventory control variables of 60 mm steel balls at time of this research.
 (a)
(a)
 (b)
(b)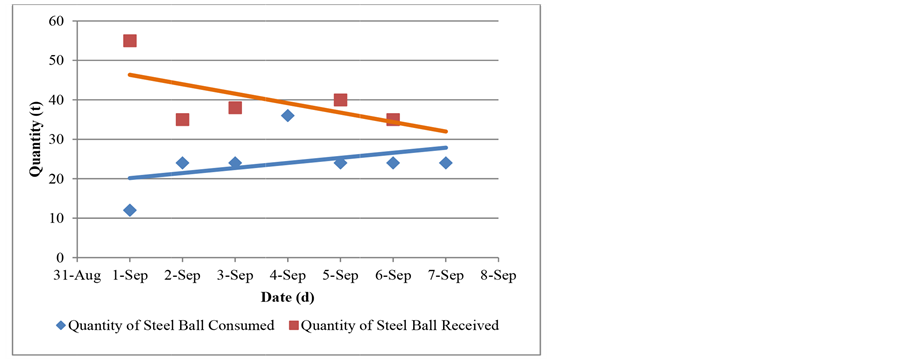 (c)
(c)
Figure 1. (a) Slope analysis of inventory control model (divergence mode) [8]; (b) slope analysis of inventory control model (convergence mode) [8]; (c) slope analysis of the weekly inventory control chart.
 (a)
(a) (b)
(b)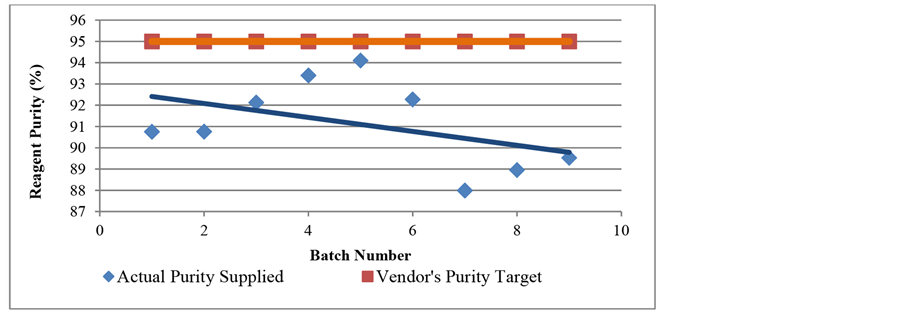 (c)
(c)
Figure 2. (a) Quality control model and lime size fraction analysis (convergence mode) [8]; (b) quality control model and Lime size fraction analysis (divergence mode) [8]; (c) slope analysis of the quality control model for sodium cyanide purity.
Table 4. Weekly 60 mm steel ball inventory control chart.
Secondly, the quality control model and lime average size fractions indicators can be given a more proactive warning by subjecting the respective factors to slope analysis which relate the vendor’s set targets to the actual purity and size fractions of the supplied stock. The two possible slopes that would be obtained from the purity
Table 5. Quality control model for sodium cyanide purity values for analysis.
and size fraction values are shown in Figures 2(a), and 2(b) under the assumption of vendor’s supply purity is acceptable limit of 5% lower than the given purity or size fraction target. Table 5 and figure 2(c) show the prevailing values and slope analysis mode of the existing quality control model for sodium Cyanide Purity model at time of this research.
6. Conclusions and Recommendations
In a nut shell the existing reagent control methods being used at Goldfields Ghana Limited-Tarkwa Mine have limitation in giving the needed advance warning signals for the required proactive actions to be taken ahead of reagent quantity shortage and low quality stock supply. One non proactive characteristic of the existing reagent control methods can be noticed in the inventory control chart limit of seven days “stock to last which lacks the potency of giving advance warning signal that relates to rate of supply and consumption. This has effect on the overall planning of the reagent inventory. Again, the 3% deviation limit set for quality control model shows only an instant deviation of a given reagent after stock supplied has been subjected to laboratory test which has long turnaround time. This places decision in the postmortem mode instead of proactive mode.
Notably, the future warning signal of slope analysis depends on the focus of the given reference variables to indicate the level of the future results. Consequently, convergence of opposing focus variables depicts a deteriorating future while’s divergence point to a better future. Conversely, convergence of similar focus variables point to better future while as divergence indicates deteriorating future. This paper therefore, recommend the use of slope analysis in addition to the Mine’s existing reagent control models to enhance proactive control in reagent usage. Again, further research work relating cost control to reagent consumption is needed to be done in order to eliminate cost effect in being over proactive.
Cite this paper
James Obiri-Yeboah, (2016) Proactive Control Models for Gold Processing Plant Input Reagents Consumption Management. Case Study: Goldfields Ghana Limited, Tarkwa. Open Journal of Social Sciences,04,25-34. doi: 10.4236/jss.2016.43005
References
- 1. Anon (2014) Monthly Report-September 2014 Production Month. Metallurgy Department-Goldfields Ghana Limited- Tarkwa Mine
- 2. Bartmann, D. and Beckmann, M. J. (1992) Inventory Control Models and Methods. http://epub.uni-regensburg.de/27256/1/ubr13608_ocr.pdf
- 3. Batema, T. and Crant, J.M. (1999) Proactive Behaviour: Meaning, Impact, Recommendations. http://homepages.se.edu/cvonbergen/files/2013/01/Proactive_Behavior-Meaning_Impact_Recommendations.pdf
- 4. Hornby, A.S. (2006) Oxford Advanced Learner’s Dictionary of Current English, Oxford University Press, UK, 1435 pp.
- 5. Kettner, P.M., Moroney, R.M. and Martin, L.L. (1990) Designing and Managing Programs: An Effectiveness-Based Approach. http://www.amazon.com/Designing-Managing-Programs-Effectiveness-Based-Sourcebooks/dp/141295
- 6. Marsden, J.O. and House, C.I. (2006) The Chemistry of Gold Extraction. 2nd Edition, The Society for Mining Metallurgy and Exploration Inc., USA, 503-651.
- 7. Namli, H. and Turhan, O. (2007) Simultaneous Observation of Reagent Con-sumption and Product Formation with the Kinetics of Benzaldehyde and Aniline Reaction in FTIR Liquid Cell. Vibra-tional Spectroscopy, 43, 274-283. http://www.sciencedirect.com/science/article/pii/S0924203106000403 http://dx.doi.org/10.1016/j.vibspec.2006.02.010
- 8. Nugent, J.H. (2003) Plan to Win: Analytical and Operational Tools-Gaining Competitive Advantage. http://www.amazon.com/Plan-Win-Analytical-Operational-Competitive/dp/0072931612/ref=sr_1_fkmr0_1?s=books&ie=UTF8&qid=1330507686&sr=1-1-fkmr0
- 9. Nugent J.H. and Gordon D, (2010) Critical Trends Tools and Issues in Telecommunications. http://books.google.com.gh/books?
- 10. Penman, J., et al. (2003) Quality Assurance and Quality Control. www.ipcc-nggip.iges.or.jp/public/gp/english/8_QA-QC.pdf
- 11. Training Manual (2008) Principles and Techniques of Managing Inventory. http://apps.who.int/medicinedocs/documents/s17396e/s17396e.pdf
- 12. Weisbrod, B.A. and Hansen, W.L. (1969) Benefits, Costs, and Finance of Public Higher Education. Markham. http://en.wikipedia.org/wiki/costbenefitanalysis