 Open Jour nal of Geol o gy, 2011, 1, 17-36 doi:10.4236/ojg.2011.12003 Published Online July 2011 (http://www.SciRP.org/journal/ojg) Copyright © 2011 Sci Res. OJG Regolith Geochemistry and Mineralogy of the Mbalam Itabirite-Hosted Iron Ore District, South Eastern Cameroon Melvin Tamnta Nforba1,2*, Veronique Kamgang Kabeyene3, Cheo Emmanuel Suh4 1Department of Eart h Sc iences, Faculty of Science, University of Yaoundé, Yaoundé, Cameroon 2Cameroon Iron Or e Company, Yaoundé, Cameroon 3Higher Teacher’s Training College (ENS), University of Yaoundé, Yaoundé Came roon 4Economi c Ge ology Unit, Department of Geol ogy and Environment al Scienc e, University of Buea, Buea, Cameroon E-mail: nforbamel@gmail.com Received May 3, 2011; revised June 5, 2011; accepted July 7, 2011 Abstract Mbalam is a major emerging iron ore district in Cameroon. The regolith over the Mbalam itabirite, consists of relict, erosion and depositional units. Itabirite rock fabric is preserved in the relict regolith, the erosion unit is marked by erosion of the carapace cap regolith, with the depositional unit dominated by canga (loose fragments of h ematite and/or itabirite cemen ted by goethite) or loo se scree. Fe concentration i ncreases from average of 46.18 wt% in the depositional soil material to as much as 79.08 wt% in the relict regolith regime with variation due to supergene weathering. Fe is the least mobile of the major elements, and the Fe oxides become significant phases and control the distributions of many elements. Absorption of P by iron oxides or oxyhydroxides appears to be the major mechanism of P retention in the different regolith environment. Au dispersion in the weathering profile occurs by two possible mechanisms (mechanical and hydromorphic) and it distribution is sporadic. Zr maintains a positive correlation with Al and Ti indicating extensive chemical weathering in the source area and resulting in a relative concentration of those residual elements. The wea- thered material show relatively high ΣREE; this is due to upward remobilisation from the lower pri mary itabi- rite, and the downward l eaching of the uppe r m ineral isa ti on hori z ons by the des cending epi ge netic s ol uti ons. Keywords: Regolith, Geochemistry, Mineralogy, Itabirite, Mbalam, Cameroon 1. Introduction As the search for ore deposits continues worldwide, the use of regolith geochemistry will play an increasingly important role in mineral explor ation [1 ]. Regolith or soil geochemistry also finds global significance in geochem- ical ma pping, development of geochemical databases and in the determination of the background composition of the soils in a region before mining activity starts. Such baseline data on regolith composition although applica- ble to exploration, are vital to monitoring pollution when the ore extraction process starts. It is against this dual background that the present study was conducted. The Mbalam iron ore district in a region of deep wea- thering is host to over 220 Mt of iron ore and is cur- rently being investigated by Sundance Resources Li- mited (www.sundanceresources.com.au). The main ore is hematite derived from itabirite (metamorphosed banded iron formation). Many studies on regolith geochemistry have been done in Australia mostly related to the older Precambrian and Archaean geological domains of the Yilgran and Gawler cratons [2-4]. In the Central African sub region and Cameroon in particular only limited studies have been done on the regolith as a tool in exploration and baseline studies. This study investigates the regolith geochemistry over weathered itabirite and hematite ore at Mbalam area, South-eastern Cameroon. The implications of the results presented to exploration and baseline studies are dis- cussed. It is envisaged that these findings may be extra- polated to a regional scale, thus providing a regional analogue for investigations of the iron deposits within the Congo Craton and elsewhere in the sub-region.  M. T. NFORBA ET AL. Copyright © 2011 Sci Res. OJG 2. Geographical and Geological Context of the Mbalam Iron ore District The Mbalam Iron ore deposit is located in the Central African Region in south eastern Cameroon at the north- ern edge of the Congo craton (Figure 1) near the frontier with the Republic of Congo. The area lies between lati- tude (UTM easting) 24500 and 24900 and longitude (UTM northing) 38200 and 38600. The Mbalam region like other areas in south eastern Cameroon is situated in the equatorial forest belt and is characterised by a humid equatorial climate but lacks traditional wet and dry seasons. There is a long dry sea- son from December to May, a light wet season from May to June, a short dry season from July to October and a heavy wet season from October to November. Annual rainfall in the region ranges from between 150 and 220 cm per year [5,6]. It experiences high temperature with mean daily temperatures averaging nearly 28˚C (82˚F) year-round while precipitation averages about 150-200 cm (80 inches) year-round. Drainage is well developed within the highly undulating topography of the region. Creeks carry torrential flows during the wet season, but are reduced to a few water holes during the dry season. Geologically, iron deposits in the Mbalam region are hosted in Archaean banded iron formations which are typical supergene hematite enrichments which have re- crystallized to ferruginous quartzite [7]. The itabirite hosted massive hematite deposits of the Mbalam region form part of the Mbalam Series, an Archean greenstone belt composed of chlorite sericite or amphibolite schists, pyroxene-bearing amphibolites and serpentinites which have been dated at 2850 Ma [8]. Similar greenstone ter- rains with BIF within the Congo Craton are also known from the High Iv indo in G abon and Nabeba in the Congo [9]. The metamorphic grade is ambiguous but probably was amphibolite facies which was subsequently over- printed by a lower grade sericite—and chlorite—bearing green schist event. The Precambrian crust in Cameroon (Figure 1) has generally been divided into an Archean cratonic base- ment underlying the southern part of the country and a Neoproterozoic mobile belt underlying the central and northern parts [10,11]. The mobile belt is dominated by Neoproterozoic (Pan-African) orthogneiss that is well documented in northern and eastern Cameroon, where deposition of volcano-sedimentary rocks occurred be- tween 830 and 700 Ma and was followed by deformation, metamorphism, and intensive plutonism between 630 and 580 Ma [9-11,15 ]. The Pan-African belt in central Africa north of the Congo Craton (CC) is the southernmost branch of the Pan-Africano-Braziliano belt [9-12]. One of the main characteristics of this regional scale structure is the presence of Pan-African granulitic rocks in Cameroon and in Central African Republic (CAR). It includes re- mobilised and re-worked pre-Pan African basement (gneiss and migmatite) as well as late Proterozoic meta- sedimentary rocks that range from low metamorphic grade up to granulite facies, and Pan African granitoids. The main geological features of the southern part of the Central African fold belt (CAFB) is the presence of D2 flat-lying foliations (as well as the granulite facies meta- morphism) that results from the late Neoproterozoic stacking of the south-verging thrust unit [12,13] and reflect a regional E-W nappe. In Cameroon, the nappes (Fig.1) include the Neoproterozoic Yaoundé group thrust onto both the Congo Craton and Nyong group, and the assumed Paleoproterozoic Bafia group thrust onto the Yaoundé group to the north [12,14]. Metaplu- tonic rocks include mafic to intermediate rocks and ser- pentinized chromatic and nickeliferous ultramafic rocks associated with gabbros, diorites and mafic dykes. Late- ritic Cu-Ni mineralisation is developed on the serpenti- nised peridotites located abou t 1000 km due north of the stud y ar e a. 3. Sampling and Analytical Methods At each soil sampling location at Mbalam, details of the landscape position were recorded including aspect, slope, relief and nature of regolith material. The basic rego- lith-landform regimes used for the geochemical sampling were interpretatively mapped as relict, erosional and de- positional after [16-18]. In the relict and erosional re- gimes, soil samples were collected between 0.2 to 0.4 m depth after discarding the humus-rich topsoil. Similar depths were used in the depositional regime. Every effort was made to minimize the potential of cross-con ta mi- nation of samples and introduction of external contami- nants during sample transportation and preparation. Drying of samples was conducted at a temperature of 120˚C overnight in a positive pressure fume cupboard in large calico bags. Splitting was conducted at a local crushing laboratory, with a dust extraction unit in opera- tion to remove fine airborne particles derived from sam- ple preparation and dust in general. All the samples re- quired pulverizing to obtain homogeneous samples for chemical analysis. Thus, samples were split in a stainless steel riffle splitter following pulverization to obtain de- sired sample for chemical analyses. All soil samples were milled in an ESSA® mill and fine pulp of 106 µm mesh size were obtained. After crushing and milling, samples were split and 50 - 60 g of samples was obtained for the various analyses. Chemical and mineralogical analysis was done using  M. T. NFORBA ET AL. 19 Copyright © 2011 Sci Res. OJG Figure 1. Map of the Study area. Insert top left shows the road map of Cameroon with an insert of the map of Africa and the geology map of South east Cameroon (top right). the pulp at ACME laboratories, Vancouver, Canada. Major elements (Si, Mg, Fe, Ca, Al, K, P, Ti, Cr) were analysed by Inductively Couple Plasma—Electro Spec- troscopy (ICP-ES) following lithium metaborate and/or tetraborate fusion and dilute nitric acid digestion on a 0.2 g of sample pulp (www.acmelab.com). Rare earth ele- ments and trace elements were analysed by Inductively Couple Plasma—Mass Spectroscopy (ICP-MS) follow- ing an identical sample digestion procedure to ICP-ES on a 0.1 g sample pulp. The remaining trace elements were  M. T. NFORBA ET AL. Copyright © 2011 Sci Res. OJG analysed by ICP-MS after 0.5 g split of sample pulp is digested in aqua regia. Loss on ignition (LOI) was de- termined by weight difference after ignition at 1000˚C; total sulphur (TOT/S) and total carbon (TOT/C) were determined by combustion analyses. Semi-qualitative mineral identification was done by X-ray powder dif- fraction analyses using a Bruckner D4endeavor X-ray generator at 40 kV and 25mA running conditions. Powd- er XRD scans were performed with the fine powder samples and run from 2 to 80˚ 2θ at a step scan of 0.020˚ 2θ and 1.00 s counting time per second. Samples for XRD analysis were taken from each of the regolith soil material to get an understanding of the element-mineral association within the regolith material prior to com- mencement of mining. 4. Results 4.1. Nature of Parent Material and the Different Weathered Regolith Regimes The itabirite shows great variation in the thickness of alternating quartz-rich and Fe-rich layering, and in over- all Fe content (Figure 2). The layering varies from sub- mm fine laminations to cm scale. In some very lean (low Fe portions), layering is more massive, with some thick beds of pale quartzite (m scale) forming large boulders. Where the layering is very fine scale it shows great stru c- tural complex ity, and it owes i ts character to strong shea r- ing and transposition. It is possible however that some of the Fe-rich itabirite was generated in fold limbs (or shear zones) by pressure solution of quartz. Hard mas- sive he- matite at Mbalam is a late epigenetic type of mineralisa- tion which forms flat-lying to gently north dipping veins up to 10 m thick or more that follow low angle brittle south-verging thrust faults. The hematite is composed of fine-grained vuggy hematite with late coarse grained sheaves of specularite inter-grown in places with quartz. The veins have selvages of early fine grained silica with pyrite cube s over grown by se condary pyrite. The relict regolith regime shows typical characteristics of development on saprolite with a cemented carapace over the relic material displaying primary structure and textures and ranging in thickness from 0.5 to 3 m. Imme- diately beneath the carapace capped relict zone, the BIF is typically strongly leached and hydrated with abundant goethite and the destruction of primary textures, but pre- servation of primary textures, hematite and quartz in- creases with depth. Minor weathering has occurred mainly on joints, fault zones, and some bedding planes to the full depth of most exposed relict material from the surface, providing good examples of the early stages of the weathering process for comparison with the fresh unweathered BIF. High grade enriched soft laminated (biscuity) ore is limited to relict an d erosional portion s of Mbarga. It is only expos ed in a few areas (due to intens e weathering and tree cover) where it is blue-black in co- lour with powdery hematite interlayered with hard hema- tite laminations on a millimeter scale. The soft ores on Mbarga are related to a very well defined plateau with deep soil and areas of laterite developed over the soft laminated ore. The laterite shows well preserved relic laminations. Locally, erosional regimes are marked by the erosion of the carapace capped relict which has exposed the un- derlying goethite zone, which typically shows a vermi- cular to massive and/or friable biscuit-like textures. This material consists of nodular to concretionary secondary goethite with minor pisoliths and botryoidal cavity lin- ings and numerous small spheroidal (vesicular) to elon- gated subcylindrical (vermicular) voids and was proba- bly formed by prolonged weathering of the exposed goethite zone. Numerous caves found within some ero- sional iron formations are mainly due to the elutriation of the fine particles by tunnel erosion along joints and bed- ding plane s, with enlargem e nt by r o of collaps e . Most of the depositional lower slopes of Mbarga Hill (Figure 3) are covered by canga (cemented hematite scree) or loose scree overlying saprolite. Patches of sil- crete consisting of bleached chert (quartzitic) fragments cemented by amorphous silica occur locally. Cavities ranging in size from a few centimeters to several meters in length are common within the weathered zone. The large cavities form partly by solution and dispersion of colloidal particles, but mainly by elutriation of friable material along joints and bedding planes, followed by collapse of the undermined regolith. They are commonly filled with a heterogeneous assortment of sand-size fria- ble quartz, silty clay, ferruginous debris, and pisoliths. 4.2 Geochemical Dispersion in the Regolith Averages for the major, trace and rare earth elements for the various regolith units are listed in Table 1. The full data set for analysed samples are presented in Appendix I. 4.3. Major And Minor Elements Oxides of three elements, Si, Fe, and Al account for the bulk of the total rock mass in the form of hematite, quartz, goethite, kaolinite and gibbsite. These elements are commonly the residual products of deep chemical weathering. Concentration of these elements varies sub- stantially in response to progressive weathering, leaching and precipitation of the secondary phases within various regolith regimes. The fresh itabirite fro m Mbalam shows  M. T. NFORBA ET AL. Copyright © 2011 Sci Res. OJG Figure 2. Itabirite outcrop at Mbalam showing alternating of quartz-rich and Fe-rich layering. Figure 3. Mbalam hills with tropical vegetation cover. Cemented or loose hematite scree on the depositional slopes of the Mbarga hill (right). mean silica concentration of 37.40 wt%. Silica concen- tration within the different weathering regimes ranges from means of 36.79 wt% in the depositional soil ma- terial to as low as 8.32 wt% within the relict soil material. During erosion and weathering of itabirite by chemical action, there is normally the leaching and dissolution of silica. The low silica value within the relict and erosional soil material indicate the high rate of supergene wea- thering with silica leaching. The sharp decrease in silica content within the relict and erosional regimes is as a remains fairly constant in the depositional regolith ma- consequence of itabirite destruction, but it increases or terial due to addition of quartz, possibly from colluvial material. Fe concentration increases from average of 46.18 wt% in the depositional soil material to as much as 79.08 wt% in the relict regolith regime with variation due to supergene weathering. Iron concentration within the Mbalam fresh itabirite from 43.88 wt% to 94.19 wt% (Appendix I) with a mean of 60.36 wt% (Table 1). Aluminium averages 1.08 wt% in the fresh itabirite, 6.84 wt% in the relict, 18.48 wt% in the erosional and8.94 wt% in the depositional regolith regimes (Table 1). The samples with high alumina values indicate high rate of alteration or decomposition of the parent itabirite rock 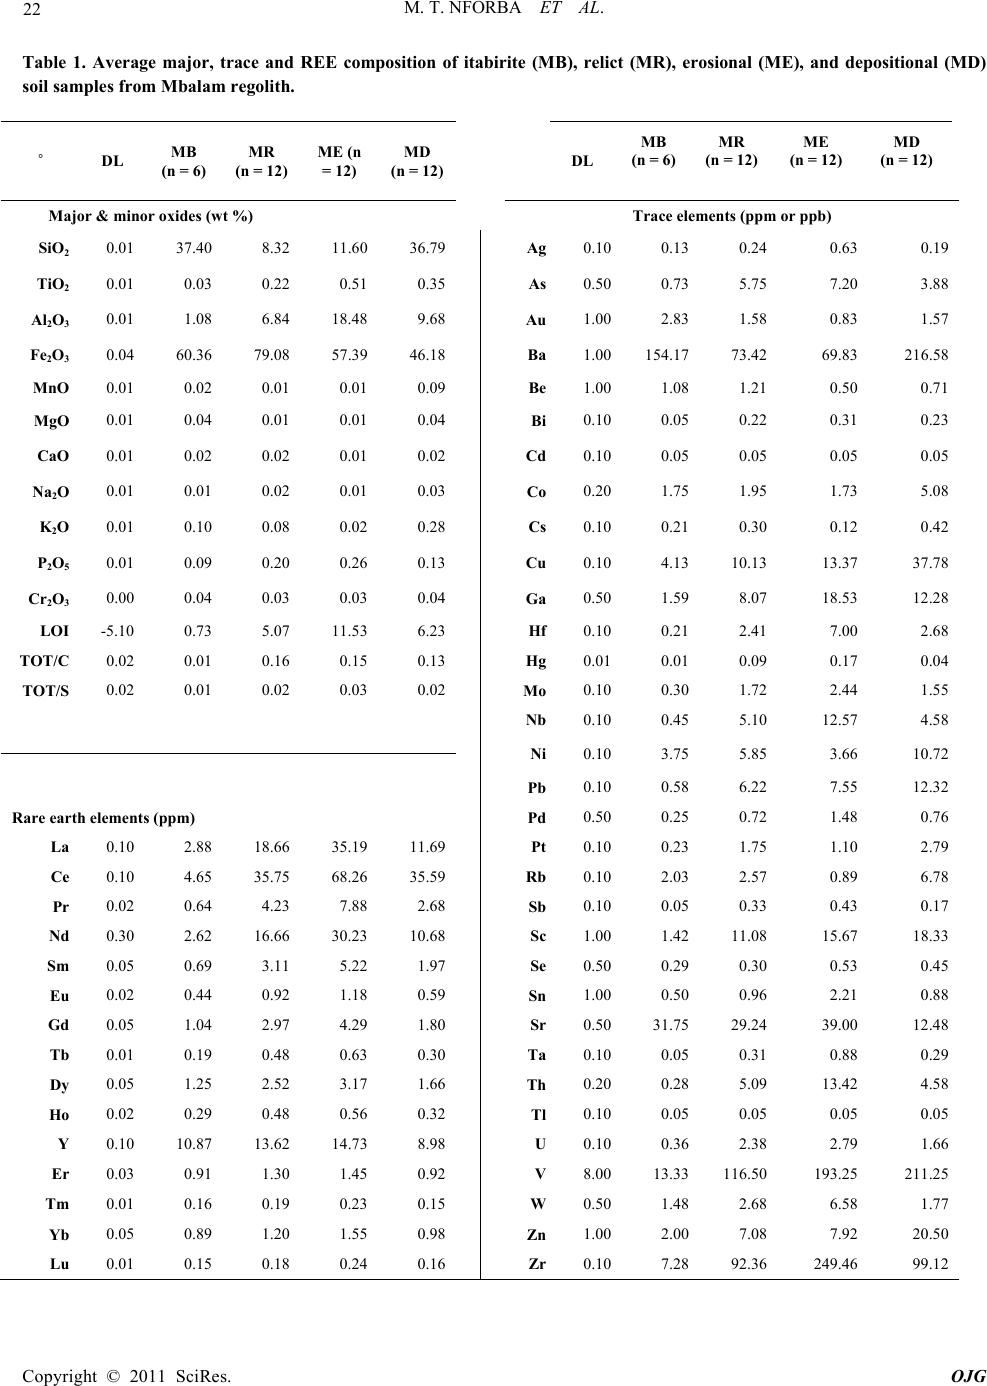 M. T. NFORBA ET AL. Copyright © 2011 Sci Res. OJG Table 1. Average major, trace and REE composition of itabirite (MB), relict (MR), erosional (ME), and depositional (MD) soil samples from Mbalam regolith. ˚ DL MB (n = 6) MR (n = 12) ME (n = 12) MD (n = 12) DL MB (n = 6) MR (n = 12) ME (n = 12) MD (n = 12) Major & minor oxides (wt %) Trace elements (ppm or ppb) SiO2 0.01 37.40 8.32 11.60 36.79 Ag 0.10 0.13 0.24 0.63 0.19 TiO2 0.01 0.03 0.22 0.51 0.35 As 0.50 0.73 5.75 7.20 3.88 Al2O3 0.01 1.08 6.84 18.48 9.68 Au 1.00 2.83 1.58 0.83 1.57 Fe2O3 0.04 60.36 79.08 57.39 46.18 Ba 1.00 154.17 73.42 69.83 216.58 MnO 0.01 0.02 0.01 0.01 0.09 Be 1.00 1.08 1.21 0.50 0.71 MgO 0.01 0.04 0.01 0.01 0.04 Bi 0.10 0.05 0.22 0.31 0.23 CaO 0.01 0.02 0.02 0.01 0.02 Cd 0.10 0.05 0.05 0.05 0.05 Na2O 0.01 0.01 0.02 0.01 0.03 Co 0.20 1.75 1.95 1.73 5.08 K2O 0.01 0.10 0.08 0.02 0.28 Cs 0.10 0.21 0.30 0.12 0.42 P2O5 0.01 0.09 0.20 0.26 0.13 Cu 0.10 4.13 10.13 13.37 37.78 Cr2O3 0.00 0.04 0.03 0.03 0.04 Ga 0.50 1.59 8.07 18.53 12.28 LOI -5.10 0.73 5.07 11.53 6.23 Hf 0.10 0.21 2.41 7.00 2.68 TOT/C 0.02 0.01 0.16 0.15 0.13 Hg 0.01 0.01 0.09 0.17 0.04 TOT/S 0.02 0.01 0.02 0.03 0.02 Mo 0.10 0.30 1.72 2.44 1.55 Nb 0.10 0.45 5.10 12.57 4.58 Ni 0.10 3.75 5.85 3.66 10.72 Pb 0.10 0.58 6.22 7.55 12.32 Rare earth elements (ppm) Pd 0.50 0.25 0.72 1.48 0.76 La 0.10 2.88 18.66 35.19 11.69 Pt 0.10 0.23 1.75 1.10 2.79 Ce 0.10 4.65 35.75 68.26 35.59 Rb 0.10 2.03 2.57 0.89 6.78 Pr 0.02 0.64 4.23 7.88 2.68 Sb 0.10 0.05 0.33 0.43 0.17 Nd 0.30 2.62 16.66 30.23 10.68 Sc 1.00 1.42 11.08 15.67 18.33 Sm 0.05 0.69 3.11 5.22 1.97 Se 0.50 0.29 0.30 0.53 0.45 Eu 0.02 0.44 0.92 1.18 0.59 Sn 1.00 0.50 0.96 2.21 0.88 Gd 0.05 1.04 2.97 4.29 1.80 Sr 0.50 31.75 29.24 39.00 12.48 Tb 0.01 0.19 0.48 0.63 0.30 Ta 0.10 0.05 0.31 0.88 0.29 Dy 0.05 1.25 2.52 3.17 1.66 Th 0.20 0.28 5.09 13.42 4.58 Ho 0.02 0.29 0.48 0.56 0.32 Tl 0.10 0.05 0.05 0.05 0.05 Y 0.10 10.87 13.62 14.73 8.98 U 0.10 0.36 2.38 2.79 1.66 Er 0.03 0.91 1.30 1.45 0.92 V 8.00 13.33 116.50 193.25 211.25 Tm 0.01 0.16 0.19 0.23 0.15 W 0.50 1.48 2.68 6.58 1.77 Yb 0.05 0.89 1.20 1.55 0.98 Zn 1.00 2.00 7.08 7.92 20.50 Lu 0.01 0.15 0.18 0.24 0.16 Zr 0.10 7.28 92.36 249.46 99.12  M. T. NFORBA ET AL. Copyright © 2011 Sci Res. OJG formation by chemical weathering. The increase in alu- mina in the erosional regolith profile (Figure 5) also reflects the abundance of clay minerals and the low solu- bility of Al2O3. The low silica concentration is due to the replacement of kaolinite by geothite during the ‘mot- tling’ process. This is reflected in the increase in goethite in such samples. The fresh itabirite from Mbalam P concentration av- erages 0.09 wt% with P2O5 mostly associated with vivia- nite and apatite. The P concentration gradually increases in the regolith, being on average 0.20 wt% P2O5 in relict, up to 0.26 wt% in the erosional zone, and 0.12 wt% P 2O5 in the depositional regime. The Mbalam itabirites are relatively Ti-poor, with a TiO2 content averaging 0.03 wt%, in the form of ilmenite. The Mbalam regolith contains on average 0.22 wt% TiO2 in relict, 0.51 w t% TiO2 in erosional and 0.33 wt% TiO 2 in depositional regolith soil. Titanium is generally im- mobile in the regolith environment, and is commonly retained in form of residual rutile after weathering of the Ti-rich primary minerals. The high concentration of Ti in the regolith is also due to the stability of secondary Fe and Ti in the soils. The alkali elements (Na2O + K2O ) ar e neither abundant in the Mbalam itabirite nor in the mod- ified regolith soils. Potassium shows slight enrichment in the depositional regimes with mean of 0.28 wt% which also reflects possible input from colluvial material. 4.4. Compa tible Trace Elements: Cr, M n, Ni, Cu, Zn, V, U, Au In the regolith environment, abundance of these compa- tible elements is determined by the stability of their sec- ondary host phases. Most of the Cr in the fresh itabirite is hosted by chromite, which is comparatively stable in the regolith. Due to its stability, Cr persists throughout the weathering process whereas Mn, Ni and Cu are mobile due to dissolution occurring in redox conditions observed during lateritic weathering. Vanadium shows residual enr ichment in all the weathering regimes. Manganese is highly mobile in the regolith, responding strongly to changing eH and pH conditions. The manganese content in the relict and erosional regimes remain similar to the least altered itabirite and high-grade ore of Mbalam but shows enrichment up to average of 0.09 wt% MnO in the depositional regolith. The enrichment of Mn in the depo- sitional regolith zone is considered to be due to precipi- tation of secondary or residual Mn oxides at the past re- dox front. Several other elements, including Co, Ni and Cu, have peak concentrations in the depositional zone and appear to have co-precipitated with or substituted in Mn oxides. Copper shows greater retention or concentra- tion (mean of 10.15 ppm) in the relict than Co (1.95 ppm); the same trend of retention for these elements is observed in the erosion and depositional regolith samples. Concentrations of these elements are low, relative to Cr and Mn, in those regimes due to poor retention as well as low primary abundances in the itabirite and high-grade ores. Nickel, Cu and Co can readily substitute for Fe in goethite, a common host for those elements in the rego- lith. The fresh itabirite shows low U content compared to the regolith regimes. U concentration ranges from mean of 0.36 ppm in the fresh itabirite to 2.79 ppm in the ero- sional zone. Gold averages 2.83 ppb in the fresh itabirite, 1.13 ppb in the relict, 0.93 ppb in the erosional and 2.55 ppb in the depositional regolith zone. The low or weak supergene enrichment of Au in the erosional material might possibly be related to the strong leaching of the most ore-related elements resulting in only subtle surface expression of Au mineralisation. 4.5. Incompatible Trace Elements The incompatible elements presented in this section in- clude Nb, Zr, Ta, Hf, Ba, Sr and rare earth elements (REE). The Mbalam least altered itabirite contains av- erage concentration of 0.45 ppm Nb, most of which is likely hosted in Ti-rich minerals s uch as ilmenite or rutile (Figure 4(a)). Niobium concentrations increase sharply in the relict and peak in the erosional zone (average of 12.56 ppm). In the depo sitional regime, Nb concentr ation is lower than in the erosional zone, probably due to dilu- tion by quartz and secondary goethite precipitation. Tan- talum shows strong correlation with Nb, maintaining the least altered itabirite Nb/Ta ratio throughout the regolith zones (Figure 4(b)). Zirconium and Hf in the itabirite are hosted mostly in Ti-bearing minerals most likely zircon. In the Mbalam regolith, Zr and Hf maintain their least altered rock ratio and show a strong correlation with TiO2 except in the depositional zone possibly from the input of zircon from colluvial or detrital material (Figures 4(c) and (d)). Barium and Sr have highest concentrations in the least altered itabirite samples with averages of 31.75 ppm and 154.16 ppm respectively, and progressively leached in the different regolith regimes with the exception of the erosional regime where the concentration of Sr (average 39 ppm) is greater than the average of the least altered itabirite. Enrichment patterns of La, Ce, Sm and other REE in the Mbalam regolith are very similar to that of Ti and associated Nb, Ta and Zr. The REE patterns show sig- nificant enrichment in Eu in the depositional profile (Figure 5) although Eu anomalies are obvious in the erosional. Alkali elements (Rb, Cs ) show higher conce n- trations in the depositional material and s lightly depleted  M. T. NFORBA ET AL. Copyright © 2011 Sci Res. OJG in the relict and erosional regimes which is consistent with their high solubility and high mobility. Yttrium and Ho occur in the trivalent oxidation state and have nearly identical ionic radii. Accordingly, both elements should display coherent geochemical behaviour but this is not the case as Y is highly enriched compared to Ho (Table 1). The REE concentrations in the relict regime are con- sistently lower relative to the depositional zone. REE enrichment in those regolith regimes maybe due to the presence of apatite or monazite while those with low (a) (b)  M. T. NFORBA ET AL. Copyright © 2011 Sci Res. OJG (c) (d) Figure 4. (a) Plot of TiO2 against Nb for regolith materials, i.e. from relict to depositional, derived from itabirite rock; (b) Plot of Nb against Ta for regolith samples derived from Mbalam itabirite; (c) Plot of TiO2 against Zr for all regolith samples from relict to depositional samples, outlined by dashed circle, contain possibly additional Zr derived from colluvial or detrital material; (d) A similar plot of Zr against Hf for all samples. REE content may be due to the presence of allanite. Generally the itabirite show low values of Ce/ΣREE, Ce/La, and La/Yb (Figure 6) while the regolith soil show relatively high ΣREE and this might be due to the upward remobilisation from the lower primary BIF and the downward leaching of the upper mineralised horizons  M. T. NFORBA ET AL. Copyright © 2011 Sci Res. OJG Figure 5. Rare earth element plots of regolith samples normalized to Upper Crust after Taylor and McLennan (1984). Figure 6. Histogram showing the REE behaviour among the different regolith regimes. by the descending e pigeneti c s ol utions. 4.6. Mineralogy The mineralogy (element-mineral association) of th e dif- ferent regolith samples are represented by XRD patterns of Figure 7. The XRD patterns for whole-rock regolith samples from the relict regime (Figure 7 (a)) ind icate the predominance or moderate to significant presence of hematite, goethite and kaolinite with minor presence of gibbsite. Goethite and kaolinite peaks are observed to range from moderate to significant amount, indicating the high intensity of weathering of the relict regolith. Patterns from the erosional regime material show do- minance of hematite and kaolinite (Figure 7(b)) which reflect the high rate of leaching in this zone. Due to high leaching within the Mbalam regolith environment, silica occurs as a minor phase and peaks are discerned only in the depositional material. Clay minerals identified were gibbsite and kaolinite. Gibbsite was detected only as moderate in one sample from erosional materials while kaolinite occurs as minor to moderate amount in the re- lict and erosional regime but completely absent in the depositional region. The appearance of gibbsite points to extensive mineral alteration in response to weathering and it is important to note that this mineral appears in the erosional regime material. Identification of secondary minerals was difficult, because their peaks tended to be obscured by the greater peaks of the major minerals he- matite, goethite, kaolinite, and gibbsite. The XRD peaks for the erosion and depositional material are noisy, in- dicative of the abundance of amorphous contents. 5. Discussion The relict regime over the Mbalam itabirite is dominated by hematite, goethite, kaolinite and gibbsite. It shows strong leaching with preservation of primary texture or relict lamination. Quartz which is an essential component of the Mbalam itabirite is leache d relatively fast and only  M. T. NFORBA ET AL. 19 Copyright © 2011 Sci Res. OJG (a)  M. T. NFORBA ET AL. Copyright © 2011 Sci Res. OJG (b) (c) Figure 7. (a) Representative XRD patterns of relict regolith material from Mbalam. On the plots Ka refers to Kaolinite and Go refers to Goethite; (b) XRD pattern of the erosional regolith material from Mbalam. Ka = Kaolinite, Gi = Gibbsite and He = Hematite; (c) XRD pattern for Mbalam depositional regolith material.  M. T. NFORBA ET AL. 19 Copyright © 2011 Sci Res. OJG appears as disseminated minor components in the relict regime. The erosional regime typically shows a vermi- cular to massive and/or friable biscuit-like texture rich in hematite, goethite and kaolinite. The depositional por- tions are covered by canga or loose scree with patches of silcrete. Gibbsite and goethite are typical phases in the degradation process of the lateritic crust in humid cli- mate and well drained environment. The high kaolinite content in the Mbalam top soil ( Fig ure 7) sugg est that in this region, this mineral might not only be a relict from the parent rock, but also a neoformed mineral since fer- ruginization and aluminization imply a desilication process [20]. This also demonstrates that desilication is one of the dominant processes during soil development regardless of the type of bedrock [21]. As expected from weathered rocks, concentration of the major and minor elements varies substantially in response to progressive weathering, leaching and precipitation of the secondary phases within various regolith regimes. Because Fe is the least mobile of the major elements, the Fe oxides become significant phases and control the distributions of many elements. Manganese and Fe oxides and/or oxyhydrox- ides are often referred to as active trace-element sinks [22]. In the present study, the distribution of many trace elements in the regolith is control by their strong affini- ties for Mn and Fe oxides and/or oxyhydroxides. Trace elements that show a greater affinity for Mn include Co, Ni, Zn and to a lesser extent Pb. Conversely, silica, which is found in the depositional regolith, may act as a diluent to other elements [4] where it precipitate as quartz in cracks or voids. Concentrations of Ca, Na and K in the regolith products and the fresh itabirite are ex- tremely low and they are even significantly lower than those in the advanced zone [23,24]. On the contrary, concentrations of Al, Fe and Ti are higher in the regolith products (Table 1), which suggests that the chemical weathering intensity in this environment could be cata- gorised as extreme [23,24]. The P concentration or enrichment is consistent with its mobile nature in the regolith environment. The increase in P concentration from the relict to depositional regime might possibly be related to residual concentration of P as phosphate mine- ralisation. Absorption of P by iron oxides or oxyhydrox- ides is well known [4,25] and appears to be the major mechanism of P retention in the different regolith envi- ronment. Similar to Al, a slight decrease in the P content in the relict regime is related to the dilution eff ect due to goethite precipitation and detrital qua rts. Gold values in all of the weathering regimes appear to be sporadic, probably in part reflecting the low level in the fresh itabirite. However, there is a noticeable enrichment of Au in the deposition regime. Au disper- sion in the weathering profile occurs by two possible mechanisms: (1) mechanical—weathering and subse- quent erosion of the surface with lateral migration of mineralised fragments. Mechanical dispersion is particu- larly characteristic of prolonged weathering with marked seasonal variation [26] as at Mbalam, (2) hydromor- phic—dis- solution and transport of Au in solution and at Mbalam this is reflected by the high Au concentration in the de- position regimes compared to the relict and ero- sion surfaces. Within the regolith mantle, Au contents and spatial distributions or occurrences are different from the parent itabirite. This fact proves that Au distribution in the weathered regolith mantle is controlled mechani- cally, that is both by initial mechanical patterns and su- perimposed hydromorphic weathering processes. Differ- ent conclusions have been drawn for Au distribution during itabirite weathering at Maquine mine [27] where Au contents and spatial distribution in the weathering mantle was similar to the parent itabirite and the Au grains di d not present any surficial strain. Of the major and minor elements Al, Ti and Zr are generally considered the least mobile during chemical weatheri ng. Chemically one of t he dominant Zr-containing minerals, zircon, is considered to be highly mobile. In fact one of the oldest mineral found on earth is zircon [28]. Although Ti-containing minerals such as rutile or ilmenite have been used as index of weathering, those minerals appear to be relatively more susceptible to chemical weathering and leaching than Zr. Significant amounts of Ti and Zr are typ ically fixed in resistate min- erals such as zircon, rutile and ilmenite. In the Mbalam regolith, Zr maintains a positive correlation with Al and Ti indicating chemical weathering in the sou rce area and resulting in a relative concentration of those residual elements [29]. Accordingly, Al/Ti values in some depo- sitional samples are very low, indicating that these sam- ples contain more Ti than Al. This geochemical feature is attributed to the supply of detrital materials with high Ti-bearing minerals to the site of deposition, because the Ti-bearing minerals are generally associated with detrital quartz and zircon. Ti-enriched detrital materials are pos- sibly formed by Al-Ti fr actionation during: (1) exten sive chemical weathering, or (2) hydrothermal alteration of the source rocks [30] Niobium is thought of to be asso- ciated with Ti-rich minerals in the regolith profiles and this is support by its positive correlation with Ti. Tanta- lum also shows strong positive correlation with Nb, maintaining the fresh rock Nb/Ta ratio throughout the regolith (Figure 4b). Similar enrichment has been report [25] of Nb du ring tropic a l weatheri n g of kimberl ite. 6. Rare Earth Element Variations REE content and ratios are changing vertically according to the different weathering front (i.e. primary itabirite, relict, erosion and depositional). Studies [30] showed  M. T. NFORBA ET AL. Copyright © 2011 Sci Res. OJG that primary manganese ores after extensive leaching have very low Eu/Sm ratios (0.16 - 0.31). Therefore pri- mary or protolith rocks are believed to be rich in Eu, such result was observed in this study. The regolith ma- terial from this study also shows Eu enrichment (Figure 5) after supergene modification causing very high Eu/Sm ratio. Besides that, the fresh itabirite show low values of Ce/ΣREE, Ce/La and La/Yb (Figure 6). The weathered material show relatively high ΣREE; this is due to up- ward remobilisation fro m the lower primary itabirite, and the downward leaching of the upper mineralisation hori- zons by the descending epigenetic solutions [30]. The relict and erosional horizons are characterised by inter- mediate values of Ce/ΣREE, Ce/La, and low values of Eu/Sm than those of itabir ite and they exhibit the highest values of La/Yb values (Figure 6). This might be attri- buted to higher degree of modification compared with the itabirite which have lower La/Yb ratio. The low Eu/Sm values and high La enrichment in this zone indi- cate the remobilisation of primary minerals and their re-depo- sition under supergene conditions. In general from the investigation through the regolith material we noticed an upward increase in Ce, Ce/La, Ce/ΣREE, in the same time an upward decrease in Eu/Sm ratio. All those trends are in agreement w ith each other and would indicate an increasing upward remobili- sation under oxic conditions, as the upward increase of Ce/La and Ce/ΣREE ratios are good indicators for ongo- ing oxic diagenesi s . 7. Conclusions We can draw the following conclusions from this study: • The Mbalam regolith has three main un its: relict, er o- sion and deposition. Itabirite, the protolith progres- sively weathered into hematite, goethite, kaolinite, gibbsite. Quartz is minor but visually occurs as dis- seminated sugary textured fragments within the dif- ferent regolith units. • The geochemical and mineralogical investigation of the regolith material indicates that the re has been sig- nificant leaching of metals and distribution of re- maining geochemical signatures into Fe oxides. He- matite and goethite are the major hosts to major ele- ments. • Regolith material shows relatively high con centration of Ti due to the resistant nature of the residual rutile as opposed to the fresh itabirite where Ti is retained in less resistant mineral ilmenite. • In the Mbalam regolith, Zr maintains a positive cor- relation with Al and Ti indicating chemical weather- ing in the source area and resulting in a relative con- centration of those residual elements. • At Mbalam, Au distribution in the weathered regolith mantle is controlled mechanically, that is both by in i- tial mechanical patterns and superimposed hydro- morphic weathering processes. • The weathered material show relatively high ΣREE; this is due to upward remobilisation from the lower primary itabirite, and the downward leaching of the upper mineralisation horizons by the descending epi- genetic solutions. 8. Acknowledgement This article is part of PhD thesis on regolith geochemi- stry applied to mineral exploration at the University of Yaoundé I by NMT. We acknowledge the support of colleagues at the University over the years. This work was undertaken within the framework of economic ge- ology research at the University of Buea –“The Precam- brian mineral belt of Cameroon” – in collaboration with other institutions. This article benefited from reviews by Scott Keith. This and the editorial comments of the Edi- tor are highly appreciated. 9. References [1] C. R. M. Butt and R. E. Smith, “Characteristic of the Weathering Profile,” In: C. R. M. Butt, & H. Zeegers, Ed., Chapter III.3: Semiarid and arid terrains. Regolith Explo- ration Geochemistry in Tropical and Subtropical Terrains, Elsevier, Amsterdam, 1992, pp. 299-304. [2] C. R. M Butt and H. Zeegers, “Regolith Exploration Geochemistry in Tropical and Subtropical Terrains, (Handbook of Exploration Geochemistry,)” Elsevier, Amsterdam, Vol. 4, 1992, p. 607. [3] C. R. M. Butt, M. J. Linte rn, and R. R. Anand, “Evolution of Regoliths and Landscapes in Deeply Weathered Ter- rain—Implication for Geochemical Exploration,” Ore Geology Reviews, Vol. 16, No. 3-4, 2000, pp. 167-183. doi:10.1016/S0169-1368(99)00029-3 [4] M. A. Craig, “Regolith Mapping for Geochemical Ex- ploration in the Yilgran Craton, Western Australia,” Geochemistry: Exploration, Environment, Analysis, Vol. 1, 2001, pp. 383-390. doi:10.1144/geochem.1.4.383 [5] N. W. Brand, and C. R. M. Butt, “Weathering, Element Distribution and Geochemical Dispersion at Mt Keith, Western Australia: Implication for Nickel Sulphide Ex- ploration,” Geochemistry: Exploration, Environment, Ana- lysis, Vol. 1, No. 4, 2001, pp. 391-407. doi:10.1144/geochem.1.4.391 [6] G. Achoundong, “Vegetation,” In: N. Houstin and C. Seignobos, Ed., Atlas of Cameroon’ Les Éditions Jeune Afrique, Paris, 2007, pp. 64-65. [7] M. Tsaléfac, “Climate,” In: N. Houstin and C. Seignobos, Ed., Atlas of Cameroon, Les Éditions Jeune Afrique, Paris, 2007, pp. 62-63.  M. T. NFORBA ET AL. Copyright © 2011 Sci Res. OJG [8] R. J. Thomas, C. Chevalier and J.F. Makanga, “Precam- brian Geology and Metallogeny of Gabon,” Journal of African Earth Science, Vol. 28, 1999, pp. 78-79. [9] J. P. Milesi, S. F. Toteu, Y. Deschamps, J. L. Feybesse, C. Lerouge, A. Cocherie, J. Penaye, R. Tchameni, G. Moloto-A-Kenguemba, H. A. B. Kampunzu, N. Nicol, E. Duguey, J. M. Leistel, M. Saint-Martin, F. Ralay, C. Heinry, V. Bouchot, J. C. Doumnang Mbaigane, V. Kanda Kula, F. Chene, J. Monthel, P. Boutin, and J. Cailteux, “An Overview of the Geology and Major Ore Deposits of Central Africa: Explanatory Note for the 1:4,000,000 Map ‘Geology and major ore deposits of Central Africa’,” Journal of African Earth Sciences, Vol. 44, No. 4-5, 2006, pp. 571-595. doi:10.1016/j.jafrearsci.2005.10.016 [10] S. F. Toteu, W. R. Van Schmus, J. Penaye and J. B. Nyobe, “U-Pb and Sm-Nd Evidence for Eburnian and Pan-African High-Grade Metamorphism in Cratonic Rocks of Southern Cameroon,” Precambrian Research, Vol. 67, No. 3-4, 1994, pp. 321-347. doi:10.1016/0301-9268(94)90014-0 [11] S. F. Toteu, W. R. Van Schmus, J. Penaye and A. Mich- ard, “Preliminary U-Pb and Sm-Nd Geochronologic Data on the North-Central Cameroon: Contribution of an Ar- chean and Paleo-Proterozoic Crust to the Edification of an Active Domain of the Pan-African Oroge ny,” Acadé- mie des Sciences, Vol. 319, 1994, pp. 1519-1524. [12] D. Soba, A. Michard, S. F. Toteu, D. I. Norman, J. Penaye, V. Ngako, J. P. Nzenti and D. Dautel, “Donnes Geochronologiques Nouvelles (Rb/Sr, U/Pb and Sm/Nd) sur la Zone Mobile Panafricaine de l’Est-Cameroun: Age Protérozoique Supérieur de la Série de Lom,” Comptes Rendus de l'Académie des Sciences, Vol. 312, 1991, pp. 1453-1458. [13] V. Ngako, P. Affaton, J. M. Nnange, and T. H. Njanko, “Pan-African Tectonic Evolution in Central and Southern Cameroon: Transpression and Transtension during Sini- stral Shear Movements,” Journal of African Earth Sciences, Vol. 36, No. 3, 2003, pp. 207-214. doi:10.1016/S0899-5362(03)00023-X [14] S. F. Toteu, J. Penaye, and Y. P. Djomani, “Geodymanic Evolution of the Pan-African Belt in Central Africa with Special Reference to Cameroon,” Canadian Journal of Earth Sciences, Vol. 41, No. 1, 2004, pp. 73-85. doi:10.1139/e03-079 [15] E. P. Oliveira, S. F. Toteu, M. N. C. Arau´jo, M. J. Car- valho, R. S. Nascimento, J. F. Bueno, N. McNaughton and G. Basilici, “Geologic Correlation between the Neo- proterozoic Sergipano Belt (NE Brazil) and the Yaounde belt (Cameroon, Africa),” Journal of African Earth sci- ences, Vol. 44, No. 4-5, 2006, pp. 470-478. doi:10.1016/j.jafrearsci.2005.11.014 [16] S. F. Toteu, R. Y. Foutateu, J. Penaye, J. Tchakount e, A. C. S. Mouangue, W. R. Van Schmus, E. Deloule, and H. Stendal, “U-Pb Dating of Plutonic Rocks Involved in the Nappe Tectonic in Southern Cameroon: Consequence for the Pan-African Orogenic Evolution of the Central Afri- can Fold Belt,” Journal of African Earth Sciences, Vol. 44, No. 4-5, 2006, pp. 479-493. doi:10.1016/j.jafrearsci.2005.11.015 [17] S. F. Toteu, J. Penaye, E. Deloule, W. R. Van Schmus, and R. Tchameni, “Diachronous Evolution of Volcano- Sedimentary Basins North of the Congo Craton: Insights from U-Pb Ion Microprobe Dating of Zircons from the Poli, Lom and Yaoundé Groups (Cameroon),” Journal of African Earth Sciences, Vol. 44, No. 4-5, 2006, pp. 428- 442. doi:10.1016/j.jafrearsci.2005.11.011 [18] C. R. M. Butt, M. J. Lintern and R. R. Anand, “Evolution of Regoliths and Landscapes in Deeply Weathered Ter- rain—Implication for Geochemical Exploration,” In: A. G. Gubins, Ed., Proceedings of Exploration 97: Fourth Decennial International Conference on Mineral Explora- tion, 1997, pp. 323-334. [19] R. E. Smith, R. R. Anand and N. F. Alley, “Use and Im- plication of Paleoweathering Surfaces in Mineral Explo- ration,” In A.G. Gubins, Ed., Proceedings of Exploration 97: Fourth Decennial International Conference on Min- eral Exploration, 1997, pp. 335-346. [20] M. Cornelius, R. E. Smith, and A. J. Cox, “Laterite Geo- chemistry for Regional Exploration Surveys—A Review, and Sampling Strategies,” Geochemistry: Exploration, En- vironment, Analysis, Vol. 1, 2001, pp. 211-220. doi:10.1144/geochem.1.3.211 [21] A. M. C. Horbe and M. L. da Costa, “Lateritic Crusts and Related Soils in the Eastern Brazilian Amazonia,” Ge- oderma, Vol. 126, No. 3-4, 2005, pp. 225-239. doi:10.1016/j.geoderma.2004.09.011 [22] O. Neung-Hwan and D. D. Richter, “Elemental Translo- cation and Loss from Three Highly Weathered Soil- Bedrock Profiles in the Southeastern United States,” Ge- oderma, Vol. 126, No. 1-2, 2005, pp. 5-25. doi:10.1016/j.geoderma.2004.11.005 [23] Jin-liang Feng, “Trace Elements in Ferromanganese Concretions, Gibbsite Spots, and the Surrounding Terra Rossa overlying Dolomite: their Mobilization, Redistri- bution and Fractionation,” Journal of Geochemical Ex- ploration, Vol. 108, No. 1, 2011, pp. 99-111. doi:10.1016/j.gexplo.2010.10.010 [24] H. W. Nesbitt, and G. M. Young, ‘Petrogenesis of Sedi- ments in the Absence of Chemical Weathering: Effec ts of Abrasion and Sorting on Bulk Composition and Miner- alogy,” Sedimentology, Vol. 43, 1996, pp. 341-358. doi:10.1046/j.1365-3091.1996.d01-12.x [25] H. W. Nesbitt, G. M. Young, S. M. McLennan and R. R. Keays, “Effects of Chemical Weathering and Sorting on the Petrogenesis of Siliciclastic Sediments, with Implica- tions for Provenance Studies,” Journal of Geology, Vol. 104, No. 5, 1996, pp. 525-542. doi:10.1086/629850 [26] B. Singh and M. Cornelius, “Geochemistry and Mineral- ogy of the Regolith Profile over the Aries Kimberlite Pipe, Western Australia,” Geochemistry: Exploration, Envi- ronment, Analysis, Vol. 6, No. 4, 2006, pp. 311-323. doi:10.1144/1467-7873/06-113 [27] R. J. Bowell, E. O. Alreh, N. d’A. Laffoley, E. Hanssen, S. Abe, R. K. Yao and D. Pohl, “Geochemical Explora- tion for Gold in Tropical Soils—Four Contrasting Case Studies from West Africa,” Transactions of the Institu-  M. T. NFORBA ET AL. Copyright © 2011 Sci Res. OJG tion of Mining and Metallurgy, Section B: Applied Earth Science, Vol 105, 1996, pp. B12-B33. [28] C. A. C. Varajao, F. Colin, P. Vieillard, A. J. Melfi and D. Nahon, “Early Weathering of Palladium Gold under Lat- eritic Conditions, Maquine Mine, Minas Gerais, Brazil,” Applied Geochemist ry , Vol. 15, No. 2,2000, pp. 245-263. doi:10.1016/S0883-2927(99)00038-4 [29] S. A. Wilde, J. W. Valley, W. H. Peck and C. M. Graham, “Evidence from Detrital Zircons for the Existence of Continental Cr ust and Oceans on the Earth 4.4 Gyr ago,” Nature, Vol. 409, pp. 175-178. doi:10.1038/35051550 [30] A. Dokuz and E. Tanyolu, “Geochemical Constraints on the Provenance, Mineral Sorting and Subaerial Weather- ing of lower Jurassic and Upper ssCretaceous clastic Rocks of the Eastern Pontides, Yusufeli (Artvin), NE Turkey,” Turkish Journal of Earth Science, Vol. 15, 2006, pp. 181-209. [31] K. Sugitani, Y. Horiuchi, M. Adachi and R. Sugisaki, “Anomalously low Al2O3/TiO2 Values for Archean Cherts from the Pilbara Block, Western Australia—Pos- sible Evidence for Extensive Chemical Weathering on the Early Earth,” Precambrian Research, Vol. 80, 1996, pp. 49-76. [32] T. El-Hasan, A. Al-Malabeh, and K. Komuro, “Rare Earth Elements Geochemistry of the Cambrian Shallow Marine Manganese Deposit at Wadi Dana, South Jordan,” Jordan Journal of Earth and Environmental Sciences, Vol. 1, No. 1, 2008, pp. 45-52. doi:10.1016/S0301-9268(96)00005-8 Appendix 1: Major, trace and REE composition of itabirite, relict, erosional, and depositional soil samples from Mbalam regolith. Sample MB1 MB2 Itabirite MB3 MB4 MB5 MB6 MR1 MR2 Relict MR3 MR4 MR5 MR6 MR7 MR8 SiO2 51.50 43.43 4.99 51.23 32.62 40.65 21.27 5.25 7.58 1.35 11.05 5.38 6.59 3.63 Al2O3 2.46 0.06 0.16 2.47 0.18 1.17 2.25 13.33 5.11 3.06 8.07 9.10 3.78 0.91 Fe2O3 43.88 55.87 94.19 44.48 66.33 57.40 74.69 72.06 83.42 92.41 73.61 79.66 85.90 94.15 MgO 0.02 0.01 0.01 0.02 0.01 0.16 0.01 0.01 0.01 0.01 0.01 0.01 0.01 0.01 CaO 0.02 0.01 0.02 0.03 0.03 0.01 0.01 0.01 0.02 0.03 0.02 0.01 0.01 0.03 Na2O 0.01 0.01 0.01 0.01 0.01 0.02 0.01 0.01 0.02 0.01 0.03 0.03 0.01 0.02 K2O 0.22 0.01 0.01 0.22 0.01 0.15 0.03 0.03 0.09 0.02 0.28 0.31 0.05 0.01 TiO2 0.06 0.01 0.01 0.06 0.01 0.03 0.10 0.25 0.16 0.09 0.26 0.25 0.17 0.03 P2O5 0.15 0.02 0.07 0.16 0.14 0.01 0.04 0.11 0.09 0.14 0.37 0.09 0.15 0.06 MnO 0.01 0.01 0.02 0.01 0.08 0.01 0.01 0.01 0.02 0.01 0.02 0.01 0.01 0.01 Cr2O3 0.03 0.06 0.05 0.03 0.04 0.05 0.03 0.02 0.02 0.03 0.03 0.01 0.04 0.04 LOI 1.5 0.5 0.4 1.2 0.5 0.3 1.4 8.8 3.3 2.8 6.1 5.0 3.2 1.0 TOT/C 0.01 0.01 0.01 0.01 0.01 0.01 0.12 0.20 0.04 0.10 0.07 0.06 0.71 0.14 TOT/S 0.01 0.01 0.01 0.01 0.01 0.01 0.01 0.04 0.01 0.02 0.01 0.01 0.01 0.01 Sum 99.9 99.9 99.85 99.91 99.87 99.94 99.87 99.88 99.79 99.88 99.84 99.87 99.86 99.85 Sc 2 0.5 1 2 1 2 6 16 7 8 22 8 5 3 Ba 219 4 129 212 355 6 25 28 290 42 111 33 70 41 Be 2.0 0.5 0.5 2.0 1.0 0.5 0.5 0.5 2.0 1.0 0.5 2.0 2 2 Co 1.7 1.0 1.1 1.6 1.8 3.3 1.7 1.3 1.9 1.1 4.9 0.7 2.3 3.0 Cs 0.4 0.1 0.1 0.5 0.1 0.2 0.2 0.3 0.3 0.1 0.4 1.5 0.2 0.1 Ga 3.0 0.3 0.9 2.6 1.0 1.8 3.0 8.0 7.9 3.0 9.2 7.1 6.7 1.8 Hf 0.5 0.1 0.1 0.4 0.1 0.2 0.9 3.1 1.5 0.8 1.7 1.9 2.2 0.3 Nb 0.9 0.1 0.2 0.8 0.2 0.5 2.4 5.6 3.1 2.4 4.4 5.5 4.1 0.6 Rb 4.2 0.1 0.2 4.3 0.2 3.2 1.4 1.3 3.6 1.1 6.8 8.4 2.0 0.4 Sn 0.5 0.5 0.5 0.5 0.5 0.5 0.5 0.5 0.5 0.5 1.0 0.5 0.5 0.5 Sr 52.9 1.3 4.5 50.9 77.1 3.8 16.4 17.0 54.4 24.6 25.7 19.8 39.2 18.8 Ta 0.1 0.1 0.1 0.1 0.1 0.1 0.1 0.3 0.2 0.1 0.3 0.3 0.3 0.1 Th 0.6 0.1 0.1 0.5 0.1 0.3 1.7 5.6 2.6 1.5 3.8 4.3 4.2 0.3 U 0.7 0.1 0.2 0.8 0.3 0.1 1.6 2.0 2.8 1.2 3.6 2.2 1.3 0.7 V 19 4 9 21 15 12 77 102 120 53 165 68 99 33 W 1.7 1.2 1.6 1.6 2.3 0.5 3.5 2.3 1.8 1.8 1.3 3.5 2.3 2.0  M. T. NFORBA ET AL. Copyright © 2011 Sci Res. OJG Sample Zr 17.3 0.7 2.2 14.4 0.8 8.3 34.6 112.3 77.9 32.3 75.2 81.7 80.4 8.6 Y 8.2 6.9 23.5 7.9 11.4 7.3 12.1 10.7 19.2 10.3 14.6 9.9 10.3 12.5 La 5.1 0.5 2.6 5.0 0.6 3.5 13.3 19.5 24.2 13.2 23.4 12.4 19.4 12.7 Ce 6.6 0.7 5.3 8.0 1.2 6.1 22.5 38.9 47.5 26.9 44.4 23.8 35.8 25.8 Pr 1.10 0.13 0.62 1.03 0.16 0.77 2.70 4.73 5.44 3.40 5.00 2.58 3.73 3.38 Nd 4.1 0.6 2.7 4.0 0.9 3.4 9.2 18.9 20.1 14.4 20.2 10.6 13.3 13.5 Sm 0.87 0.30 1.05 0.82 0.55 0.56 1.93 3.00 4.51 3.00 3.70 2.17 1.98 2.62 Eu 0.43 0.26 0.82 0.43 0.42 0.29 0.73 0.87 1.33 0.97 0.99 0.83 0.58 0.83 Gd 0.96 0.58 2.05 0.93 1.09 0.64 2.14 2.42 5.23 2.87 3.51 1.90 1.79 2.67 Tb 0.17 0.11 0.39 0.17 0.20 0.12 0.35 0.33 0.89 0.42 0.54 0.33 0.27 0.43 Dy 0.99 0.70 2.66 1.00 1.22 0.92 1.94 1.76 4.41 2.02 3.14 1.93 1.64 2.24 Ho 0.25 0.19 0.63 0.24 0.26 0.18 0.41 0.36 0.77 0.36 0.54 0.36 0.35 0.41 Er 0.82 0.55 1.95 0.74 0.80 0.58 1.06 0.96 1.78 0.94 1.46 1.02 1.01 1.08 Tm 0.13 0.09 0.34 0.13 0.14 0.10 0.16 0.15 0.23 0.14 0.22 0.17 0.13 0.14 Yb 0.75 0.54 1.93 0.75 0.84 0.55 1.03 0.94 1.32 0.84 1.30 1.04 0.77 0.84 Lu 0.11 0.08 0.33 0.11 0.14 0.10 0.15 0.16 0.20 0.12 0.20 0.16 0.12 0.12 Mo 0.3 0.2 0.3 0.3 0.3 0.4 2.0 1.9 1.1 1.1 0.9 0.3 2.5 0.6 Cu 5.2 2.9 2.0 4.1 8.2 2.4 2.6 4.4 7.0 9.7 13.1 2.4 8.1 5.7 Pb 1.3 0.1 0.3 1.1 0.4 0.3 2.5 3.4 8.1 2.9 8.9 4.0 6.3 2.2 Zn 3.0 0.5 0.5 3.0 3.0 2.0 3.0 4.0 6.0 4.0 12.0 3.0 6.0 2.0 Ni 4.0 2.6 3.0 4.4 3.6 4.9 5.4 3.3 7.9 3.3 6.7 3.1 9.4 10.2 As 1.8 0.3 0.3 1.6 0.3 0.3 6.3 4.0 2.6 1.7 4.3 1.1 9.6 3.0 Cd 0.1 0.1 0.1 0.1 0.1 0.1 0.1 0.1 0.1 0.1 0.1 0.1 0.1 0.1 Sb 0.1 0.1 0.1 0.1 0.1 0.1 0.5 0.6 0.2 0.3 0.1 0.4 0.4 0.1 Bi 0.1 0.1 0.1 0.1 0.1 0.1 0.1 0.2 0.2 0.1 0.2 0.1 0.2 0.1 Ag 0.1 0.3 0.2 0.1 0.1 0.1 0.1 0.2 0.1 0.1 0.3 0.1 0.1 0.2 Au 0.3 0.3 0.3 0.3 0.3 0.3 0.6 1.4 0.3 0.3 0.3 0.3 1.0 2.3 Hg 0.01 0.01 0.01 0.01 0.01 0.01 0.01 0.13 0.01 0.03 0.03 0.02 0.06 0.01 Tl 0.05 0.05 0.05 0.05 0.05 0.05 0.05 0.05 0.05 0.05 0.05 0.05 0.05 0.05 Se 0.3 0.3 0.5 0.3 0.3 0.3 0.3 0.3 0.3 0.3 0.3 0.3 0.3 0.3 Au 1.0 0.5 0.5 12.0 2.0 1.0 0.5 2.0 2.0 2.0 2.0 1.0 - - Pt 0.3 0.2 0.3 0.2 0.1 0.3 0.4 4.2 2.2 0.4 2.5 0.8 - - Pd 0.3 0.3 0.3 0.3 0.3 0.3 0.3 0.9 1.1 0.3 1.2 0.6 - - ΣREE 30.6 12.2 46.9 31.3 19.9 25.1 69.7 103.7 137.1 79.9 123.2 69.2 91.2 79.3 Ce/ΣREE 0.2 0.1 0.1 0.3 0.1 0.2 0.3 0.4 0.3 0.3 0.4 0.3 0.4 0.3 Eu/Sm 0.5 0.9 0.8 0.5 0.8 0.5 0.4 0.3 0.3 0.3 0.3 0.4 0.3 0.3 Ce/La 1.3 1.4 2.0 1.6 2.0 1.7 1.7 2.0 2.0 2.0 1.9 1.9 1.8 2.0 La/Yb 6.8 0.9 1.3 6.7 0.7 6.4 12.9 20.7 18.3 15.7 18.0 11.9 25.2 15.1 Appendix 1 ( continued) SiO2 8.64 2.90 2.29 23.89 29.66 17.64 0.99 0.81 18.18 1.13 1.34 7.91 22.06 31.86 Al2O3 3.38 5.58 5.19 22.29 24.51 31.16 7.87 3.55 34.62 8.50 8.01 15.24 23.29 31.46 Fe2O3 84.08 80.68 88.85 39.45 31.47 32.57 84.91 88.75 26.85 83.66 80.87 64.79 39.60 19.56 MgO 0.01 0.01 0.01 0.01 0.01 0.01 0.01 0.01 0.01 0.01 0.01 0.01 0.02 0.01 CaO 0.01 0.01 0.02 0.01 0.01 0.01 0.01 0.02 0.01 0.01 0.01 0.01 0.01 0.01 Na2O 0.01 0.01 0.02 0.01 0.01 0.01 0.01 0.01 0.01 0.01 0.01 0.01 0.01 0.01 K2O 0.03 0.08 0.02 0.01 0.05 0.01 0.01 0.01 0.02 0.01 0.01 0.01 0.09 0.03 TiO2 0.12 0.21 0.06 0.96 0.94 0.76 0.18 0.07 0.78 0.17 0.17 0.58 0.83 0.77 P2O5 0.33 0.88 0.08 0.11 0.12 0.19 0.12 0.84 0.20 0.14 0.25 0.34 0.16 0.12 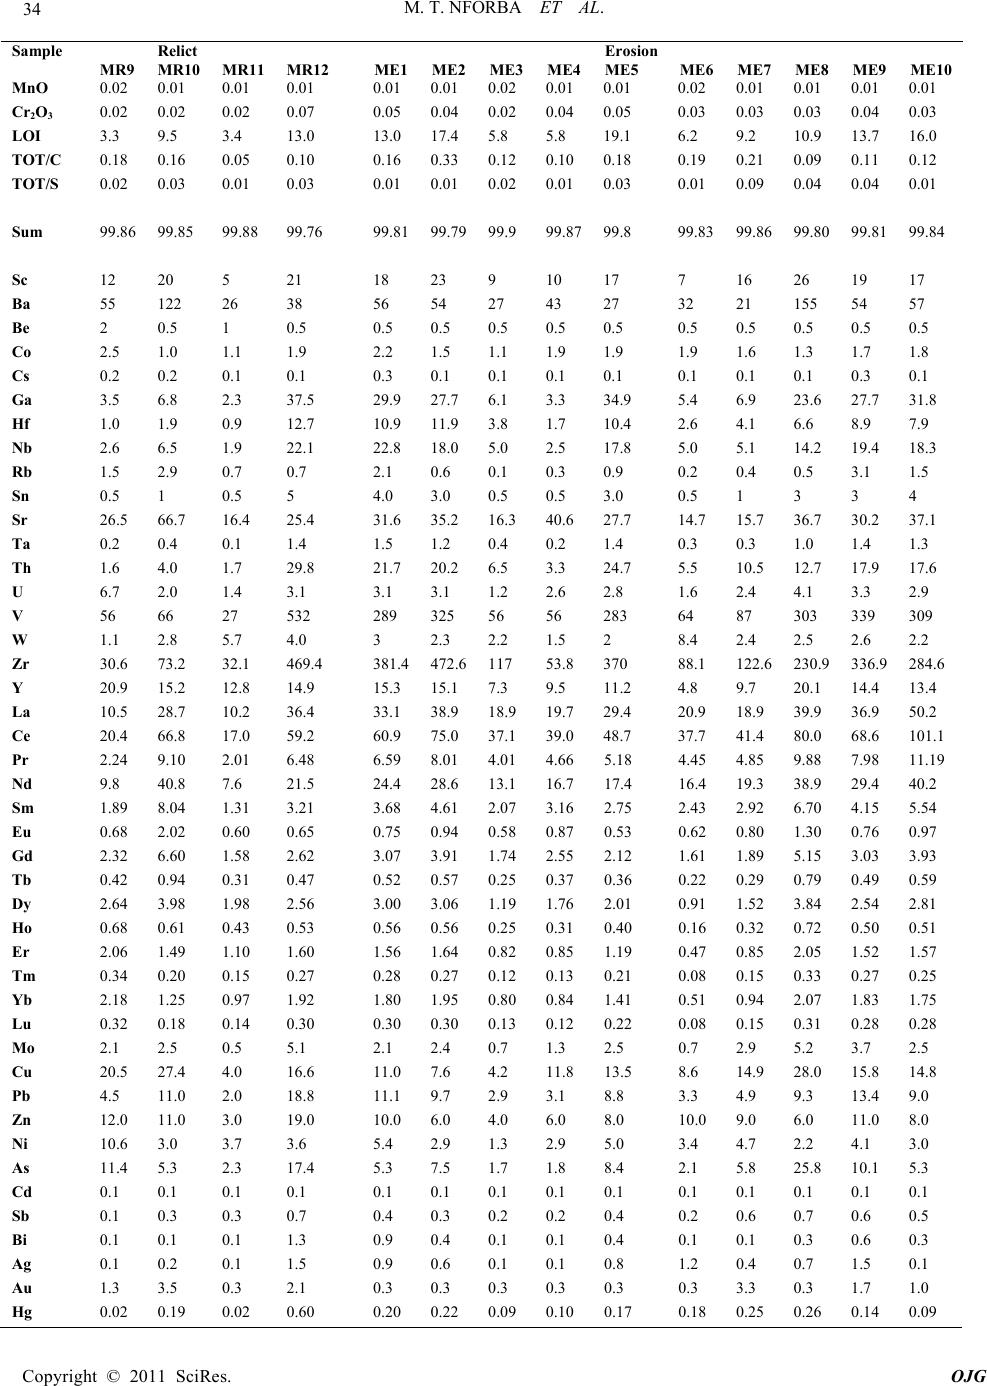 M. T. NFORBA ET AL. Copyright © 2011 Sci Res. OJG 2 3 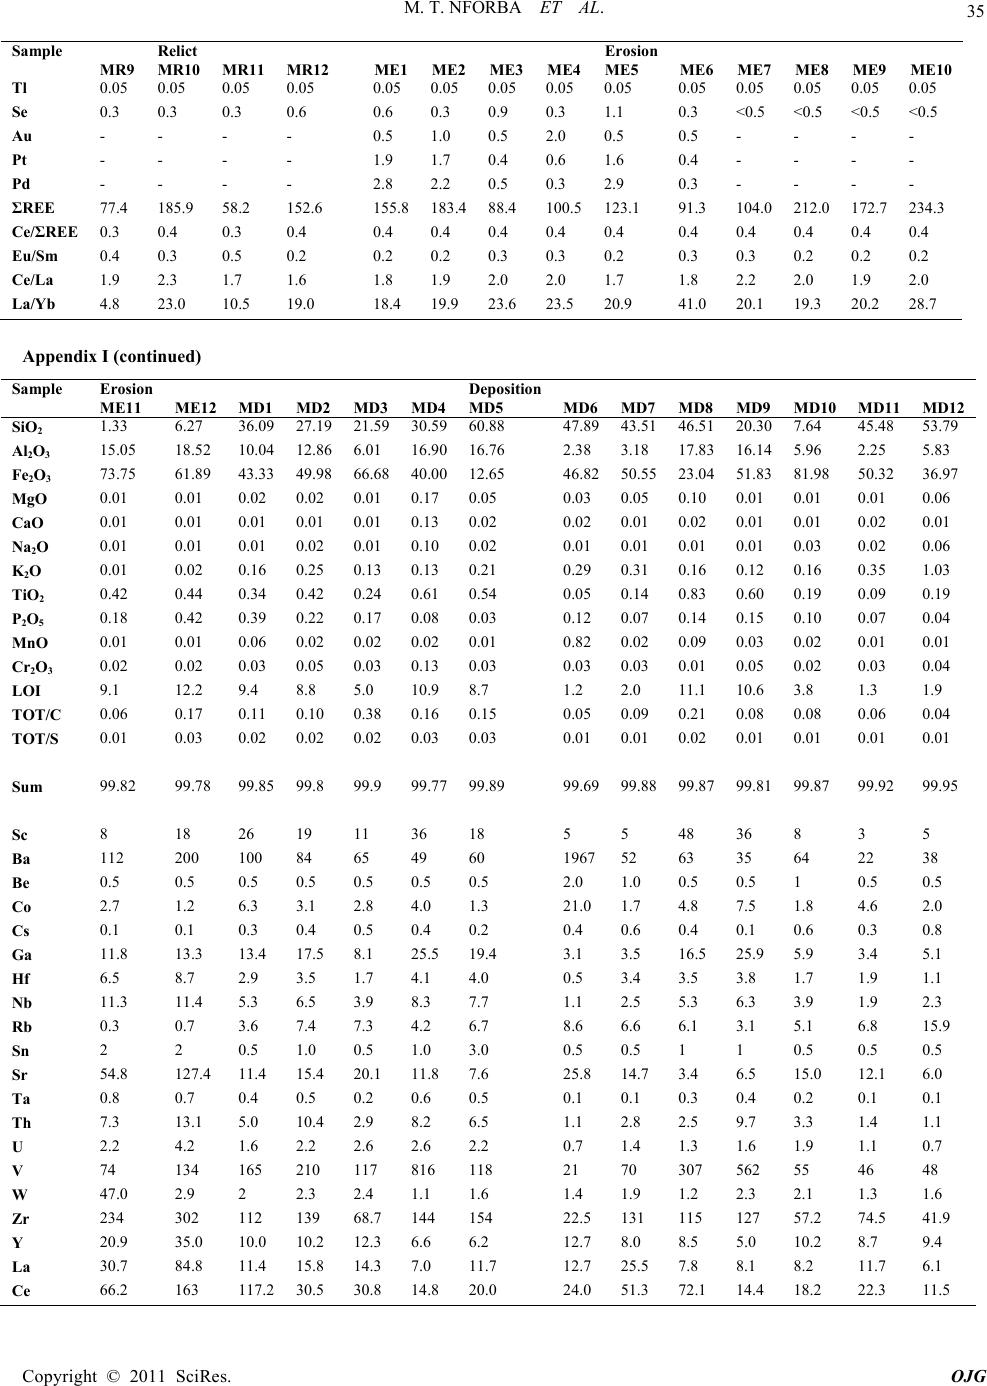 M. T. NFORBA ET AL. Copyright © 2011 Sci Res. OJG Appendix I (continued) 2 2 3 2 3 2 2 2 2 5 2 3 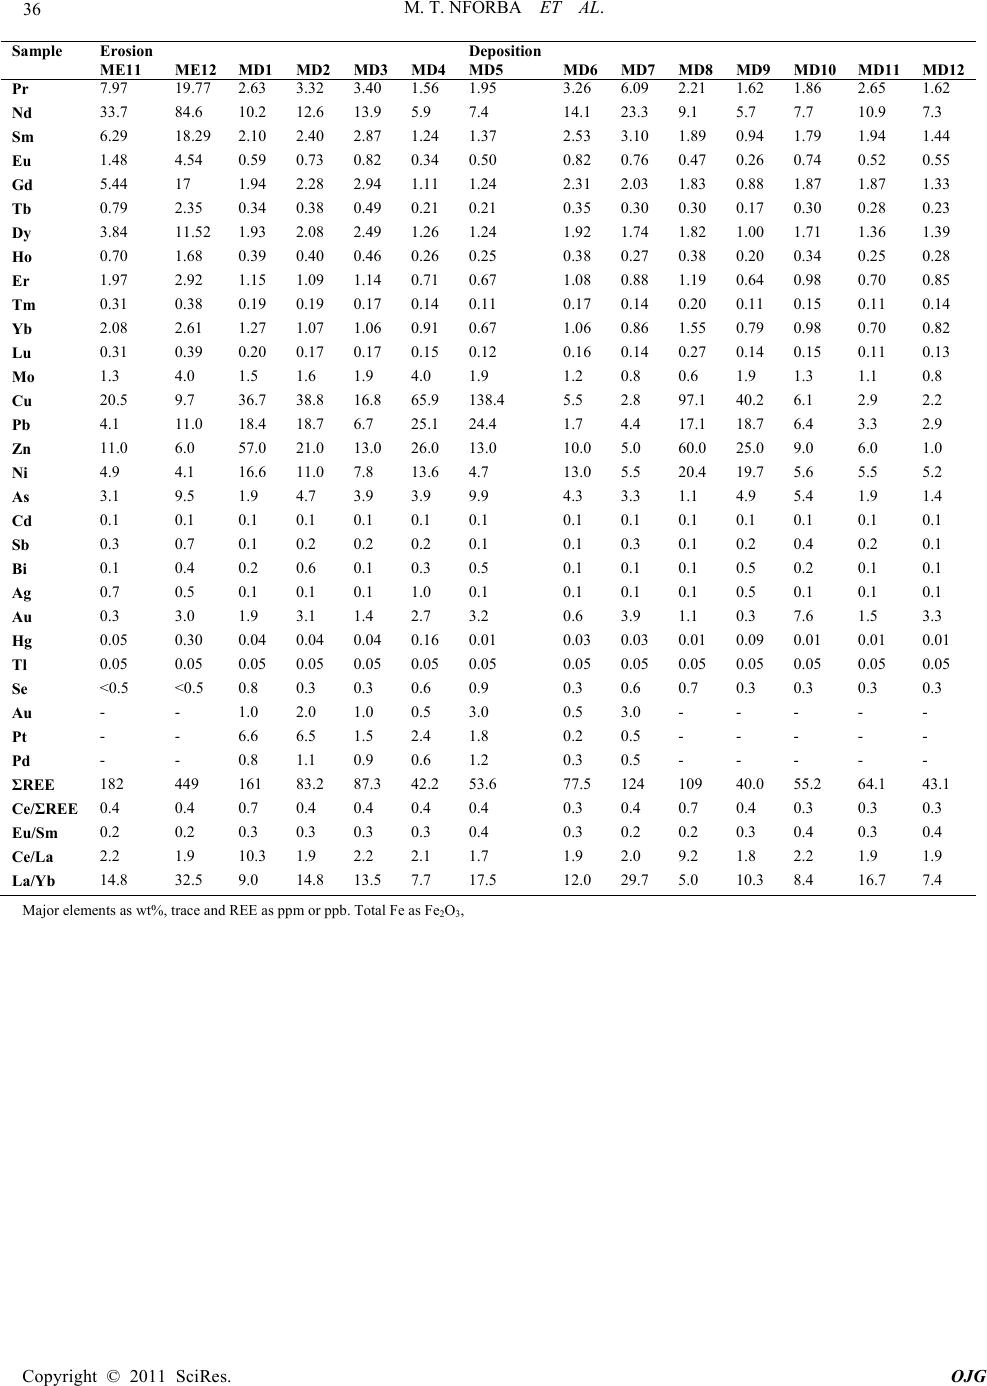 M. T. NFORBA ET AL. Copyright © 2011 Sci Res. OJG Major elements as wt%, t race and REE as ppm or ppb. Total Fe as Fe2O3,
|