Paper Menu >>
Journal Menu >>
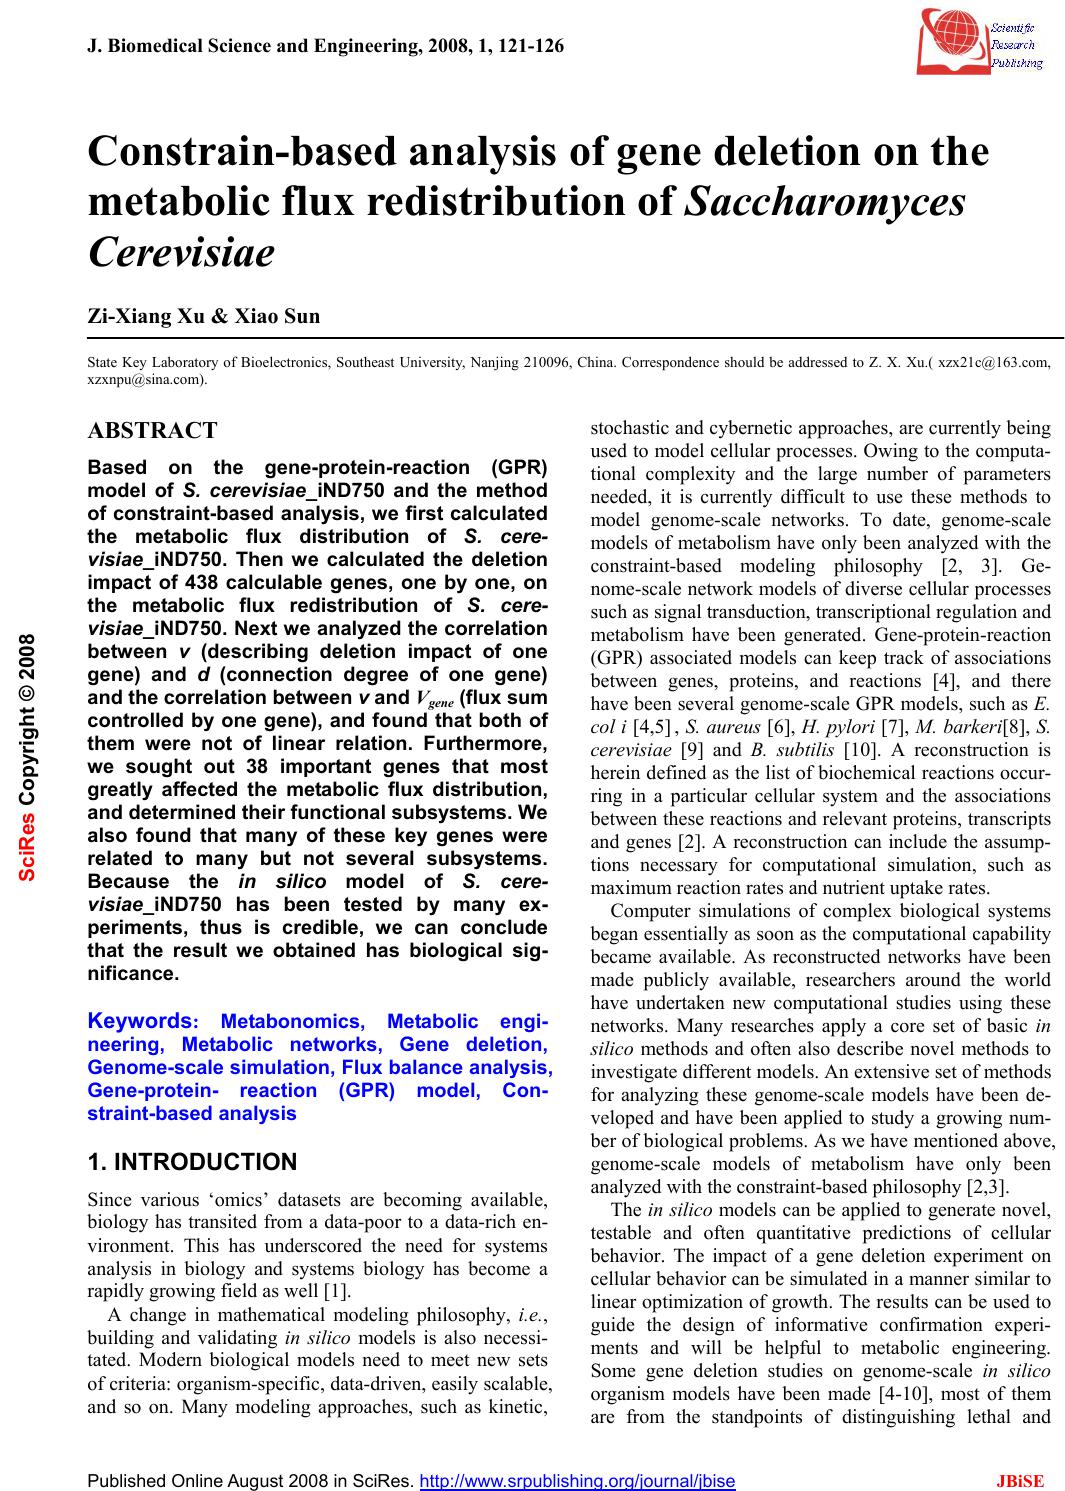 J. Biomedical Science and Engineering, 2008, 1, 121-126 Published Online August 2008 in SciRes. http://www.srpublishing.org/journal/jbise JBiSE Constrain-based analysis of gene deletion on the metabolic flux redistribution of Saccharomyces Cerevisiae Zi-Xiang Xu & Xiao Sun State Key Laboratory of Bioelectronics, Southeast University, Nanjing 210096, China. Correspondence should be addressed to Z. X. Xu.( xzx21c@163.com, xzxnpu@sina.com). ABSTRACT Based on the gene-protein-reaction (GPR) model of S. cerevisiae_iND750 and the method of constraint-based analysis, we first calculated the metabolic flux distribution of S. cere- visiae_iND750. Then we calculated the deletion impact of 438 calculable genes, one by one, on the metabolic flux redistribution of S. cere- visiae_iND750. Next w e analyzed the correlation between v (describing deletion impact of one gene) and d (connection degree of one gene) and the correlation bet ween v and Vgene (flux sum controlled by one gene), and found that both of them were not of linear relation. Furthermore, we sought out 38 important genes that most greatly affected the metabolic flux distribution, and determined their fu nctional subsystems. We also found that many of these key genes were related to many but not several subsystems. Because the in silico model of S. cere- visiae_iND750 has been tested by many ex- periments, thus is credible, we can conclude that the result we obtained has biological sig- nificance. Keywords: Metabonomics, Metabolic engi- neering, Metabolic networks, Gene deletion, Genome-scale simulation, Flux balance analysis, Gene-protein- reaction (GPR) model, Con- straint-based analysis 1. INTRODUCTION Since various ‘omics’ datasets are becoming available, biology has transited from a data-poor to a data-rich en- vironment. This has underscored the need for systems analysis in biology and systems biology has become a rapidly growi n g fi el d as well [1] . A change in mathematical modeling philosophy, i.e., building and validating in silico models is also necessi- tated. Modern biological models need to meet new sets of criteria: organism-specific, data-driven, easily scalable, and so on. Many modeling approaches, such as kinetic, stochastic and cybernetic approaches, are currently being used to model cellular processes. Owing to the computa- tional complexity and the large number of parameters needed, it is currently difficult to use these methods to model genome-scale networks. To date, genome-scale models of metabolism have only been analyzed with the constraint-based modeling philosophy [2, 3]. Ge- nome-scale network models of diverse cellular processes such as signal transduction, transcriptional regulation and metabolism have been generated. Gene-protein-reaction (GPR) associated models can keep track of associations between genes, proteins, and reactions [4], and there have been several genome-scale GPR models, such as E. col i [4,5] , S. aureus [6], H. pylori [7], M. barkeri[8], S. cerevisiae [9] and B. subtilis [10]. A reconstruction is herein defined as the list of biochemical reactions occur- ring in a particular cellular system and the associations between these reactions and relevant proteins, transcripts and genes [2]. A reconstruction can include the assump- tions necessary for computational simulation, such as maximum reaction rates and nutrient uptake rates. Computer simulations of complex biological systems began essentially as soon as the computational capability became available. As reconstructed networks have been made publicly available, researchers around the world have undertaken new computational studies using these networks. Many researches apply a core set of basic in silico methods and often also describe novel methods to investigate different models. An extensive set of methods for analyzing these genome-scale models have been de- veloped and have been applied to study a growing num- ber of biological problems. As we have mentioned above, genome-scale models of metabolism have only been analyzed with the constrain t-based philosophy [2,3]. The in silico models can be applied to generate novel, testable and often quantitative predictions of cellular behavior. The impact of a gene deletion experiment on cellular behavior can be simulated in a manner similar to linear optimization of growth. The results can be used to guide the design of informative confirmation experi- ments and will be helpful to metabolic engineering. Some gene deletion studies on genome-scale in silico organism models have been made [4-10], most of them are from the standpoints of distinguishing lethal and SciRes Copyright © 2008 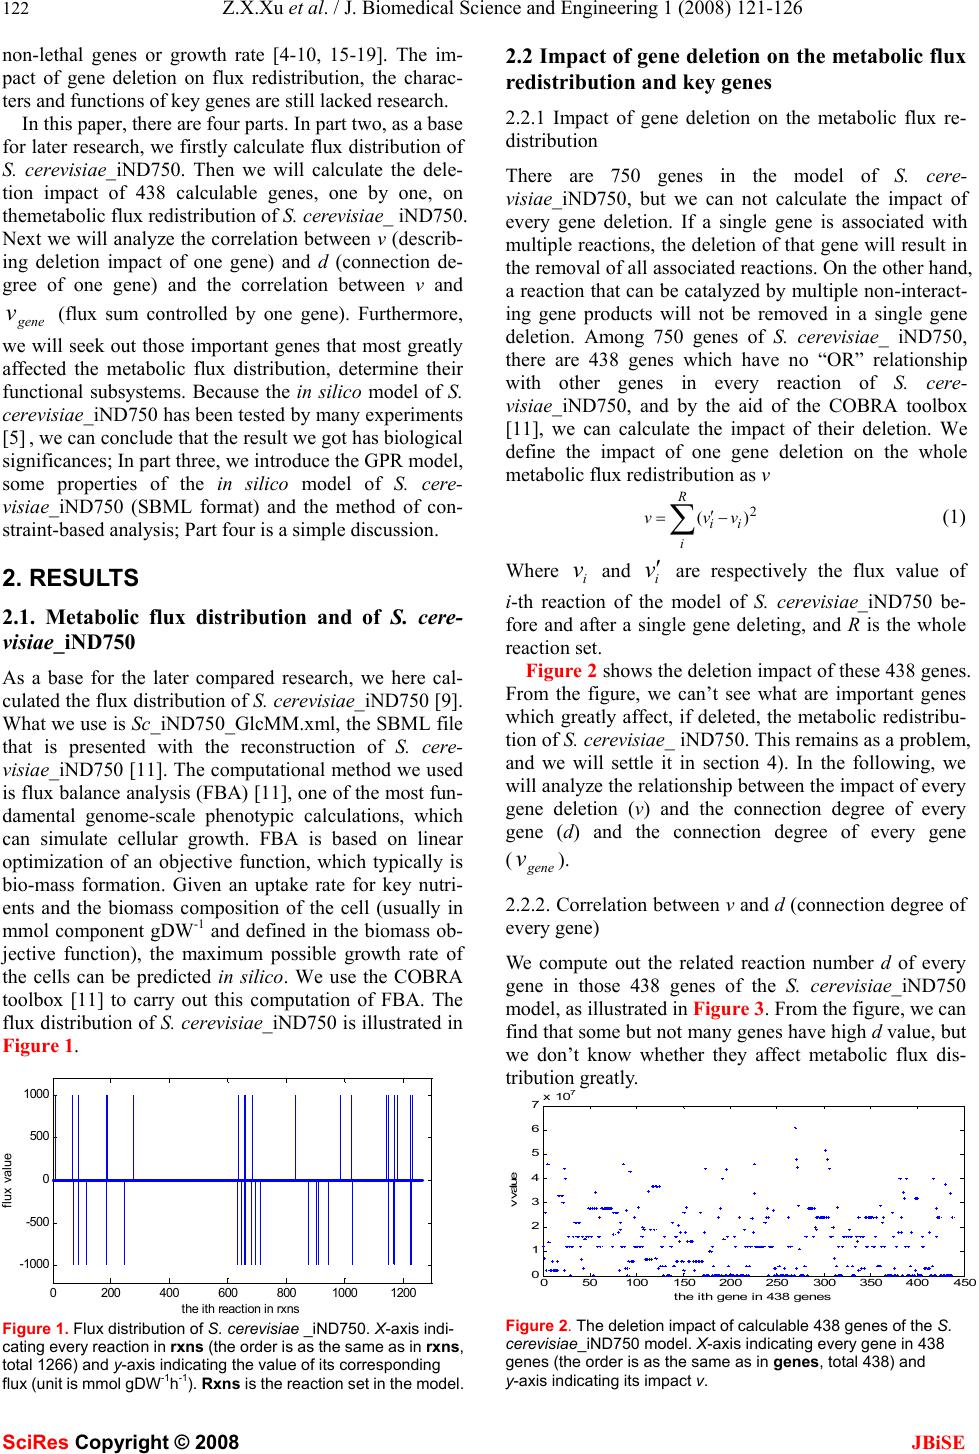 122 Z.X.Xu et al. / J. Biomedical Science and Engineering 1 (2008) 121-126 SciRes Copyright © 2008 JBiSE non-lethal genes or growth rate [4-10, 15-19]. The im- pact of gene deletion on flux redistribution, the charac- ters and functions of key genes are still lacked research. In this paper, there are four parts. In part two, as a base for later research, we firstly calculate flux distribution of S. cerevisiae_iND750. Then we will calculate the dele- tion impact of 438 calculable genes, one by one, on themetabolic flux redistribution of S. cerevisiae_ iND750. Next we will analyze the correlation between v (describ- ing deletion impact of one gene) and d (connection de- gree of one gene) and the correlation between v and gene v (flux sum controlled by one gene). Furthermore, we will seek out those important genes that most greatly affected the metabolic flux distribution, determine their functional subsystems. Because the in silico model of S. cerevisiae_iND750 has been tested by many experiments [5] , we can conclude that the result we got h as biological significances; In part three, we introduce the GPR model, some properties of the in silico model of S. cere- visiae_iND750 (SBML format) and the method of con- straint-based analysis; Part four is a simple discussion. 2. RESULTS 2.1. Metabolic flux distribution and of S. cere- visiae_iND750 As a base for the later compared research, we here cal- culated the flux distributio n of S. cerevisiae_ iND750 [9]. What we use is Sc_iND750_GlcMM.xml, the SBML file that is presented with the reconstruction of S. cere- visiae_iND750 [11]. The computational method we used is flux balance an alysis (FBA) [11], one of the most fun- damental genome-scale phenotypic calculations, which can simulate cellular growth. FBA is based on linear optimization of an objective function, which typically is bio-mass formation. Given an uptake rate for key nutri- ents and the biomass composition of the cell (usually in mmol component gDW-1 and defined in the biomass ob- jective function), the maximum possible growth rate of the cells can be predicted in silico. We use the COBRA toolbox [11] to carry out this computation of FBA. The flux distribution of S. cerevisiae_iND750 is illustrated in Figure 1. 0200 400 600 8001000 1200 -1000 -500 0 500 1000 the i th reaction in rxns fl ux va l ue Figure 1. Flux distribution of S. cerevisiae _iND750. X-axis indi- cating every re action in rxns (the order is as the same as in rxns, total 1266) and y-axis indicating the value of its corresponding flux (unit is mmol gDW-1h-1). Rxns is the reaction set in the model. 2.2 Impact of gene deletion on the metabolic flux redistribution and key genes 2.2.1 Impact of gene deletion on the metabolic flux re- distribution There are 750 genes in the model of S. cere- visiae_iND750, but we can not calculate the impact of every gene deletion. If a single gene is associated with multiple reactions, the deletion of that gene will result in the removal of all associated reactions. On the other hand, a reaction that can be catalyzed by multiple non-interact- ing gene products will not be removed in a single gene deletion. Among 750 genes of S. cerevisiae_ iND750, there are 438 genes which have no “OR” relationship with other genes in every reaction of S. cere- visiae_iND750, and by the aid of the COBRA toolbox [11], we can calculate the impact of their deletion. We define the impact of one gene deletion on the whole metabolic flux redistribution as v ∑− ′ = R i ii vvv 2 )( (1) Where i v and i v ′ are respectively the flux value of i-th reaction of the model of S. cerevisiae_iND750 be- fore and after a single gene deleting, and R is the whole reaction set. Figure 2 shows the deletion impact of these 438 genes. From the figure, we can’t see what are important genes which greatly affect, if deleted, the metabolic redistribu- tion of S. cerevisiae_ iND750. This remains as a problem, and we will settle it in section 4). In the following, we will analyze the relationship between th e impact of every gene deletion (v) and the connection degree of every gene (d) and the connection degree of every gene (gene v). 2.2.2. Correlation between v and d (connection degree of every gene) We compute out the related reaction number d of every gene in those 438 genes of the S. cerevisiae_iND750 model, as illustrated in Figure 3. From the figure, we can find that some but not many genes have high d value, but we don’t know whether they affect metabolic flux dis- tribution greatly. 050100 150200250 300350400 450 0 1 2 3 4 5 6 7x 10 7 t he ith gene in 438 genes v va lue Figure 2. The deletion impact of calculable 438 genes of the S. cerevisiae_iND750 model. X-axis indicating every gene in 438 genes (the order is as the same as in genes, total 438) and y-axis indicating its impact v. 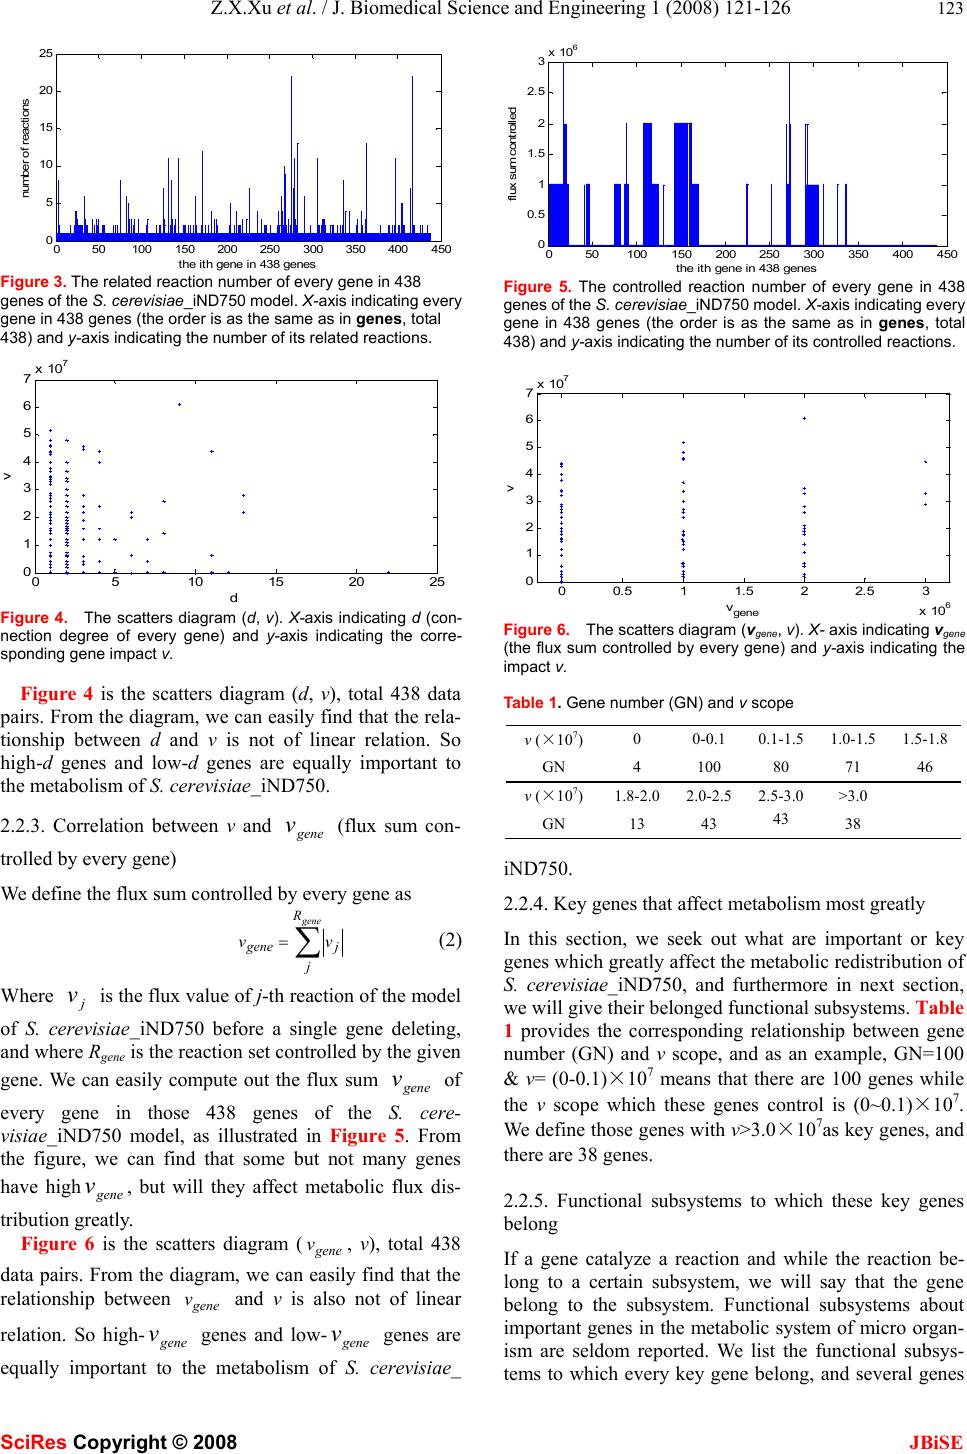 Z.X.Xu et al. / J. Biomedical Science and Engineering 1 (2008) 121-126 123 SciRes Copyright © 2008 JBiSE 050100150 200 250300 350 400450 0 5 10 15 20 25 t he ith gene in 438 genes number of reactions Figure 3. The related reaction number of every gene in 438 genes of the S. cerevisiae_iND750 model. X-axis indicating every gene in 438 genes (the order is as the same as in genes, total 438) and y-axis indicating the number of its related reactions. 05 10 15 20 25 0 1 2 3 4 5 6 7x 10 7 d v Figure 4. The scatters diagram (d, v). X-axis indicating d (con- nection degree of every gene) and y-axis indicating the corre- sponding gene impact v. Figure 4 is the scatters diagram (d, v), total 438 data pairs. From the diagram, we can easily find that the rela- tionship between d and v is not of linear relation. So high-d genes and low-d genes are equally important to the metabolism of S. cerevisiae_iND750. 2.2.3. Correlation between v and gene v (flux sum con- trolled by every gene) We define the flux sum controlled by every gene as ∑ = gene R j jgene vv (2) Where j v is the flux valu e of j-th reaction of the model of S. cerevisiae_iND750 before a single gene deleting, and where Rgene is the reaction set controlled by the given gene. We can easily compute out the flux sum gene v of every gene in those 438 genes of the S. cere- visiae_iND750 model, as illustrated in Figure 5. From the figure, we can find that some but not many genes have highgene v, but will they affect metabolic flux dis- tribution greatly. Figure 6 is the scatters diagram (gene v, v), total 438 data pairs. From the diagram, we can easily find that the relationship between gene v and v is also not of linear relation. So high-gene v genes and low-gene v genes are equally important to the metabolism of S. cerevisiae_ 050 100 150 200250 300 350 400 450 0 0.5 1 1.5 2 2.5 3x 10 6 the ith gen e in 43 8 g en es flux sum controlled Figure 5. The controlled reaction number of every gene in 438 genes of the S. cerevisiae_iND750 model. X-axis indicating every gene in 438 genes (the order is as the same as in genes , total 438) and y-axis indicating the number of its controlled reactions. 00.5 11.5 22.5 3 x 10 6 0 1 2 3 4 5 6 7x 10 7 v gene v Figure 6. The scatters diagram (vgene, v). X- axis indicating vgene (the flux sum controlled by every gene) and y-axis indicating the impact v. Table 1. Gene number (GN) and v scope v (×107) 0 0-0.1 0.1-1.5 1.0-1.51.5-1.8 GN 4 100 80 71 46 v (×107) 1.8-2.02.0-2.5 2.5-3.0 >3.0 GN 13 43 43 38 iND750. 2.2.4. Key genes that affect metabolism most greatly In this section, we seek out what are important or key genes which greatly affect the metabolic redistribution of S. cerevisiae_iND750, and furthermore in next section, we will give their belonged functional subsystems. Table 1 provides the corresponding relationship between gene number (GN) and v scope, and as an example, GN=100 & v= (0-0.1)×107 means that there are 100 genes while the v scope which these genes control is (0~0.1)×107. We define those genes with v>3.0×10⁷as key genes, and there are 38 genes. 2.2.5. Functional subsystems to which these key genes belong If a gene catalyze a reaction and while the reaction be- long to a certain subsystem, we will say that the gene belong to the subsystem. Functional subsystems about important genes in the metabolic system of micro organ- ism are seldom reported. We list the functional subsys- tems to which every key gene belong, and several genes 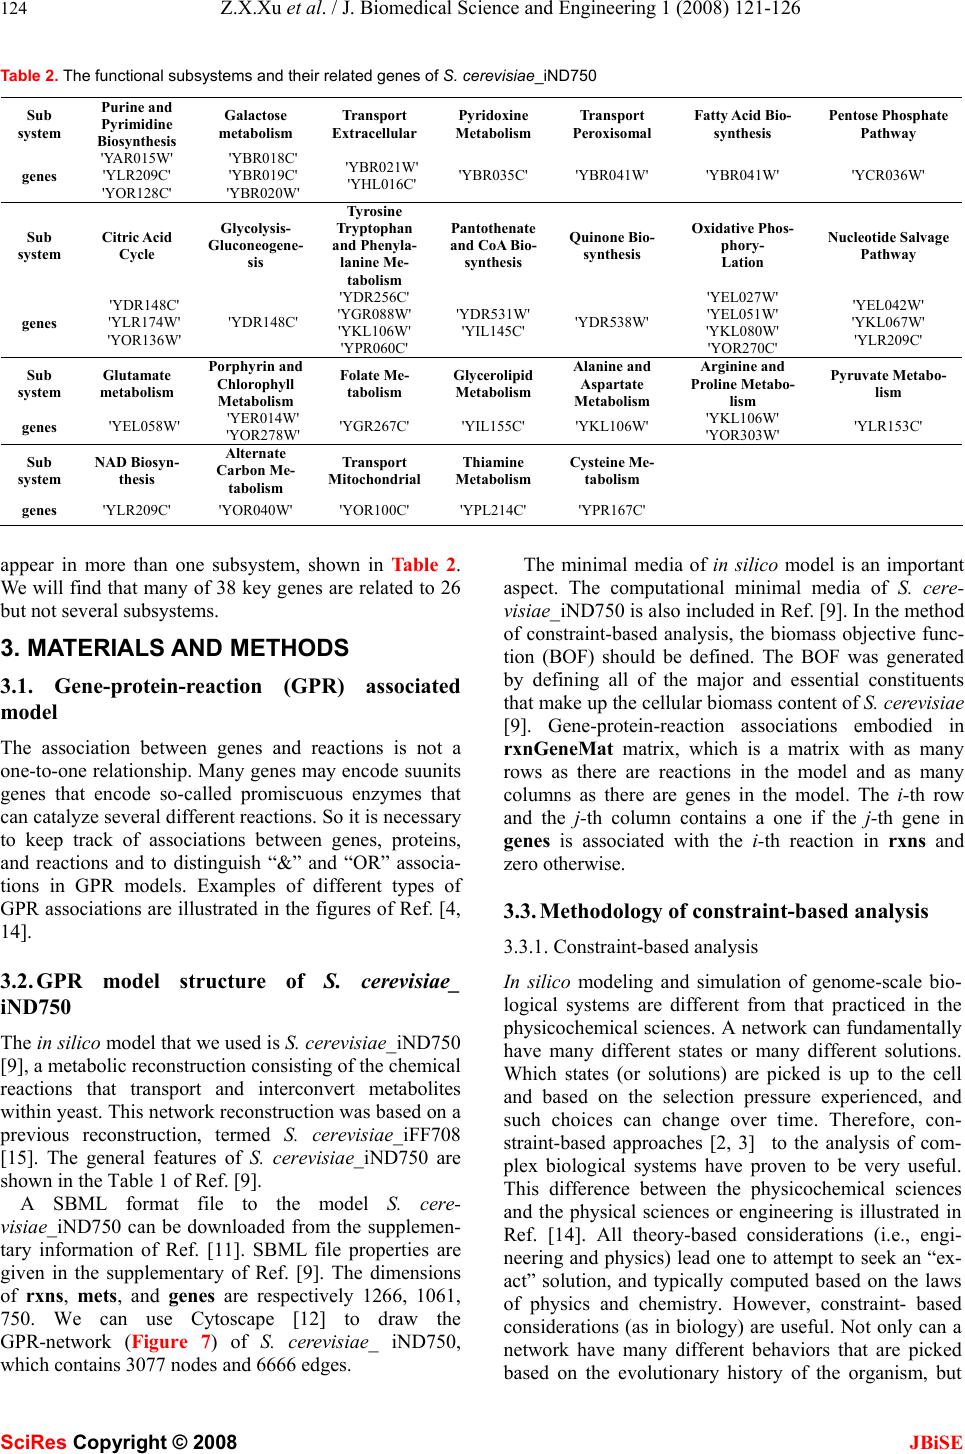 124 Z.X.Xu et al. / J. Biomedical Science and Engineering 1 (2008) 121-126 SciRes Copyright © 2008 JBiSE Table 2. The functional subsystems and their related genes of S. cerevisiae_iND750 Sub system Purine and Pyrimidine Biosynthesis Galactose metabolism Transport Extracellular Pyridoxine Metabolism Transport Peroxisomal Fatty Acid Bio- synthesis Pentose Phosphate Pathway genes 'YAR015W' 'YLR209C' 'YOR128C' 'YBR018C' 'YBR019C' 'YBR020W' 'YBR021W' 'YHL016C' 'YBR035C' 'YBR041W' 'YBR041W' 'YCR036W' Sub system Citric Acid Cycle Glycolysis- Gluconeogene- sis Tyrosine Tryptophan and Phenyla- lanine Me- tabolism Pantothenate and CoA Bio- synthesis Quinone Bio- synthesis Oxidative Phos- phory- Lation Nucleotide Salvage Pathway genes 'YDR148C' 'YLR174W' 'YOR136W' 'YDR148C' 'YDR256C' 'YGR088W' 'YKL106W' 'YPR060C' 'YDR531W' 'YIL145C' 'YDR538W' 'YEL027W' 'YEL051W' 'YKL080W' 'YOR270C' 'YEL042W' 'YKL067W' 'YLR209C' Sub system Glutamate metabolism Porphyrin and Chlorophyll Metabolism Folate Me- tabolism Glycerolipid Metabolism Alanine and Aspartate Metabolism Arginine and Proline Metabo- lism Pyruvate Metabo - lism genes 'YEL058W' 'YER014W' 'YOR278W' 'YGR267C' 'YIL155C' 'YKL106W' 'YKL106W' 'YOR303W' 'YLR153C' Sub system NAD Biosyn- thesis Alternate Carbon Me- tabolism Transport Mitochondrial Thiamine Metabolism Cysteine Me- tabolism genes 'YLR209C' 'YOR040W' 'YOR100C' 'YPL214C' 'YPR167C' appear in more than one subsystem, shown in Tabl e 2. We will find that many of 38 key genes are related to 26 but not several subsystems. 3. MATERIALS AND METHODS 3.1. Gene-protein-reaction (GPR) associated model The association between genes and reactions is not a one-to-one relationship. Many genes may encode suunits genes that encode so-called promiscuous enzymes that can catalyze several different reactions. So it is necessary to keep track of associations between genes, proteins, and reactions and to distinguish “&” and “OR” associa- tions in GPR models. Examples of different types of GPR associations are illustrated in th e figures of Ref. [4, 14]. 3.2. GPR model structure of S. cerevisiae_ iND750 The in silico model that we used is S. cerevisiae_iND750 [9], a metabolic reconstruction consistin g of th e ch emical reactions that transport and interconvert metabolites within yeast. This network reconstruction was based on a previous reconstruction, termed S. cerevisiae_iFF708 [15]. The general features of S. cerevisiae_iND750 are shown in the Table 1 of Ref. [9]. A SBML format file to the model S. cere- visiae_iND750 can be downloaded from the supplemen- tary information of Ref. [11]. SBML file properties are given in the supplementary of Ref. [9]. The dimensions of rxns, mets, and genes are respectively 1266, 1061, 750. We can use Cytoscape [12] to draw the GPR-network (Figure 7) of S. cerevisiae_ iND750, which contains 3077 nodes and 6666 edges. The minimal media of in silico model is an important aspect. The computational minimal media of S. cere- visiae_iND750 is also included in Ref. [9]. In the method of constraint-based analysis, the biomass objective func- tion (BOF) should be defined. The BOF was generated by defining all of the major and essential constituents that make up the cellular biomass content of S. cerevisiae [9]. Gene-protein-reaction associations embodied in rxnGeneMat matrix, which is a matrix with as many rows as there are reactions in the model and as many columns as there are genes in the model. The i-th row and the j-th column contains a one if the j-th gene in genes is associated with the i-th reaction in rxns and zero otherwise. 3.3. Methodology of constraint-based analysis 3.3.1. Constraint-based analysis In silico modeling and simulation of genome-scale bio- logical systems are different from that practiced in the physicochemical sciences. A network can fundamentally have many different states or many different solutions. Which states (or solutions) are picked is up to the cell and based on the selection pressure experienced, and such choices can change over time. Therefore, con- straint-based approaches [2, 3] to the analysis of com- plex biological systems have proven to be very useful. This difference between the physicochemical sciences and the physical sciences or engineering is illustrated in Ref. [14]. All theory-based considerations (i.e., engi- neering and physics) lead one to attempt to seek an “ex- act” solution, and typically computed based on the laws of physics and chemistry. However, constraint- based considerations (as in biology) are useful. Not only can a network have many different behaviors that are picked based on the evolutionary history of the organism, but 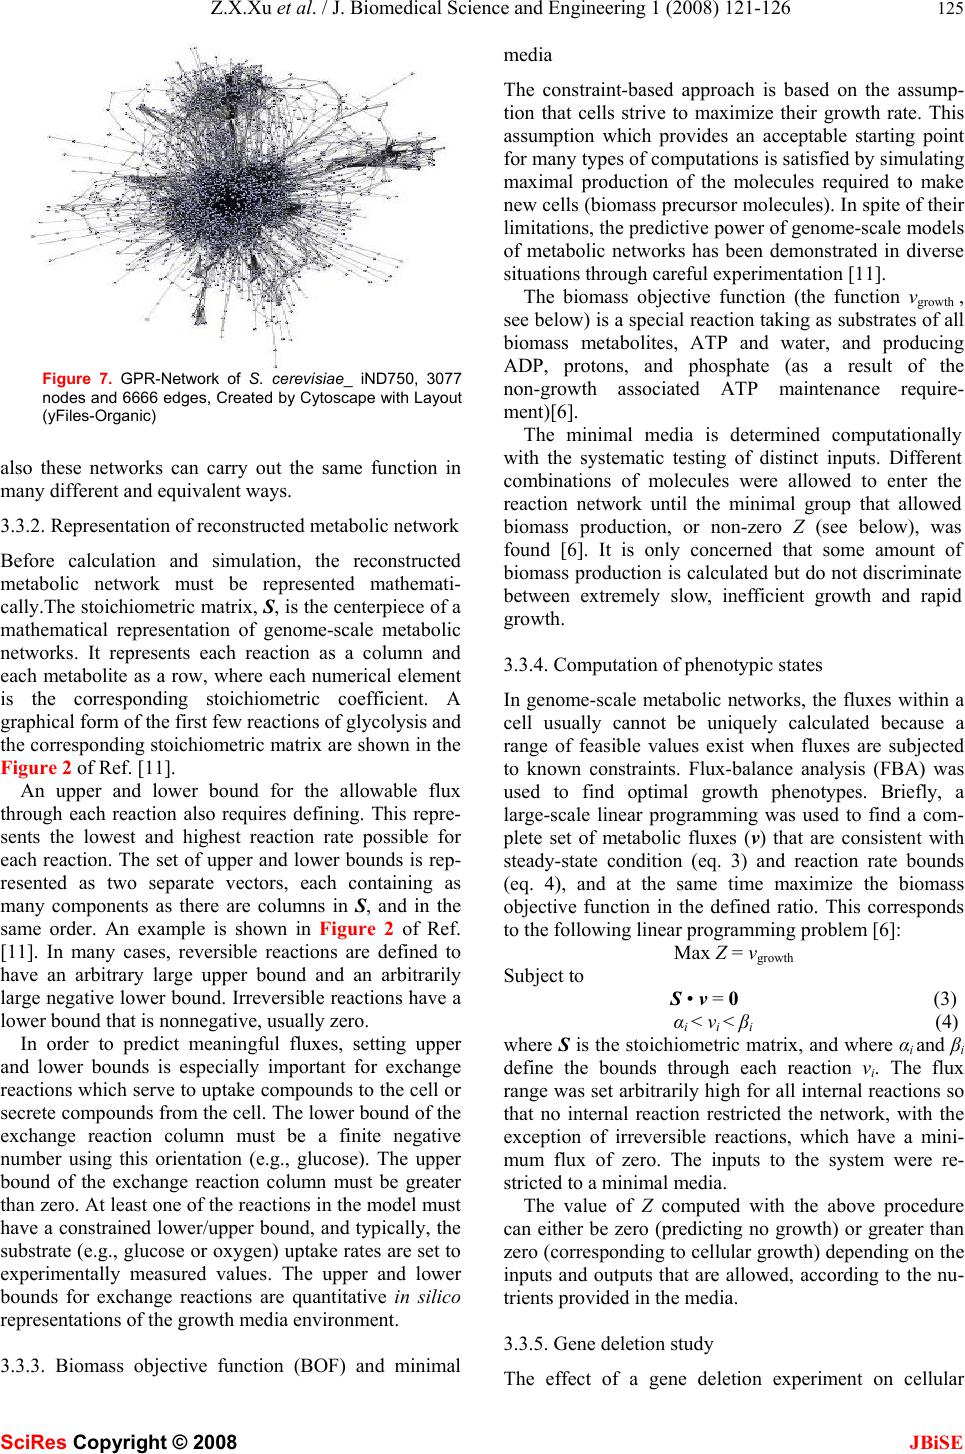 Z.X.Xu et al. / J. Biomedical Science and Engineering 1 (2008) 121-126 125 SciRes Copyright © 2008 JBiSE Figure 7. GPR-Network of S. cerevisiae_ iND750, 3077 nodes and 6666 edges, Created by Cytoscape with Layout (yFiles-Organic) also these networks can carry out the same function in many different and equivalent ways. 3.3.2. Representation of reconstructed metabolic network Before calculation and simulation, the reconstructed metabolic network must be represented mathemati- cally.The stoichiometric matrix, S, is the centerpiece of a mathematical representation of genome-scale metabolic networks. It represents each reaction as a column and each metabolite as a row, where each numerical element is the corresponding stoichiometric coefficient. A graphical form of the first few reactions of glycolysis and the corresponding stoichiometric matrix are shown in the Figure 2 of Ref. [11]. An upper and lower bound for the allowable flux through each reaction also requires defining. This repre- sents the lowest and highest reaction rate possible for each reaction. The set of upper and lower bounds is rep- resented as two separate vectors, each containing as many components as there are columns in S, and in the same order. An example is shown in Figure 2 of Ref. [11]. In many cases, reversible reactions are defined to have an arbitrary large upper bound and an arbitrarily large negative lower bound. Irreversible reactions have a lower bound that is nonnegative, usually zero. In order to predict meaningful fluxes, setting upper and lower bounds is especially important for exchange reactions which serve to uptake compounds to the cell or secrete compounds from the cell. The lower bound of the exchange reaction column must be a finite negative number using this orientation (e.g., glucose). The upper bound of the exchange reaction column must be greater than zero. At least one of the reactions in the model must have a constrained lower /upper bound, and typically, the substrate (e.g., glucose or oxygen) u ptake rates are set to experimentally measured values. The upper and lower bounds for exchange reactions are quantitative in silico representations of the growth media environment. 3.3.3. Biomass objective function (BOF) and minimal media The constraint-based approach is based on the assump- tion that cells strive to maximize their growth rate. This assumption which provides an acceptable starting point for many types of computations is satisfied by simulating maximal production of the molecules required to make new cells (biomass precursor molecules). In spite of their limitations, th e predictive pow er of genome-scale models of metabolic networks has been demonstrated in diverse situations through careful experimentation [11]. The biomass objective function (the function vgrowth , see below) is a special reaction taking as substrates of all biomass metabolites, ATP and water, and producing ADP, protons, and phosphate (as a result of the non-growth associated ATP maintenance require- ment)[6]. The minimal media is determined computationally with the systematic testing of distinct inputs. Different combinations of molecules were allowed to enter the reaction network until the minimal group that allowed biomass production, or non-zero Z (see below), was found [6]. It is only concerned that some amount of biomass production is calculated but do not discriminate between extremely slow, inefficient growth and rapid growth. 3.3.4. Computation of phenotypic states In genome-scale metabolic networks, the fluxes within a cell usually cannot be uniquely calculated because a range of feasible values exist when fluxes are subjected to known constraints. Flux-balance analysis (FBA) was used to find optimal growth phenotypes. Briefly, a large-scale linear programming was used to find a com- plete set of metabolic fluxes (v) that are consistent with steady-state condition (eq. 3) and reaction rate bounds (eq. 4), and at the same time maximize the biomass objective function in the defined ratio. This corresponds to the following linear programming problem [6]: Max Z = vgrowth Subject to S • v = 0 (3) αi < vi < βi (4) where S is the stoichiometric matrix, and where αi and βi define the bounds through each reaction vi. The flux range was set arbitrarily high for all internal reactions so that no internal reaction restricted the network, with the exception of irreversible reactions, which have a mini- mum flux of zero. The inputs to the system were re- stricted to a minimal media. The value of Z computed with the above procedure can either be zero (predicting no growth) or greater than zero (corresponding to cellular growth) depending on the inputs and outputs that are allowed, according to the nu- trients provided in the media. 3.3.5. Ge ne deletion study The effect of a gene deletion experiment on cellular  126 Z.X.Xu et al. / J. Biomedical Science and Engineering 1 (2008) 121-126 SciRes Copyright © 2008 JBiSE growth can be simulated in a manner similar to linear optimization of growth [5, 11]. Gene–reaction associa- tions model the logical relationship between genes and their corresponding reactions. If a single gene is associ- ated with multiple reactions, the deletion of that gene will result in the removal of all associated reactions, i.e. to simultaneously restrict the fluxes (upper and lower flux bounds) of these reactions to zero prior to comput- ing maximal biomass objective function. On the other hand, a reaction that can be catalyzed by multiple non-interacting gene products will not be removed in a single gene deletion. The possible results from a simula- tion of a single gene deletion are unchanged maximal growth (non-lethal), reduced maximal growth or no growth (lethal). Those genes were considered essential if no biomass could be pro d uced without their usage. 4. DISCUSSION Based on the gene-protein-reaction model of S. cere- visiae_iND750 and the methodology of constraint- based analysis and by the aid of the COBRA toolbox and MATLAB software, we have calculated the deletion im- pact of 438 calculable genes, one by one, on the meta- bolic flux re di stributio n of S. cerevisiae_iND750. We found that both of the v-d correlation and the v-gene vcorrelation were not of linear relation. Although some properties about the metabolic network of micro- organisms have been reported in literatures [15-19], our research will provide further evidences to the properties about the metabolic network, because the measure we defined is different. Furthermore, we sought out 38 important genes that most greatly affected the metabolic flux distribution, determined their functional subsystems and found that many of 38 key genes were related to many but not sev- eral subsystems. From these results, we speculate that many but not several subsystems are important subsys- tems in the metabolism of S. cerevisiae and that this may increase the robustness of the metabolic network. As a next step, we will do similar research on other organisms and compare them with the case of E. coli. Although it is theoretically possible to attempt double deletion of every possible gene pair experimentally, the sheer number of possible two-gene deletions makes this virtually impossible. However, computational predict- tions of double gene deletion phenotypes can be made in a matter of hours [11]. This will also become our work in the future. ACKNOWLEDGEMENTS Support for this work was provided by China Postdoctoral Science Foundation (20070420960), Jiangsu Planned Projects for Postdoctoral Research Funds (0701026B), Southeast University Foundation of Sci- ence and Technology (XJ2008318). We thank systems biology research group at UCSD (University of California, San Diego) for providing the COBRA Toolbox and BIGG database, and thank Dr. Nicolo Giorgetti at IEEE for providing the Glpkmex program which is used to solve linear optimization problem. REFERENCES [1] Bork, P. (2005) Is there biological research beyond Systems Biol- ogy? A comparative analysis of terms. Mol. Syst. Biol, 1, Art. No. 2005. 0012. [2] Price ND, Papin JA, Schilling CH, Palsson BO. (2003) Ge- nome-scale microbial in silico models: the constraints-based ap- proach. Trends Biotechnol, 21 (4), 162-169. [3] Price N D, Reed J L, Palsson B O. (2004) Genome-scale models of microbial cells: evaluating the consequences of constraints. Nature Reviews Microbiology, 2(11), 886-897. [4] J.L. Reed, T.D. Vo, C.H. Schilling, and B.O. Palsson. (2003) An expanded genome scale model of Escherichia coli K-12 (iJR904 GSM/GPR). Genome Biology, 4, R54.1– R54.12. [5] Feist, A.M., Henry, C.S., Reed, J.L., Krummenacker, M., Joyce, A.R., Karp, P.D., Broadbelt, L.J., Hatzimanikatis, V., Palsson, B.Ø. (2007) A genome-scale metabolic reconstruction for Escherichia coli K-12 MG1655 that accounts for 1260 ORFs and thermody- namic information. Molecular Systems Biology, 3, Art. No. 121. [6] Scott A Becker, Bernhard Ø Palsson. (2005) Genome-scale recon- struction of the metabolic network in Staphylococcus aureus N315: an initial draft to the two-dimensional annotation. BMC Microbiol, 5, Art. No. 8. [7] Ines Thiele, Thuy D. Vo, Nathan D. Price, and Bernhard Ø. Palsson. (2005) Expanded metabolic reconstruction of Helicobacter pylori (iIT341 GSM/GPR): an in silico genome-scale characterization of single- and double- deletion mutants. Journal of Bacteriology, 187 (16), 5818-5830. [8] Adam M Feist, Johannes C M Scholten, Bernhard Ø Palsson, Fred J Brockman, Trey Ideker. (2006) Modeling methanogenesis with a genome-scale metabolic recon-struction of Methanosarcina barkeri. Molecular Systems Biology, 2, Art. No. 2006.0004. [9] Natalie C. Duarte, Markus J. Herrgård and Bernhard Ø. Palsson. (2004) Reconstruction and validation of Saccharomyces cerevisiae iND750, a fully compartmentalized genome- scale metabolic model . Genome Res, 14 (7), 1298 -1309. [10] Oh YK, Palsson BO, Park SM, Schilling CH, Mahadevan R. (2007) Genome-scale reconstruction of metabolic network in Bacillus subtilis based on high-throughput phenotyping and gene essential- ity data. J Biol Chem, 282 (39), 28791-28799. [11] Becker, S.A., Feist, A.M., Mo, M. L., Hannum, G., Palsson, B.O., Herrgard, M.J. (2007) Quantitative prediction of cellular metabo- lism with constraint-based models: The COBRA Toolbox. Nat. Protocols, 2(3), 727-738. [12] Paul Shannon, Andrew Markiel, Owen Ozier, Nitin S. Baliga, Jonathan T. Wang, Daniel amage, Nada Amin, Benno Schwikowski and Trey Ideker. (2003) Cytoscape: a software en- vironment for integrated models of biomo- lecular interaction networks. Genome Res, 13 (11), 2498-2504. [13] E. Almaas, B. Kova´cs, T. Vicsek, Z. N. Oltvai3& A.-L. Baraba´ si. (2004) Global organization of metabolic fluxes in the bacterium Escherichia coli. Nature, 427 (6997), 839-843. [14] B.O. Palsson . (2006) Systems biology properties of reconstructed networks. Cambri dge university press, Cambridge, New York. [15] Förster, J., Famili, I., Fu, P.C., Palsson, B.Ø., and Nielsen, J. (2003) Genome-scale reconstruction of the Saccharomyces cerevisiae metabolic network. Genome Res, 13(2), 244–253. [16] R. Mahadevan and B. O. Palsson. (2005) Properties of Metabolic Networks: Structure versus Function. Biophysical Journal, 88(1), L07-L09. [17] Bala´zs Papp, Csaba Pa´l , Laurence D. Hurst. (2004) Metabolic network analysis of the causes and evolution of enzyme dispensa- bility in yeast. Nature, 429(6992), 661-664. [18] Iman Famili, Jochen Förster, Jens Nielsen, Bernhard O. Palsson. (2003) Saccharomyces cerevisiae phenotypes can be predicted by using constraint-based analysis of a genome-scale reconstructed metabolic network. Proceedings of the National Academy of Sci- ences of the United States of America, 100(23), 13134-13139. [19] Jochen Förster, Iman Famili, Bernhard Ø. Palsson, Jens Nielsen. (2003) Large-scale evaluation of in silico gene deletions in Sac- charomyces cerevisiae. Omics, 7, 193-202. |