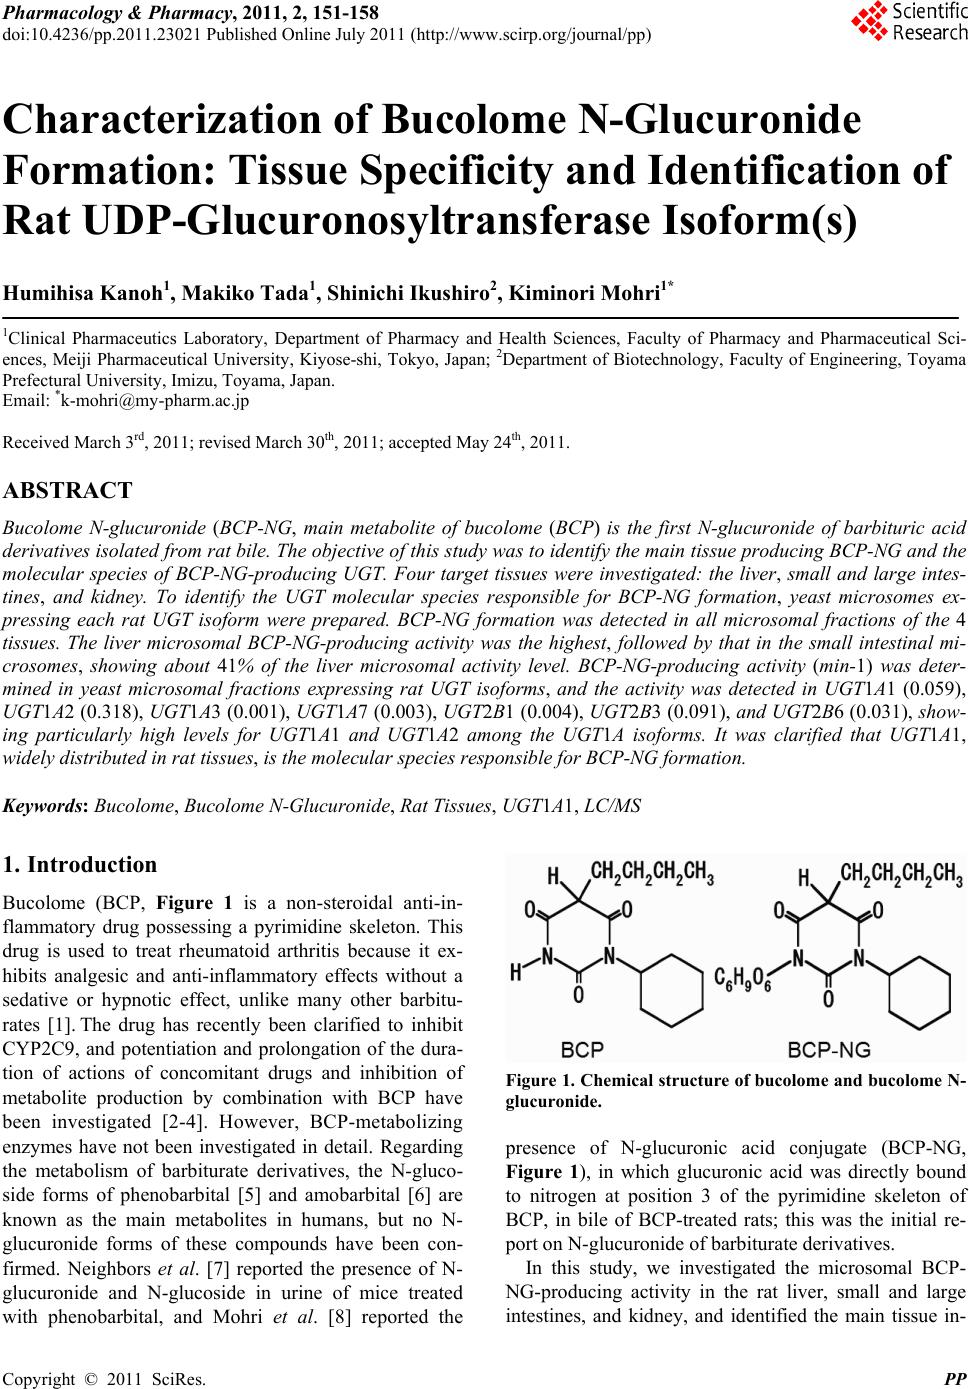
 Pharmacology & Pharmacy, 2011, 2, 151-158 doi:10.4236/pp.2011.23021 Published Online July 2011 (http://www.scirp.org/journal/pp) Copyright © 2011 SciRes. PP 151 Characterization of Bucolome N-Glucuronide Formation: Tissue Specificity and Identification of Rat UDP-Glucuronosyltransferase Isoform(s) Humihisa Kanoh1, Makiko Tada1, Shinichi Ikushiro2, Kiminori Mohri1* 1Clinical Pharmaceutics Laboratory, Department of Pharmacy and Health Sciences, Faculty of Pharmacy and Pharmaceutical Sci- ences, Meiji Pharmaceutical University, Kiyose-shi, Tokyo, Japan; 2Department of Biotechnology, Faculty of Engineering, Toyama Prefectural University, Imizu, Toyama, Japan. Email: *k-mohri@my-pharm.ac.jp Received March 3rd, 2011; revised March 30th, 2011; accepted May 24th, 2011. ABSTRACT Bucolome N-glucuronide (BCP-NG, main metabolite of bucolome (BCP) is the first N-glucuronide of barbituric acid derivatives isolated from rat bile. The objective of this study wa s to identify the ma in tissue producing BCP-NG and the molecular species of BCP-NG-producing UGT. Four target tissues were investigated: the liver, small and large intes- tines, and kidney. To identify the UGT molecular species responsible for BCP-NG formation, yeast microsomes ex- pressing each rat UGT isoform were prepared. BCP-NG formation was detected in all microsomal fractions of the 4 tissues. The liver microsomal BCP-NG-producing activity was the highest, followed by that in the small intestinal mi- crosomes, showing about 41% of the liver microsomal activity level. BCP-NG-producing activity (min-1) was deter- mined in yeast microsomal fractions expressing rat UGT isoforms, and the activity was detected in UGT1A1 (0.059), UGT1A2 (0.318), UGT1A3 (0.001), UGT1A7 (0.003), UGT2B1 (0.004), UGT2B3 (0.091), and UGT2B6 (0.031), show- ing particularly high levels for UGT1A1 and UGT1A2 among the UGT1A isoforms. It was clarified that UGT1A1, widely distributed in rat tissues, is the molecular species responsible for BCP-NG formation. Keywords: Bucolome, Bucolome N-Glucuronide, Rat Tissues, UGT1A1, LC/MS 1. Introduction Bucolome (BCP, Figure 1 is a non-steroidal anti-in- flammatory drug possessing a pyrimidine skeleton. This drug is used to treat rheumatoid arthritis because it ex- hibits analgesic and anti-inflammatory effects without a sedative or hypnotic effect, unlike many other barbitu- rates [1]. The drug has recently been clarified to inhibit CYP2C9, and potentiation and prolongation of the dura- tion of actions of concomitant drugs and inhibition of metabolite production by combination with BCP have been investigated [2-4]. However, BCP-metabolizing enzymes have not been investigated in detail. Regarding the metabolism of barbiturate derivatives, the N-gluco- side forms of phenobarbital [5] and amobarbital [6] are known as the main metabolites in humans, but no N- glucuronide forms of these compounds have been con- firmed. Neighbors et al. [7] reported the presence of N- glucuronide and N-glucoside in urine of mice treated with phenobarbital, and Mohri et al. [8] reported the Figure 1. Chemical structure of bucolome and bucolome N- glucuronide. presence of N-glucuronic acid conjugate (BCP-NG, Figure 1), in which glucuronic acid was directly bound to nitrogen at position 3 of the pyrimidine skeleton of BCP, in bile of BCP-treated rats; this was the initial re- port on N-glucuronide of barbiturate derivatives. In this study, we investigated the microsomal BCP- NG-producing activity in the rat liver, small and large intestines, and kidney, and identified the main tissue in-  Characterization of Bucolome N-Glucuronide Formation: Tissue Specificity and Identification of Rat UDP-Glucuronosyltransferase Isoform(s) 152 volved in the metabolism. In addition, we investigated BCP-NG-producing activities of 10 molecular species of rat UGT (UGT1A1, 1A2, 1A3, 1A5, 1A6, 1A7, 2B1, 2B3, 2B6, and 2B12) using yeast microsomal fractions expressing these species and identified the isoforms pos- sessing such activity. The activity was detected in UGT1A1, 1A2, 1A3, 1A7, 2B1, 2B3, and 2B6. 2. Methods 2.1. Chemicals BCP was synthesized from cyclohexylurea (Tokyo Che- mical Industry Co., Ltd., Tokyo) and n-butylmalonate (Tokyo Chemical Industry) employing the method re- ported by Senda et al. [1] BCP-NG was prepared as pre- viously reported [8]. Lubrol WX, p-nitrophenol (p-NP), p-nitrophenol glucuronide (p-NP-G), bovine serum al- bumin (BSA), and phenylmethylsulfonyl fluoride (PMSF) were purchased from Sigma-Aldrich Co. (St. Louis, MO). Phenylbutazone (PBZ, internal standard (I.S.)), D-glu- cose, L-histidine, and bicinchoninic acid (BCA) protein assay reagent were purchased from Nacalai Tesque Inc. (Kyoto), and dimethylsulfoxide (DMSO) and ethanol (EtOH) were purchased from Wako Pure Chemical In- dustries Ltd. (Osaka). Alamethicin was purchased from Enzo Life Sciences Inc. (New York). Hind III and pTA vector were purchased from Toyobo Co., Ltd. (Osaka). Amino acid-free yeast nitrogen base was purchased from Funakoshi Corp. BCP and PBZ adjusted to 1 mg/ml with DMSO were used as standard solutions and diluted with solvent at the time of use. Reagents were stored at –30˚C and used within 3 months. All chemical reagents used were analytical or guaranteed grade. Water distilled twice was used for the experiments. Rats (male Wistar- ST weighing 235 g - 285 g, clean) were purchased from Japan SLC Inc. (Shizuoka). Rats were housed in stainless steel cages at 3 animals per cage and maintained in a room controlled at 24˚C - 26˚C under a 12-hour lighting cycle. 2.2. Preparation of Microsomes of Each Tissue All animal procedures were approved by Meiji Pharma- ceutical University Committee for Ethics of Experimen- tation and Animal Care (approved No.2304). Micro- somes of each tissue were prepared from 6 rats. Under ether anesthesia, the liver, small and large intestines, and kidney were excised from rats. Blood was removed from each tissue by perfusion with ice-cold 1.15% KCl. Each tissue was cut into pieces in 0.25 M sucrose-containing 10 mM Tris-HCl buffer (pH 7.4), homogenized in a glass homogenizer, and adjusted to 20% (w/v). The small and large intestines were prepared with PMSF as previously reported [9]. The homogenates were centrifuged at 4˚C for 10 minutes at 700 g, followed by centrifugation at 10,000 g for 10 minutes. The supernatant was further centrifuged at 105,000 g for 60 minutes. The pellet was resuspended with the same Tris-HCl buffer and centri- fuged at 105,000 g for 60 minutes. The pellet was then resuspended with 100 mM Tris-HCl buffer (pH 7.4) containing 20% (w/v) glycerol and 10 mM EDTA. The suspension was aliquoted into 1.5 ml plastic tubes at 500 μl/tube and stored at –80˚C. All procedures were per- formed at 4˚C. The microsomal protein concentrations were measured by the method of Lowry et al. [10] or BCA protein assay reagent [11] using bovine serum al- bumin (BSA) as the standard. 2.3. Expression of Rat UDP-Glucuronosyltransferase Family 1 and 2 Isoforms in Yeast Recombinant rat UGT isoforms were expressed in AH22 yeast cell as previously described [12]. The cDNA of rat UGTs 1A1, 1A2, 1A3, 1A5, 1A6, and 1A7 was cloned in previous works [13-15]. The cDNA of rat UGTs 2B1, 2B3, 2B6, and 2B12 was isolated by RT-PCR from total liver RNA of Wistar rat using the set of primers de- scribed below. 2B1: forward, cccaagcttaaaaaatgtctatgaaacagacttca, reverse, cccaagcttctactctttcttcttctttcccatgttacg; 2B3: forward, cccaagcttaaaaaatgcctgggaagtggatttct, reverse, cccaagcttctactcattcttcattttcttttccttctt; 2B6: forward, cccaagcttaaaaaatgccaggaaaatggattttt, reverse, cccaagcttctactcattcttcattttcttttgdttctt; 2B12: forward, cccaagcttaaaaaatgtctgggaagtggatttct, reverse, cccaagcttctactcattctttgttttcttttccttctt. The pGYR vector with glyceraldehyde 3-phosphate dehydrogenase promoter and terminator was used for the expression of rat UGT isoforms [16]. To insert the UGTcDNA into the pGYR yeast expression vector, the sense primer upstream of each first ATG included a Hind III site and the antisense primer downstream from the stop codon contained a Hind III site. The amplified full-length DNA was subcloned into the pTA vector (TOYOBO, Japan) and sequenced in both directions to confirm each UGT2B isoform. After the point mutational changes of internal Hind III site in some UGT isoforms, HindIII digested fragments were ligated into the Hind III site of the pGYR1 expression vector. Yeast transforma- tions with pGYR were performed by the lithium acetate method [16]. Each transformant, AH22/pGYR-UGT, was selected by the complementation of lue2 auxotro- phy. 2.4. Preparation of Yeast Microsomes The yeast transformants with pGYR containing UGT C opyright © 2011 SciRes. PP  Characterization of Bucolome N-Glucuronide Formation: Tissue Specificity and Identification of Rat UDP-Glucuronosyltransferase Isoform(s) 153 isoforms were cultivated in synthetic minimal (SD) medium (2% (w/v) D-glucose and 0.67% (w/v) yeast nitrogen base without amino acids) supplemented with 20 mg/l histidine. Rat UGT containing microsomal fractions of yeast was prepared by the method of Oeda et al. [17]. The protein concentration of the microsomes was determined with the bicinchoninic acid (BCA) protein assay reagent (Nacalai Chemical Co., Japan) using bovine serum albumin (BSA) as a standard. 2.5. Immunoblot Analysis Yeast microsomes were subjected to SDS-PAGE through 10% acrylamide gel [12]. The resulting polypeptide bands were transferred to nitrocellulose membranes, and polyclonal antibodies against the UGT isoforms were used for detecting the immunoreactive bands. Anti- UGT1A and anti-UGT2B antibodies can recognize the C-terminal region, that is, 516GKGRVKKSHKSKTH529 and 355KWIPQNDLLGHPKT368, as described pre- viously [18,19]. The content of expressed rat UGT in yeast microsomes was estimated using a bacterially expressed maltose binding protein (MBP) fused with UGT proteins as a standard [19]. The MBP-UGT fusion proteins containing C-terminal residues of rat UGT1A1 (MBP-UGT1AC; Met 307-His 530 of rat UGT1A1) and UGT2B3 (MBP-UGT2B3C; Met 313-Glu 530 of UGT2B3) were constructed using pMAL-c2 expression vector (New England Biolabs). The fusion proteins were purified by amylose-conjugated affinity chromatography. The concentration of the standard proteins (MBP- UGT1AC, 68 kDa; MBP-UGT2B3C, 68 kDa) was esti- mated by bicinchoninic acid protein assay. 2.6. HPLC Apparatus and Chromatographic Conditions For the HPLC system and measurements of BCP and BCP-NG, the method previously reported by Mohri et al. [20] was used with modifications. An HPLC system of JASCO Corporation was used, and data was processed using JASCO chromatograph data station, Chrom NAV. The detector was set at 268 nm using a sensitivity of 0.005 absorbance units full scale (a.u.f.s.). BCP, I.S. and BCP-NG were separated on a reverse-phase Capcell Pak C18 octadecylsilane (ODS) column (SG 120) [6.0 mm (inside diameter, i.d.) × 150 mm; particle size, 5 µm] (Shiseido Co. Ltd., Tokyo) equipped with a guard column packed with the same resin [4.6 mm i.d. × 10 mm]. The mobile phase (0.05 M phosphate buffer (pH 5.7): MeOH:THF, 50:40:4, v/v/v) was pumped through the column at 1.5 ml/min. Retention times of BCP, I.S., and BCP-NG were 7.2, 9.9, and 12.9 min. respectively. For the mobile phase, 0.05 M phosphate buffer (pH 5.7): MeOH:THF = 50:40:4 (v/v/v) was used at a flow rate of 1.5 ml/min for sample analysis. Regarding linearity of BCP and BCP-NG calibration curves (0 - 100 µM), the correlation coefficient (r) was greater than 0.99. The detection limits of BCP and BCP-NG were 0.25 and 0.06 ng, respectively. All HPLC measurements were perform- ed at 23˚C. All sample analyses were repeated 3 times. 2.7. LC/MS Analysis of BCP-NG The entire LC/MS system and all columns were products of Shimadzu Co. (Kyoto). Shimadzu mass spectrometric analysis system LC/MS-2010EV equipped with the following devices was used: pump for LC/MS, LC- 20AB; autosampler, SIL-20A; deairing device, DGU- 20A5; column oven, CTO-20SA; and system controller, CBM-20A. Using Shim-pack VP-ODS (2.0 mm i.d. × 150 mm) and guard column GVP-ODS at an oven temperature of 40˚C, analysis was performed employing the ESI negative ion mode under the following condi- tions: mobile phase flow rate, 0.2 ml/min; N2 gas flow rate, 1.5 l/min; probe voltage, 1.5 kv; probe temperature, 250˚C; CDL voltage, 20.0 V; and block temperature, 200˚C. In elution from reverse-phase HPLC employing flow injection, the proportions of the mobile phase components: A = 0.1% formic acid and B = acetonitrile, were changed in a linear gradient from A:B = 7.3 at 0 minute to A:B = 4:4 at 5 minutes and then increased to A:B = 2:8 in a linear gradient. This proportion was main- tained for 5 minutes, and the proportion of acetonitrile was then reduced to A:B = 7:3 in a stepwise gradient and maintained for 6 minutes. On ion detection employing the ESI method, BCP (m/z 265), BCP-NG (m/z 441.20), and PBZ (I.S. m/z 307) were detected. The peak retention times of PBZ (I.S. m/z 307) and BCP-NG (m/z 441.20) were about 13.9 and 9.8 min, respectively. The correlation coefficient (r) representing linearity of the calibration curve was greater than 0.99 within a range of 1.67 ng/ml to 2.09 μg/ml. The detection limit of BCP- NG was 16.7 pg. 2.8. BCP-NG Activity in Each Tissue of Rats Reaction solutions were prepared by combining micro- somes of the rat tissues solubilized with lubrol (final con- centration: 0.1 mg/ml) (liver, small and large intestines, and kidney, 2 mg/ml microsomal protein) with MgCl2 (final concentration: 8 mM), saccharolactone (final concentration: 4 mM), BCP (final concentration: 2 mM), 0.5 M Tris-HCl (pH 7.4) (final concentration: 0.2 mM), and UDP-Ga (final concentration: 8 mM), adjusting the total volume to 250 μl. After preincubation of the re- action solutions at 37˚C for 5 minutes, UDP-Ga or BCP was added to start the enzyme reaction. After incubation Copyright © 2011 SciRes. PP  Characterization of Bucolome N-Glucuronide Formation: Tissue Specificity and Identification of Rat UDP-Glucuronosyltransferase Isoform(s) 154 at 37˚C for 20 minutes, the reaction was stopped by adding 0.25 g of ammonium sulfate, followed by the addition of 200 µl of EtOH solution containing 24 µM phenylbutazone (PBZ, I.S.) and vigorous stirring for 1 minute. The mixture was then centrifuged at 18,000 g for 10 minutes, and 150 µl of the supernatant was combined with 10 µl of 0.1% NaHCO3. Ten µl of this solution was directly injected onto the HPLC. The level of BCP-NG formed by the enzyme reaction was determined from the BCP calibration curve as previously reported [9]. All measurements were repeated 3 times. 2.9. BCP-NG Activities of Rat Recombinant UGT Isoform Microsomes Ten isoforms of rat microsomal UGT (1 mg/ml microso- mal protein) were solubilized by adding alamethicin (0.025 mg/ml DMSO solution). The enzyme reaction was performed as in the experiment using rat liver micro- somes. The reaction was stopped by adding 500 μl of chloroform. The reaction mixtures were vigorously mixed by vortex mixer and then centrifuged at 18,000 g for 10 minutes. To 150 μl of the supernatant, the same volume of 5 μM PBZ acetonitrile solution was added and mixed vigorously, followed by centrifugation at 18,000 g for 10 minutes. Fifty μl of the supernatant was combined with 5 volumes of acetonitrile, mixed vigorously for 30 seconds, and centrifuged at 18,000 g for 10 minutes. Ten μl of the supernatant was directly injected onto the LS/ MS system. All measurements were repeated 3 times. 2.10. Data Analysis For post-hoc multiple comparison of 3 or more groups, Scheffe’s test was employed. Using JMP® Statistical Figure 2. BCP N-glucuronidation activities in microsomes from rat liver, small intestine, large intestine, and kidney. Each point and vertical bar represent the mean and s.d. (n = 3). *p < 0.05 was regarded as significant. Discovery Software (SAS Institute Japan Ltd., Tokyo), p < 0.05 was regarded as significant (*). 3. Results 3.1. Tissue Distribution of UGT Activities Responsible for BCP N-Glucuronidation BCP-NG activity (nmol/mg/min) was detected in micro- somal fractions of all 4 rat tissues: liver (0.44 ± 0.09), small intestine (0.18 ± 0.01), large intestine (0.02 ± 0.004), and kidney (0.06 ± 0.004) (Figure 2). Of these 4 tissues, the highest BCP-NG-producing activity detected in liver microsomes was about 22 times higher than the lowest activity detected in large intestinal epithelial cell microsomes. Regarding the activity in the liver as 1, the activity level decreased in the order of small intestine (0.41), kidney (0.14), and large intestine (0.05). 3.2. Expression of Rat UDP-Glucuronosyltransferase Family 1 and 2 Isoforms in Yeast Cells To examine the ability of rat UGT family 1 and 2 iso- forms to form BCP-NG, the cDNAs cloned into the yeast expression vector pGYR were expressed in AH22 yeast cells. Rat UGT family 1 isoforms (UGT1A1, 1A2, 1A3, 1A5, 1A6, and 1A7) and family 2 isoforms (UGT2B1, 2B3, 2B6, and 2B12) were expressed in yeast AH22 cells, (a) (b) Figure 3. Western blot analysis of rat UDP-glucuronosyl- transferase isoforms expressed on AH22 yeast cells. Immu- noreaction was performed using antibodies against the common sequence of UGT1A family (Panel a) 3: UGT1A1, 4: UGT1A2, 5: UGT1A3, 6: UGT1A5, 7: UGT1A6, 8: UGT1A7, and against UGT2B (Panel b) 1: UGT2B1, 2: UGT2B3, 3: UGT2B6, 4: UGT2B12. Rat liver microsomes and yeast microsomes with mock pGYR vector were used for positive (lane 1 in Panel a) and negative (lane 2 in Panel a) controls, respectively. C opyright © 2011 SciRes. PP 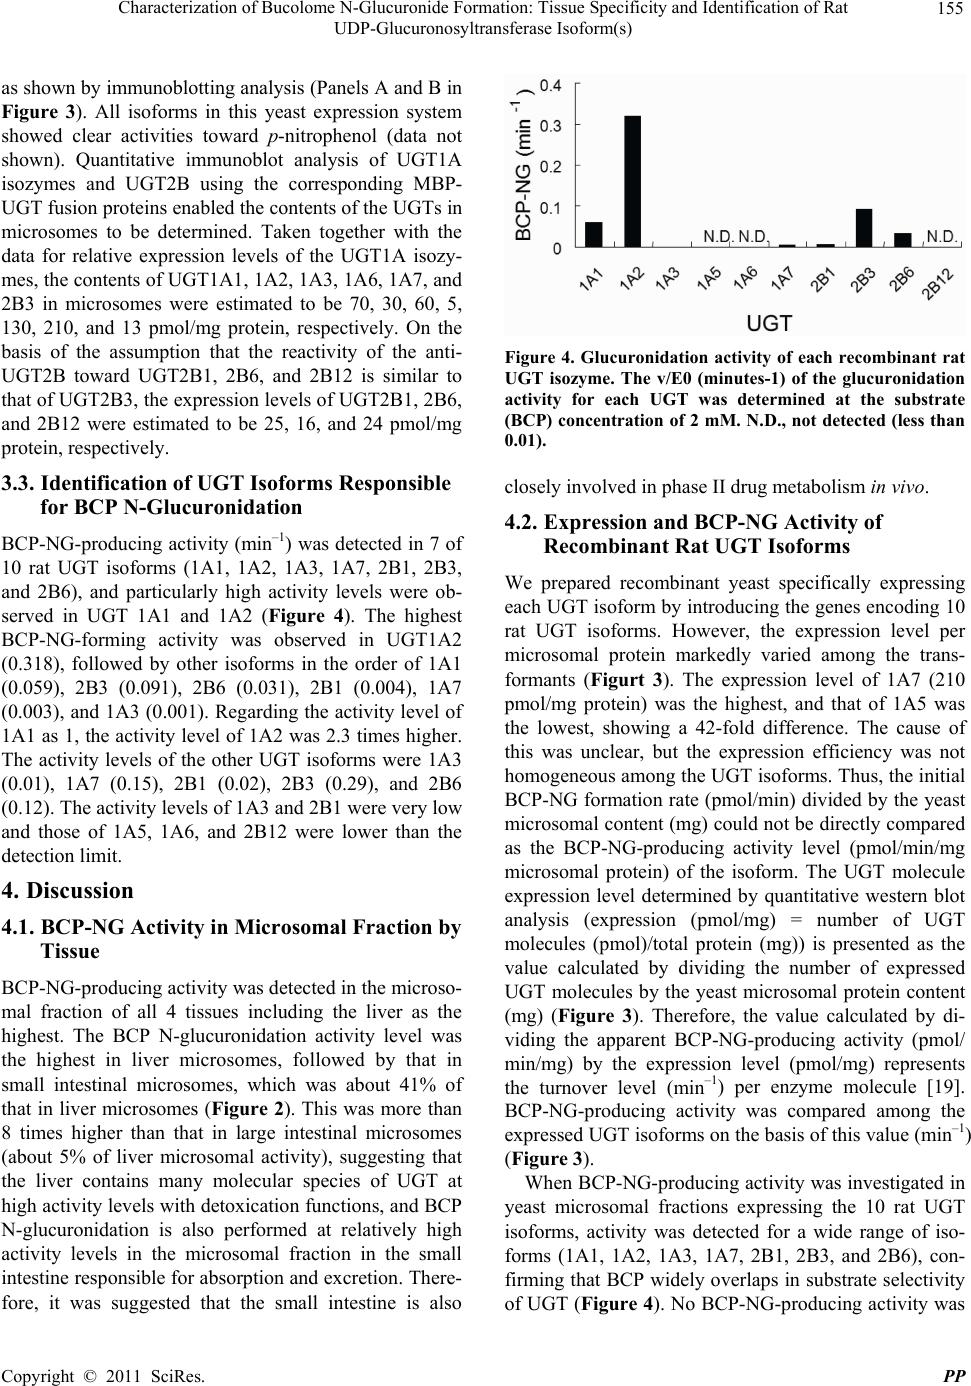 Characterization of Bucolome N-Glucuronide Formation: Tissue Specificity and Identification of Rat UDP-Glucuronosyltransferase Isoform(s) 155 as shown by immunoblotting analysis (Panels A and B in Figure 3). All isoforms in this yeast expression system showed clear activities toward p-nitrophenol (data not shown). Quantitative immunoblot analysis of UGT1A isozymes and UGT2B using the corresponding MBP- UGT fusion proteins enabled the contents of the UGTs in microsomes to be determined. Taken together with the data for relative expression levels of the UGT1A isozy- mes, the contents of UGT1A1, 1A2, 1A3, 1A6, 1A7, and 2B3 in microsomes were estimated to be 70, 30, 60, 5, 130, 210, and 13 pmol/mg protein, respectively. On the basis of the assumption that the reactivity of the anti- UGT2B toward UGT2B1, 2B6, and 2B12 is similar to that of UGT2B3, the expression levels of UGT2B1, 2B6, and 2B12 were estimated to be 25, 16, and 24 pmol/mg protein, respectively. 3.3. Identification of UGT Isoforms Responsible for BCP N-Glucuronidation BCP-NG-producing activity (min–1) was detected in 7 of 10 rat UGT isoforms (1A1, 1A2, 1A3, 1A7, 2B1, 2B3, and 2B6), and particularly high activity levels were ob- served in UGT 1A1 and 1A2 (Figure 4). The highest BCP-NG-forming activity was observed in UGT1A2 (0.318), followed by other isoforms in the order of 1A1 (0.059), 2B3 (0.091), 2B6 (0.031), 2B1 (0.004), 1A7 (0.003), and 1A3 (0.001). Regarding the activity level of 1A1 as 1, the activity level of 1A2 was 2.3 times higher. The activity levels of the other UGT isoforms were 1A3 (0.01), 1A7 (0.15), 2B1 (0.02), 2B3 (0.29), and 2B6 (0.12). The activity levels of 1A3 and 2B1 were very low and those of 1A5, 1A6, and 2B12 were lower than the detection limit. 4. Discussion 4.1. BCP-NG Activity in Microsomal Fraction by Tissue BCP-NG-producing activity was detected in the microso- mal fraction of all 4 tissues including the liver as the highest. The BCP N-glucuronidation activity level was the highest in liver microsomes, followed by that in small intestinal microsomes, which was about 41% of that in liver microsomes (Figure 2). This was more than 8 times higher than that in large intestinal microsomes (about 5% of liver microsomal activity), suggesting that the liver contains many molecular species of UGT at high activity levels with detoxication functions, and BCP N-glucuronidation is also performed at relatively high activity levels in the microsomal fraction in the small intestine responsible for absorption and excretion. There- fore, it was suggested that the small intestine is also Figure 4. Glucuronidation activity of each recombinant rat UGT isozyme. The v/E0 (minutes-1) of the glucuronidation activity for each UGT was determined at the substrate (BCP) concentration of 2 mM. N.D., not detected (less than 0.01). closely involved in phase II drug metabolism in vivo. 4.2. Expression and BCP-NG Activity of Recombinant Rat UGT Isoforms We prepared recombinant yeast specifically expressing each UGT isoform by introducing the genes encoding 10 rat UGT isoforms. However, the expression level per microsomal protein markedly varied among the trans- formants (Figurt 3). The expression level of 1A7 (210 pmol/mg protein) was the highest, and that of 1A5 was the lowest, showing a 42-fold difference. The cause of this was unclear, but the expression efficiency was not homogeneous among the UGT isoforms. Thus, the initial BCP-NG formation rate (pmol/min) divided by the yeast microsomal content (mg) could not be directly compared as the BCP-NG-producing activity level (pmol/min/mg microsomal protein) of the isoform. The UGT molecule expression level determined by quantitative western blot analysis (expression (pmol/mg) = number of UGT molecules (pmol)/total protein (mg)) is presented as the value calculated by dividing the number of expressed UGT molecules by the yeast microsomal protein content (mg) (Figure 3). Therefore, the value calculated by di- viding the apparent BCP-NG-producing activity (pmol/ min/mg) by the expression level (pmol/mg) represents the turnover level (min–1) per enzyme molecule [19]. BCP-NG-producing activity was compared among the expressed UGT isoforms on the basis of this value (min–1) (Figure 3). When BCP-NG-producing activity was investigated in yeast microsomal fractions expressing the 10 rat UGT isoforms, activity was detected for a wide range of iso- forms (1A1, 1A2, 1A3, 1A7, 2B1, 2B3, and 2B6), con- firming that BCP widely overlaps in substrate selectivity of UGT (Figure 4). No BCP-NG-producing activity was Copyright © 2011 SciRes. PP  Characterization of Bucolome N-Glucuronide Formation: Tissue Specificity and Identification of Rat UDP-Glucuronosyltransferase Isoform(s) 156 detected for 1A5, 1A6, or 2B12, although these were expressed at the second highest level. 4.3. Liver Microsomal BCP-NG Activity When the isoforms with BCP-NG-producing activity were arranged in order of UGT mRNA level in the liver, highest first, as reported by Vansell et al. [21], the order was as follows: UGT2B1, UGT1A1, UGT2B6, UGT1A7, and UGT2B3. It was reported that the mRNA levels of UGT1A2 and UGT1A3 in the liver were lower than the detection limit. The BCP-NG-producing activity level of UGT1A2 was 2.3 times higher than that of 1A1, but in consideration of the mRNA expression ratio, it was con- cluded that UGT1A1 is most likely to be the UGT1A subfamily mainly involved in BCP-NG formation in the rat liver. BCP-NG-producing activity was also observed in the UGT 2B subfamily (UGT2B1, 2B3, and 2B6), although the activity level was low (the total activity level of UGT2B1, 2B3, and 2B6 was about 1/2 and 1/5 of those of A1 and 1A2, respectively). UGT2B1 has been reported to be the most abundant UGT isoform in the rat liver (21), suggesting that UGT2B1 also contributes to BCP-NG formation. Shelby et al. [22] reported on the UGT isoform distri- bution at the mRNA level in 10 rat tissues (liver, kidney, lung, stomach, duodenum, jejunum, ileum, large intestine, cerebellum, and cerebral cortex), in which 3 UGT iso- forms (UGT1A1, UGT1A6, and UGT2B12) were de- tected in many tissues, but the distributions of other UGT isoforms were tissue-specific. However, UGT1A6 and UGT2B12 showed no BCP-NG-producing activity. They also reported that mRNAs of UGT1A2, UGT1A3, and UGT1A7, which showed BCP-NG-producing activity in our study, were mainly present in the digestive tract, and their expressions were very low in the liver. Furthermore, they confirmed that UGT2B1, UGT2B2, UGT2B3, UGT2B6, and UGT2B12 of the UGT 2B subfamily were expressed mainly in the liver [22], in which the total mRNA expression level of UGT2B1, UGT2B3, and UGT2B6, which showed BCP-NG-producing activity in our study, was lower than that of UGT1A1. We previously reported that the liver microsomal BCP-NG activity levels in UGT1A family-deficient Gunn rats [23] was lower than 8.5% of that in normal rats, and BCP-NG formation activities in phenobarbital- and clofibric acid-pretreated microsomes were 1.5- and 1.6-fold higher than those in untreated microsomes, re- spectively [24]. On the basis of these findings of mRNA expression level [22] and BCP-NG-producing activity, the main UGT isoform responsible for BCP-NG forma- tion in the rat liver may be UGT1A1, and UGT2B1, UGT2B3, and UGT2B6 may be supplementarily in- volved. 4.4. Small Intestinal Microsomal BCP-NG Activity The contribution of small intestinal epithelial cells to drug metabolism has recently been discussed. However, drug-metabolizing activity varies depending on the me- thod of preparing the microsomal fraction of intestinal epithelial cells, to which attention should be paid [9]. It has been reported that the mRNA expression level of the UGT1A subfamily (UGT1A1, UGT1A2, UGT1A3, and UGT1A7) is high in the rat small intestine, whereas that of the UGT 2B subfamily (UGT2B1, UGT2B3, and UGT2B6) is low [22]. In the UGT 2B subfamily, the mRNA expression level of UGT2B3 was the highest, but this was lower than that of UGT1A3, which was expressed at the lowest mRNA level among the UGT 1A subfamily. Considering that the reported UGT mRNA levels expressed in the small intestine and BCP-NG- producing activity observed in our study, it was suggest- ed that the main BCP-NG-producing UGT isoforms in the rat small intestine are UGT1A1 and UGT1A2, and UGT1A3, UGT1A7, UGT2B1, UGT2B3, and UGT2B6 may be supplementarily involved. 4.5. Large Intestinal Microsomal BCP-NG Activity In the large intestine, mRNA expression of all isoforms of the UGT1A subfamily has been confirmed [22], and the expression level of UGT1A1 was the highest, fol- lowed by UGT1A7 expressed at a level less than 1/2 of that of UGT1A1 [22]. The mRNA expression level of the UGT2B subfamily in the large intestine has been re- ported to be lower than the detection limit [22]. su- ggesting that the main UGT isoform responsible for BCP-NG formation in the large intestine is UGT1A1, and UGT1A2, UGT1A3, and UGT1A7 are supplementa- rily involved. 4.6. Renal Microsomal BCP-NG Activity Microsomal activity level was also observed in the kid- ney, and it was about 14% of that in the liver, suggesting that the kidney is also responsible for some parts of drug metabolism, similarly to the small intestine. It has been reported that the UGT1A1 mRNA expression level was the highest, whereas those of the other UGT were 1/80 or lower in the kidney [22]. Considering that the mRNA expression level of UGT1A2, possessing the highest BCP-NG-producing activity among the isoforms, was lower than the detection limit in the kidney, UGT1A was assumed to be the isoform responsible for BCP-NG for- mation in the kidney. C opyright © 2011 SciRes. PP  Characterization of Bucolome N-Glucuronide Formation: Tissue Specificity and Identification of Rat UDP-Glucuronosyltransferase Isoform(s) 157 5. Conclusions BCP-NG-producing activity was detected in 4 tissues in rats. The main tissues were the liver and small intestine, but the kidney was also assumed to contribute to BCP- NG formation. UGT1A1 was the main BCP-NG-pro- ducing isoform in all 4 tissues, and the other UGT iso- forms (1A2, 1A3, 1A7, 2B1, 2B3, and 2B6) were sup- plementarily involved in the formation in an tissue-spe- cific manner. This is the first report in which the UGT isoforms involved in the N-glucuronidation of barbitu- rate derivatives have been identified in rats. This research received no specific grant from any funding agency in the public, commercial, or not-for- profit sectors. 6. References [1] S. Senda, H. Izumi and H. Fujimura, “On Uracil Deriva- Tives and Related Compounds. 6,5-alkyl-2,4,6-Trioxo-Per Hydrophyrimidine Derivatives as Antiphlogistics,” Arz- neimittel Forschung, Vol. 17, No. 12, 1967, pp. 1519-1523. [2] N. Takamura, T. maruyama, E. Chosa, K. Kawai, Y. Tsutsumi, Y. Uryu, K. Yamasaki, T. Deguchi and M. Otagiri, “Bucolome, a Potent Binding Inhibitor for Fu- Rosemide, Alters the Pharmacokinetics and Diuretic Ef- fect of Furosemide: Potential for Use of Bucolome to Re- store Diuretic Response in Nephrotic Syndrome,” Drug Metabolism and Disposition, Vol. 33, No. 4, 2005, pp. 596-602. [3] M. Osawa, N. Hada, K. Matsumoto, T. Hasegawa, D. Kobayashi, Y. Morimoto, M. Yamaguchi, I. Kanamoto, T. Nakagawa and K. Sugibayashi, “Usefulness of Coadmin- Istration of Bucolome in Warfarin Therapy: Pharmacoki- Netic and Pharmacodynamic Analysis Using Outpatient Prescriptions,” Internal Journal of Pharmaceutics, Vol. 293, No.1-2, 2005, pp. 43-49. doi:10.1016/j.ijpharm.2004.12.009 [4] M. Kobayashi, M. Takagi, K. Fukumoto, R. Kato, K. Tanaka and K. Ueno, “The Effect of Bucolome, a CYP2C9 Inhibitor, on the Pharmacokinetics of Losartan,” Drug Metabolism and Disposition, Vol. 23, No. 2, 2008, pp. 115-119. doi:10.2133/dmpk.23.115 [5] B. K. Tang, W. Kalow and A. A. Grey, “Metabolic Fate of Phenobarbital in Man N-Glucoside Formation,” Drug Metabolism and Disposition, Vol. 5, No. 5, 1979, pp. 315-318. [6] B. K. Tang, W. Kalow and A. A. Grey, “Amobarbital Metabolism in Man: N-Glucoside Formation,” Research Communications in Chemical Pathology and Pharmacol- Ogy, Vol. 21, No. 1, 1978, pp. 45-53. [7] S. M. Neighbors and W. H. Soine, “Identification of Phenobarbital N-Glucuronides as Urinary Metabolites of Phenobarbital in Mice,” Drug Metabolism and Disposi- tion, Vol. 23, No. 5, 1995, pp. 548-552. [8] K. Mohri, T. Uesugi, and K. Kamisaka, “Bucolome N- Glucuronide: Purification and Identification of a Major Metabolite of Bucolome in Rat Bile,” Xenobiotica, Vol. 15, No. 7, 1985, pp. 615-621. doi:10.3109/00498258509045891 [9] K. Mohri, and Y. Uesawa, “Enzymatic Activities in the Microsomes Prepareted from Rat Small Intestinal Epithe- lial Cells by Differential Procedures,” Pharmaceutical Research, Vol. 18, No. 8, 2001, pp. 1232-1236. doi:10.1023/A:1010951732288 [10] O. H. Lowry, N. J. Rosebrough, A. L. Farr and R. J. Randall, “Protein Measurement with the Folin Phenol Reagent,” Journal of Biological Chemistry, Vol. 1, No. 1, 1951, pp. 265-275. [11] P. K. Smith, R. I. Krohn, G. T. Hermanson, A. K. Mal- liam F. H. Garther, M. D. Provenzano, E. K. Fujimoto, N. M. Goeke, B. J. Olson and D. C. Klenk, “Measurement of Protein Using Bicinchoninic Acid,” Analitycal Bio- chemistry, Vol. 150, No. 1, 1985, pp. 76-85. doi:10.1016/0003-2697(85)90442-7 [12] S. Ikushiro, M. Sahara, Y. Emi, Y. Yabusaki and T. Iya- nagi, “Functional Coexpression of Xenobiotic Metabo- lizing Enzymes, Rat Cytochrome P4501A1 and UDP- Glucuronosyltransferase 1A6, in Yeast Microsomes,” Bio- chimica et Biophysica Acta, Vol. 1672, No. 2, 2004, pp. 86-92. doi:10.1016/j.bbagen.2004.02.012 [13] T. Iyanagi, M. Haniu, K. Sogawa, Y. Fujii-Kuriyama, S. Watanabe, J. E. Shively and K. F. Anan, “Cloning and Characterization of cDNA Encoding 3-Methylcholanthrene Inducible Rat mRNA for UDP-Glucuronosyltransferase,” Journal of Biological Chemistry, Vol. 261, No. 33, 1986, pp. 15607-15614. [14] T. Iyanagi, “Molecular Basis of Multiple UDP-Glu- curonosyltransferase Isoenzyme Deficiencies in the Hy- perbiliru-Binemic Rat (Gunn Rat),” Journal of Biological Chemistry, Vol. 266, No. 35, 1991, pp. 24048-24052. [15] Y. Emi, S. Ikushiro and Y. Kato, “Thyroxine-Metaboiizing Rat UDP-Glucuronosyltransferase 1A7 is Regulated by Thyroid Hormone Receptor,” Endocrinology, Vol. 148, No. 12, 2007, pp. 6124-6133. doi:10.1210/en.2007-0443 [16] H. Ito, Y. Fukuda, K. Murata and A. Kimura, “Trans- formation of Intact Yeast Cells Treated with Alkali Cations,” Journal of Biological Chemistry, Vol. 153, No. 1, January, 1983, pp. 163-168. [17] K. Oeda, T. Sakai, and H. Ohkawa, “Expression of Rat Liver Cytochrome P-450MC cDNA in Saccharomyces Cerevisiae,” DNA, Vol. 4, No. 3, 1985, pp. 203-210. doi:10.1089/dna.1985.4.203 [18] S. Ikushiro, Y. Emi and T. Iyanagi, “Identification and Analysis of Drug-Responsive Expression of UDP-Glu- Curonosyltransferase Family 1 (UGT1) Isozymes in Rat Hepatic Microsomes Using Anti-Peptide Antibodies,” Archives of Biochemistry and Biophysics, Vol. 324, No. 2, 1995, pp. 267-272. doi:10.1006/abbi.1995.0039 [19] N. Kasai, T. Sakai, R. Shinkyo, S. Ikushiro, T. Iyanagi, M. Kamao, T, Okano and K. Inoue, “Sequential Metabolism of 2,3,7-Trichlorodibenzo-p-Dioxin (2,3,7-triCDD) by Copyright © 2011 SciRes. PP  Characterization of Bucolome N-Glucuronide Formation: Tissue Specificity and Identification of Rat UDP-Glucuronosyltransferase Isoform(s) Copyright © 2011 SciRes. PP 158 Cytochrome P450 and UDP-Glucuronosyltransferase in Human Liver Microsomes,” Drug Metabolism and Dis- position, Vol. 32, No. 8, 2004, pp. 870-875. [20] K. Mohri, Y. Uesawa and T. Uesugi, “Metabolisme of Bucolome in Rats. Stability and Biliary Excretion of Bu- colome N-Glucuronide,” Journal of Chromatogrphy B, Vol. 759, No. 1, 2001, pp. 153-159. doi:10.1016/S0378-4347(01)00218-3 [21] N. R. Vansell, and C. D. Klaassen, “Increase in Rat Liver UDP-Glucuronosyltransferase mRNA by Microsomal Enzyme Inducers that Enhance Thyroid Hormone Glu- curonidation,” Drug Metabolism and Disposition, Vol. 30, No. 3, 2002, pp. 240-246. doi:10.1124/dmd.30.3.240 [22] M. K. Shelby, N. J. Cherrington, N. R. Vansell and C. D. Klaassen, “Tissue mRNA Expression of the Rat UDP- Glucuronosyltransferase Gene Family,” Drug Metabolism and Disposition, Vol. 31, No. 3, 2003, pp. 326-333. doi:10.1124/dmd.31.3.326 [23] J. R. Chowdhury, R. Kondapalli and N. R. Chowdhury, “Gunn Rat: A Model for Inherited Deficiency of Bilirubin Glucuronidation,” Advances in Veterinary Sci- ence and Comparative Medicine, Vol. 37, 1993, pp. 149-173. [24] H. Kanoh, K. Okada, and K. Mohri, “Identification of the UDP-Glucuronosyltransferase Responsible for Bucolome N-Glucuronide Formation in Rats,” Pharmazie, Vol. 65, No. 11, 2010, pp. 840-844.
|