S. Q. Rashid
ratios become relatively constant af ter mid-pregnancy [1].
Studies done on Bangladeshi population have found that fetal biometric measurements here are smaller than
the Caucasian fetal measurements [2]-[7]. Therefore the western tables and graphs are not appropriate for use in
Bangladesh. We need nomograms based on our own population studies. To this end this study was designed. In
this study a table was prepared with the percentiles, mean and 2 standard deviations (2SD) of this ratio based on
Banglade s hi p opulation .
2. Subjects and Method
This was a prospective, cross sectional study. Each subject was therefore studied once only. The study was con-
ducted on healthy gravid women, who were between 13 to 40 weeks of gestational age. Patients were Bengalis.
Inclusion criteria were: patients with regular periods, no oral contraceptive taken for 3 months prior to concep-
tion, sure last menstrual period (LMP) with an ultrasonography scan done before 20 weeks of gestation to con-
firm the LMP date. No evidence of congenital anomalies. No maternal malnutrition or any medical, surgical or
obstetric complication. No uterine anomaly or large fibroids. Well informed consent of the patients was ob-
tained.
All patients included had ultrasound scans for measurements of the four main fetal parameters, which are, fet-
al biparietal diameter (BPD), head circumference (HC), abdominal circumference (AC) and femur length (FL)
by standard methodology. The ultrasound machine employed was Aloka SSD1100 of Japan. A 3.5 MHz curvili-
near transducer was used for all examinations. A ll measure ments were made by electronic calipers in mm.
The technique of measuring the femoral length involved an initial determination of the lie of the fetus and lo-
cating the femur. Once the femur was located, an attempt was made to define both ends of the calcified portion.
The image was then frozen and with multidirectional electronic calipers, the calcified portion was measured.
The aim was a femur which is finely outlined and had clear-cut ends [8]. After 32 menstrual weeks, the distal
femoral epiphysis was visible but not included in the measurements [9].
The HC was obtained at a level that showed a smooth symmetric head, a well-defined midline echo, paired
Thalami, the cavum septum pellucidum, and the third ventricle. For circumference measurements ellipse was
used which opened to the outline of fetal head.
Statistical package for social science (SPSS) program in the computer software was used for data analysis.
The ratio between the two fetal biometric parameters FL and HC were determined. A table and two graphs were
produced after regression analysis and fitting models. Values were expressed as mean, 2 standard deviations and
percentiles of the sample.
3. Results
A total of 1223, healthy gravid women, were stu died. All of them satisfied the inclusion criter ia. Mean maternal
age was 26.95 (± 4.49), the range was from 17 to 40 years age. The study population was predominantly middle
class. 54.7% of the subjects wer e primipara and 45.3% were multipara. Mean maternal height was 156.73 (± 5.1)
cm and mean maternal weight taken in the first trimester was 57.92 (± 9.2) kg. Mean BMI was 23.67 (± 3.4).
Table 1 gives fitted percentiles of femur length/head circumference ratio. It gives the total number of cases in
each week of gestation and estimated values of 3rd, 10th, 50th, 90th and 97th percentiles and the mean with 2
standard deviations of the data. At 13 weeks gestational age mean femur length/head circumference was 0.14 (±
0.03), at 36 weeks it was 0.22 (± 0.02) and at 40 weeks it was 0.23 (± 0.02). Range of ratio was from 14 to 23.
The coefficient of multiple correlatio n R2 = 0.776, (p < 0.001), and the cubic model gave a good fit to the data 2
standard devi a t ions ranged from ±0.03 t o ±0.02.
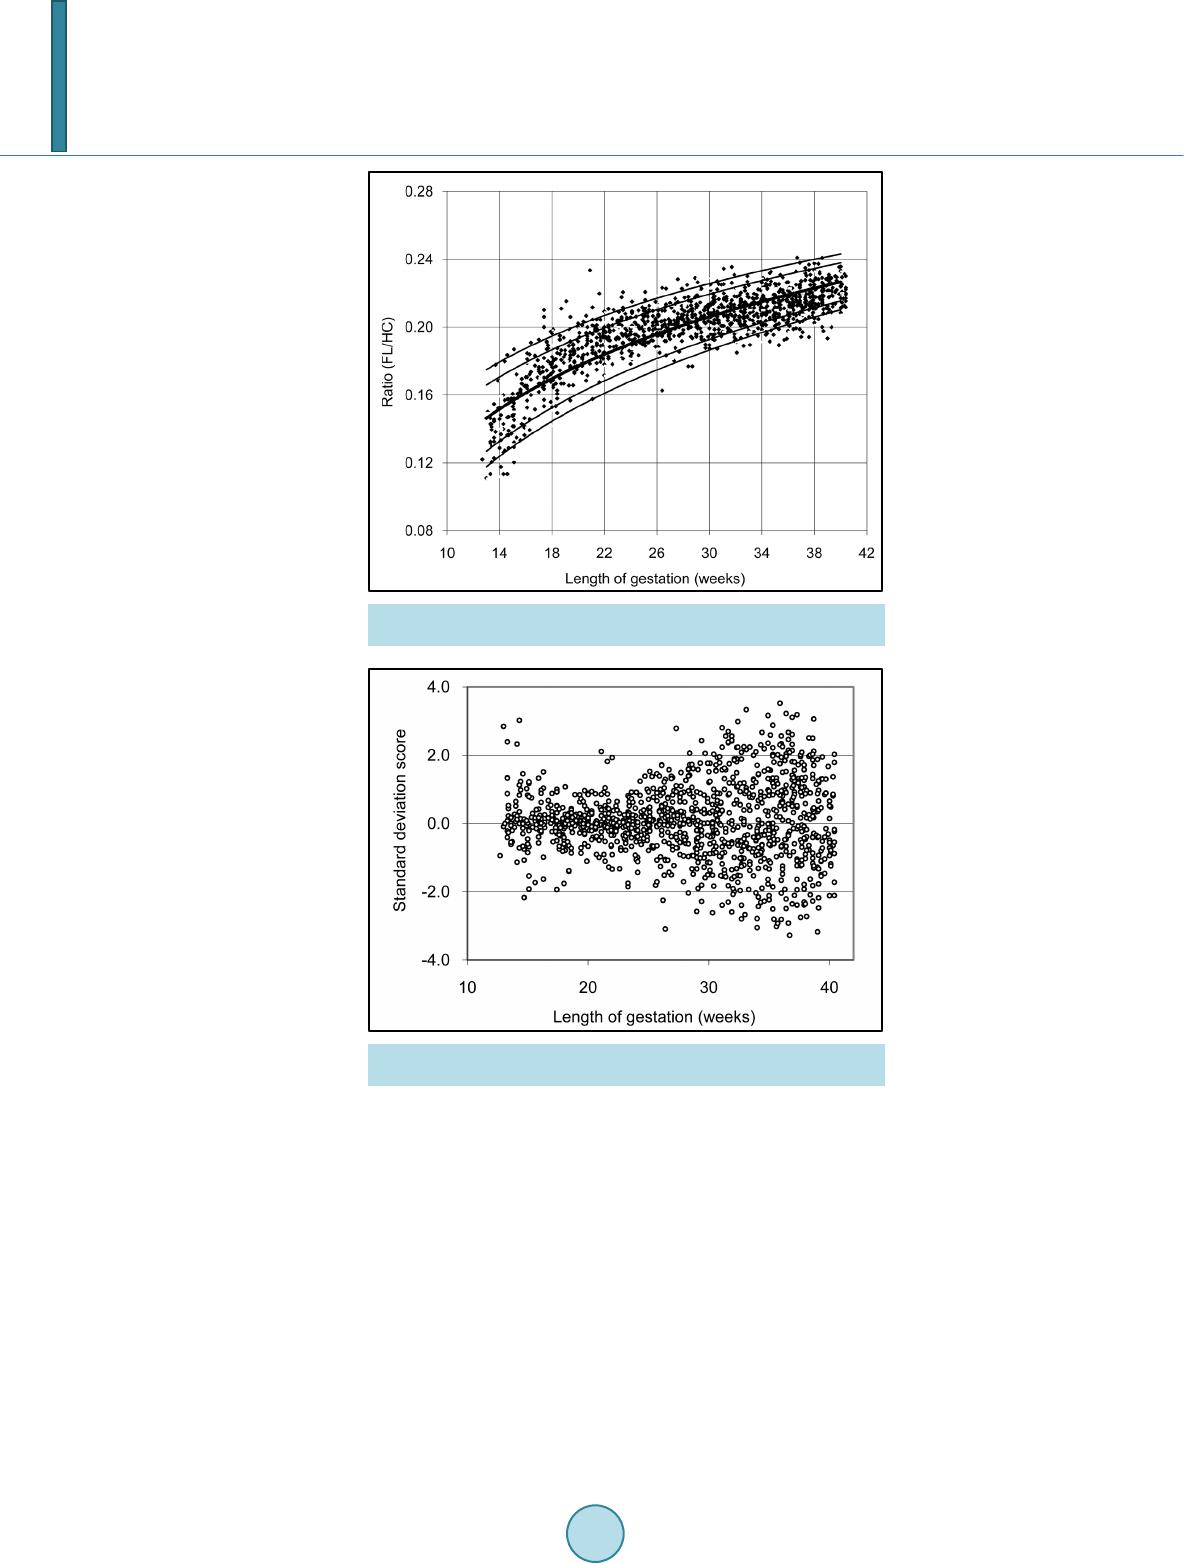
Fig ure 1 shows the raw data for femur length/head circumference with fitted 3rd, 10th, 50th, 90th and 97th
percentile curves superimposed on it. The values of the ratio increase as the pregnancy progresses. It gives 95%
confidence interval (95% CI).
Fig ure 2 shows assessment of goodness of fit of model for standard deviations of femur length/head circum-
ference: Plot of standard deviation score against gestational age, showing expected 2 standard deviations.
4. Discussion
Ratios of two parameters are an important tool for comparison between the two parameters, but one parameter