Paper Menu >>
Journal Menu >>
 Modern Economy, 2011, 2, 335-339 doi:10.4236/me.2011.23036 Published Online July 2011 (http://www.SciRP.org/journal/me) Copyright © 2011 SciRes. ME Co-Movement between Commodity Market and Equity Market: Does Commodity Mark et C ha ng e? Nobuyoshi Yamori Graduat e School of Economics, Nagoya University Furo-Cho Chikusa-Ku, Nagoya, Japan E-mail: yamori@soec.nagoya-u.ac.jp Received February 20, 2011; revised March 13, 2011; accepted April 24, 2011 Abstract This paper, using Japanese market data, finds that although the correlation between equity markets and commodity market used to be negative or almost zero before around 2006, it has increased significantly after the global financial crisis in the autumn of 2008. In this sense, the commodity market lost its character as an alternative asset. Keywords: TOCOM, Commodity Futures, Japan, Index, Bubble 1. Introduction The crash in equity markets occurred in autumn of 2008, while commodity markets also recorded an historical decline. For example, futures prices for West Texas In- termediate (WTI) on the New York Mercantile Exchange (NYMEX), which is the global crude oil price index, dropped by 33% in only a month of October, which represents more than a 50% drop in four months when compared with the peak in July. There has been a distinct expansion in global com- modity futures transactions in recent years. In particular, the speed of expansion accelerated from 2006 to 2008. Transaction activity has resulted in higher commodity prices in recent years. Figure 1 shows the transition on the commodity price index published by the Tokyo Commodity Exchange (TOCOM), which is the most representative commodity index of Japanese commodity markets and indicates average price movements in com- modities such as gold, oil or gasoline which are listed on TOCOM1. According to Figure 1, there is a gentle rise after about 2000 with an acceleration in the price increase after 2005. Although the price increase continued during 2008, after reaching a maximum in July 2008, there was a sharp decline. The recent developments in terms of volume and prices in commodity markets should not be seen as a simple extension of the traditional movement, but as the result of a structural change. This paper is the first paper in the literature to investi- gate the relationship between commodity market and equity market by using Japanese daily data during the global financial crisis period and to find that, unlike pre- vious period, there was a strong positive correlation be- tween commodity returns and equity returns during the crisis. This paper is organized as follows. Section 2 explains recent changes regarding participants in commodity markets. Namely, in addition to traditional participants such as hedgers, who buy commodities (e.g. corn and oil) to produce final goods and services, financial investors including hedge funds, financial institutions and pension funds have actively traded commodities. In Section 3, we explain that financial institutions are interested in com- modity investments, because commodity investments 0 50 100 150 200 250 300 350 400 450 19860531 19870430 19880329 19890303 19900307 19910313 19920318 19930322 19940328 19950404 19960408 19970415 19980422 19990430 20000512 20010518 20020524 20030530 20040609 20050620 20060623 20070628 20080704 20090714 1The “Nikkei-TOCOM Commodity Index” which had originally been p ublicized as the “TOCOM Index” since July 24, 2006, changed its name to the current one as of the April 1, 2009 calculation. The index has been listed on the Tokyo Commodity Exchange since March 2010.Figure 1. The Nikkei-TOCOM index.  N. YAMORI 336 would improve portfolio performance. In Section 3, we also provide an empirical result showing lower correla- tion between equity price movements and commodity price movements, by using Japanese data before the global financial crisis period. Then, Section 4 provides a new result on the correlation between them during the global financial crisis and finds that, unlike previous pe- riod, there was a strong positive correlation between them. Finally, Section 5 summarizes the result of this paper and discusses its policy implications. 2. Global Commodity Markets Assuming the Character of Financial Market The expansion of commodity futures transactions was not only due to the rapid increase in the need to hedge price changes, but was mainly due to the entry into the market by institutional investors or financial institutions which use the commodity market for the purpose of asset management. Thereby, the outstanding balance of com- modity-index-linked financial products invested by in- stitutional investors has recently exceeded $140 billion. Although the transaction amount related to commodity derivatives in the over-the-counter market of securities firms or banks of the leading 11 developed nations dis- played only a moderate increase from 1998 to 2004, a rapid increase occurred after 2005 from a level of $1400 trillion (base for notional value) in December 2004 to $9000 trillion in December 20072. In this manner, recent years have shown a large change in the participants in the global commodity fu- tures markets and, as a result, there has been a significant change in the character of commodity markets from a market for goods to a financial market. 3. Attraction of Commodities as an Investment Vehic le Commodity futures transactions are often considered to be a high-risk transaction, because the scheme allows investors to hold large positions with small own capitals. Therefore, an investor who takes too much risk without enough funds may suffer the bitter fate. However, the attraction for institutional investor is not the type of wager but the quality of diversification of investment. In other words, investors have realized that prices on commodity markets are not linked with prices on equity markets. Modern investment theory promotes the view that real risk is not the fluctuation in individual assets but rather only that part which cannot be negated by the possession of other assets. Consider an asset, X, whose price fluc- tuations are very large. If another asset, Y, provide an offsetting effect, the actual risk of the asset X is reduced by holding the asset Y. Actually, previous studies [1] find that there is a low correlation between price fluctuations in equities and commodity futures. Past experience in Europe and the United States has demonstrated that inclusion of both asset classes will improve overall portfolio returns. Here, we can confirm it by using Japanese data. Namely, we use the Tokyo Commodity Exchange (TO- COM) as an indicator of the commodity market and compare it with the Tokyo Stock Exchange Stock Price Index (TOPIX). The coefficient of correlation for the period from May 31, 1986, to February 28, 2007, is –0.051. That is to say, this negative coefficient of corre- lation means that, when equities fall, on average, com- modities rise. The conspicuous feature is that when equities experi- ence sharp declines, commodities do not decline in a similar manner. Table 1 shows fluctuation in commodity prices on the five days with the largest price decline ratio in approximately 22 years from May 31, 1986 to De- cember 28, 2007 in Tokyo market. Although equities fell by 15% on one day on October 20, 1987, commodities registered a 0.6% gain. Of the worst five days, there was also a commodity decline only on one day and it can be seen that the commodities mar- ket was bullish when equity markets were in sharp de- cline. Although the above findings are obtained from Japanese data, it has been confirmed that the same ap- plies also to the United States [2]. The reason for the negative or zero correlation is that Table 1. The TOCOM Performance on the days with the worst TOPIX performance. Index Value Daily Return TOCOMTOPIX TOCOM TOPIX 19871020 93.32 1793.90 0.00580 –0.15810 19900402 85.64 2069.33 0.00410 –0.07365 20010912 92.00 990.80 0.02811 –0.06574 20000417 72.02 1552.46 –0.01297 –0.06317 19900823 117.93 1829.25 0.04474 –0.05869 20040510 144.43 1085.54 0.01514 –0.05846 20070817 251.00 1480.39 –0.03684 –0.05715 20031023 116.41 1017.03 0.00716 –0.05427 19910819 79.04 1663.94 0.01839 –0.05382 19931129 59.16 1350.48 –0.00539 –0.05339 2Bank for International Settlements (BIS), Regular Derivatives Market Statistics. Copyright © 2011 SciRes. ME 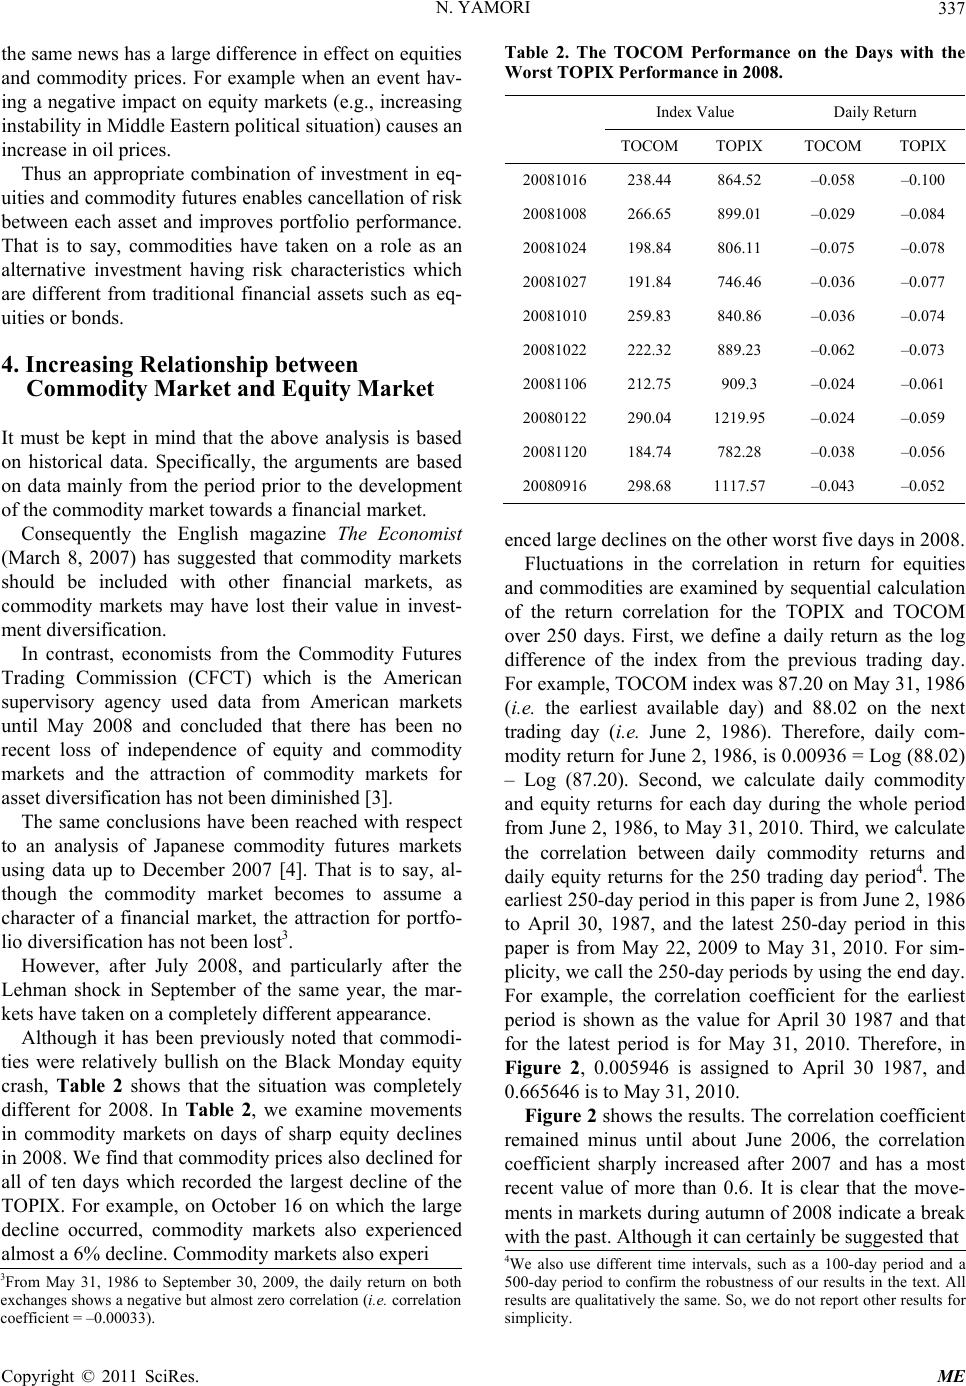 N. YAMORI337 the same news has a large difference in effect on equities and commodity prices. For example when an event hav- ing a negative impact on equity markets (e.g., increasing instability in Middle Eastern political situation) causes an increase in oil prices. Thus an appropriate combination of investment in eq- uities and commodity futures enables cancellation of risk between each asset and improves portfolio performance. That is to say, commodities have taken on a role as an alternative investment having risk characteristics which are different from traditional financial assets such as eq- uities or bonds. 4. Increasing Relationship between Commodity Market and Equity Market It must be kept in mind that the above analysis is based on historical data. Specifically, the arguments are based on data mainly from the period prior to the development of the commodity market towards a financial market. Consequently the English magazine The Economist (March 8, 2007) has suggested that commodity markets should be included with other financial markets, as commodity markets may have lost their value in invest- ment diversification. In contrast, economists from the Commodity Futures Trading Commission (CFCT) which is the American supervisory agency used data from American markets until May 2008 and concluded that there has been no recent loss of independence of equity and commodity markets and the attraction of commodity markets for asset diversification has not been diminished [3]. The same conclusions have been reached with respect to an analysis of Japanese commodity futures markets using data up to December 2007 [4]. That is to say, al- though the commodity market becomes to assume a character of a financial market, the attraction for portfo- lio diversification has not been lost3. However, after July 2008, and particularly after the Lehman shock in September of the same year, the mar- kets have taken on a completely different appearance. Although it has been previously noted that commodi- ties were relatively bullish on the Black Monday equity crash, Table 2 shows that the situation was completely different for 2008. In Table 2, we examine movements in commodity markets on days of sharp equity declines in 2008. We find that commodity prices also declined for all of ten days which recorded the largest decline of the TOPIX. For example, on October 16 on which the large decline occurred, commodity markets also experienced almost a 6% decline. Commodity markets also experi Table 2. The TOCOM Performance on the Days with the Worst TOPIX Performance in 2008. Index Value Daily Return TOCOMTOPIX TOCOM TOPIX 20081016 238.44 864.52 –0.058 –0.100 20081008 266.65 899.01 –0.029 –0.084 20081024 198.84 806.11 –0.075 –0.078 20081027 191.84 746.46 –0.036 –0.077 20081010 259.83 840.86 –0.036 –0.074 20081022 222.32 889.23 –0.062 –0.073 20081106 212.75 909.3 –0.024 –0.061 20080122 290.04 1219.95 –0.024 –0.059 20081120 184.74 782.28 –0.038 –0.056 20080916 298.68 1117.57 –0.043 –0.052 enced large declines on the other worst five days in 2008. Fluctuations in the correlation in return for equities and commodities are examined by sequential calculation of the return correlation for the TOPIX and TOCOM over 250 days. First, we define a daily return as the log difference of the index from the previous trading day. For example, TOCOM index was 87.20 on May 31, 1986 (i.e. the earliest available day) and 88.02 on the next trading day (i.e. June 2, 1986). Therefore, daily com- modity return for June 2, 1986, is 0.00936 = Log (88.02) – Log (87.20). Second, we calculate daily commodity and equity returns for each day during the whole period from June 2, 1986, to May 31, 2010. Third, we calculate the correlation between daily commodity returns and daily equity returns for the 250 trading day period4. The earliest 250-day period in this paper is from June 2, 1986 to April 30, 1987, and the latest 250-day period in this paper is from May 22, 2009 to May 31, 2010. For sim- plicity, we call the 250-day periods by using the end day. For example, the correlation coefficient for the earliest period is shown as the value for April 30 1987 and that for the latest period is for May 31, 2010. Therefore, in Figure 2, 0.005946 is assigned to April 30 1987, and 0.665646 is to May 31, 2010. Figure 2 shows the results. The correlation coefficient remained minus until about June 2006, the correlation coefficient sharply increased after 2007 and has a most recent value of more than 0.6. It is clear that the move- ments in markets during autumn of 2008 indicate a break with the past. Although it can certainly be suggested that 4We also use different time intervals, such as a 100-day period and a 500-day period to confirm the robustness of our results in the text. All results are qualitatively the same. So, we do not report other results for simplicity. 3From May 31, 1986 to September 30, 2009, the daily return on both exchanges shows a negative but almost zero correlation (i.e. correlation coefficient = –0.00033). Copyright © 2011 SciRes. ME 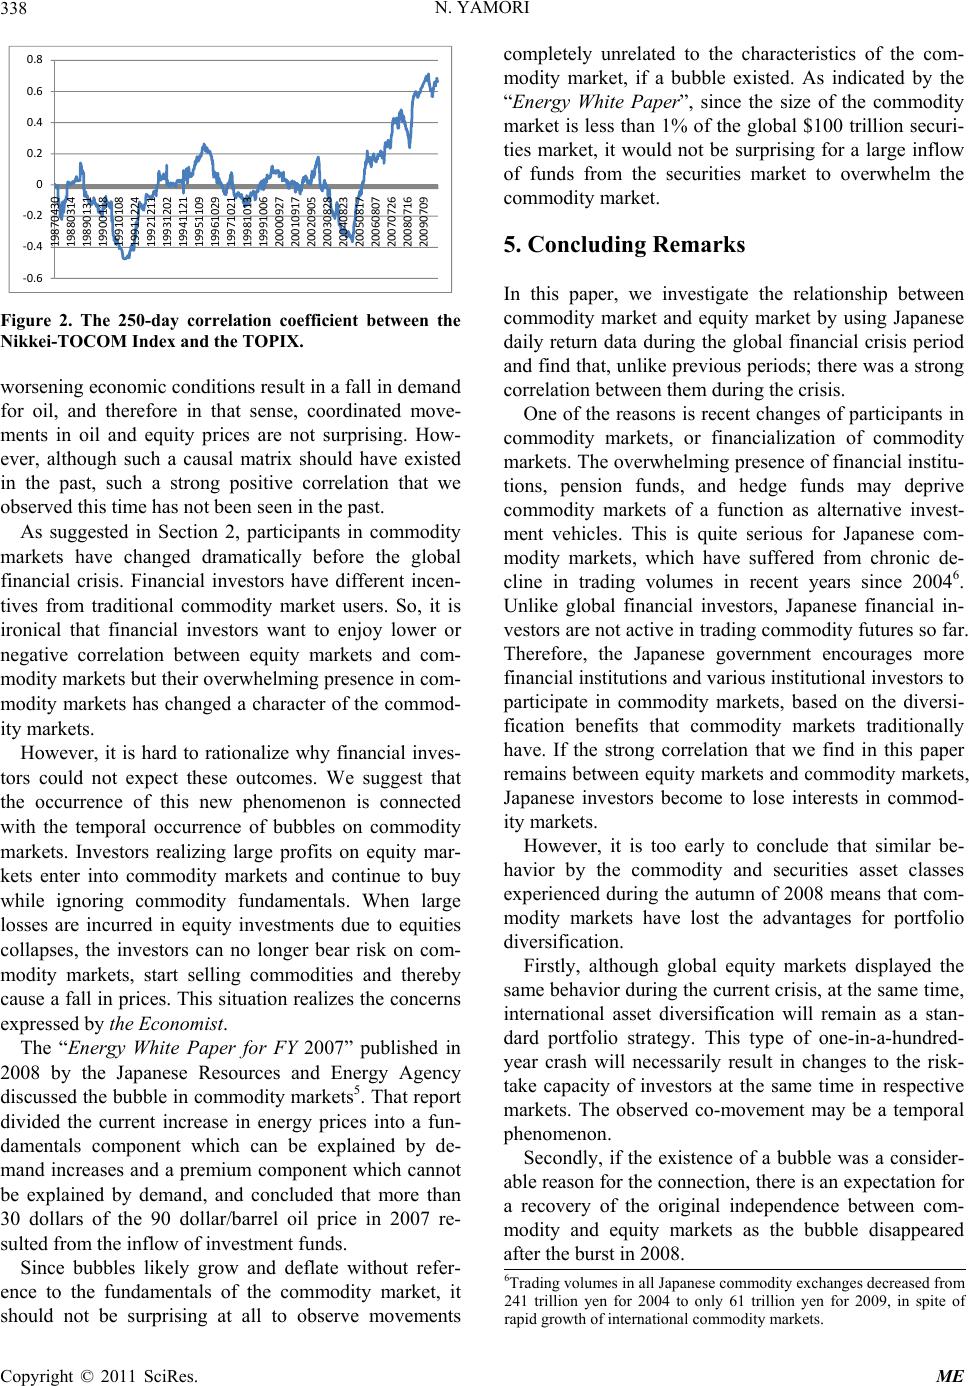 N. YAMORI 338 ‐0.6 ‐0.4 ‐0.2 0 0.2 0.4 0.6 0.8 19870430 19880314 19890131 19900118 19910108 19911224 19921211 19931202 19941121 19951109 19961029 19971021 19981013 19991006 20000927 20010917 20020905 20030828 20040823 20050817 20060807 20070726 20080716 20090709 Figure 2. The 250-day correlation coefficient between the Nikkei-TOCOM Index and the TOPIX. worsening economic conditions result in a fall in demand for oil, and therefore in that sense, coordinated move- ments in oil and equity prices are not surprising. How- ever, although such a causal matrix should have existed in the past, such a strong positive correlation that we observed this time has not been seen in the past. As suggested in Section 2, participants in commodity markets have changed dramatically before the global financial crisis. Financial investors have different incen- tives from traditional commodity market users. So, it is ironical that financial investors want to enjoy lower or negative correlation between equity markets and com- modity markets but their overwhelming presence in com- modity markets has changed a character of the commod- ity markets. However, it is hard to rationalize why financial inves- tors could not expect these outcomes. We suggest that the occurrence of this new phenomenon is connected with the temporal occurrence of bubbles on commodity markets. Investors realizing large profits on equity mar- kets enter into commodity markets and continue to buy while ignoring commodity fundamentals. When large losses are incurred in equity investments due to equities collapses, the investors can no longer bear risk on com- modity markets, start selling commodities and thereby cause a fall in prices. This situation realizes the concerns expressed by the Economist. The “Energy White Paper for FY 2007” published in 2008 by the Japanese Resources and Energy Agency discussed the bubble in commodity markets5. That report divided the current increase in energy prices into a fun- damentals component which can be explained by de- mand increases and a premium component which cannot be explained by demand, and concluded that more than 30 dollars of the 90 dollar/barrel oil price in 2007 re- sulted from the inflow of investment funds. Since bubbles likely grow and deflate without refer- ence to the fundamentals of the commodity market, it should not be surprising at all to observe movements completely unrelated to the characteristics of the com- modity market, if a bubble existed. As indicated by the “Energy White Paper”, since the size of the commodity market is less than 1% of the global $100 trillion securi- ties market, it would not be surprising for a large inflow of funds from the securities market to overwhelm the commodity market. 5. Concluding Remarks In this paper, we investigate the relationship between commodity market and equity market by using Japanese daily return data during the global financial crisis period and find that, unlike previous periods; there was a strong correlation between them during the crisis. One of the reasons is recent changes of participants in commodity markets, or financialization of commodity markets. The overwhelming presence of financial institu- tions, pension funds, and hedge funds may deprive commodity markets of a function as alternative invest- ment vehicles. This is quite serious for Japanese com- modity markets, which have suffered from chronic de- cline in trading volumes in recent years since 20046. Unlike global financial investors, Japanese financial in- vestors are not active in trading commodity futures so far. Therefore, the Japanese government encourages more financial institutions and various institutional investors to participate in commodity markets, based on the diversi- fication benefits that commodity markets traditionally have. If the strong correlation that we find in this paper remains between equity markets and commodity markets, Japanese investors become to lose interests in commod- ity markets. However, it is too early to conclude that similar be- havior by the commodity and securities asset classes experienced during the autumn of 2008 means that com- modity markets have lost the advantages for portfolio diversification. Firstly, although global equity markets displayed the same behavior during the current crisis, at the same time, international asset diversification will remain as a stan- dard portfolio strategy. This type of one-in-a-hundred- year crash will necessarily result in changes to the risk- take capacity of investors at the same time in respective markets. The observed co-movement may be a temporal phenomenon. Secondly, if the existence of a bubble was a consider- able reason for the connection, there is an expectation for a recovery of the original independence between com- modity and equity markets as the bubble disappeared after the burst in 2008. 6Trading volumes in all Japanese commodity exchanges decreased from 241 trillion yen for 2004 to only 61 trillion yen for 2009, in spite o f rapid growth of international commodity markets. Copyright © 2011 SciRes. ME  N. YAMORI Copyright © 2011 SciRes. ME 339 Thirdly, although it is considered that the financial market bubble caused the commodity market bubble, the commodity market is linked with actual goods. Thereby, unlike financial products, commodity prices basically should be resistant to divergence from fundamental prices. On this occasion, since financial institutions un- accustomed to commodity markets enter en masse, re- cent market instability might emerge. However, we can expect that prices in commodity markets will be decided on fundamentals since commodity markets will have a robust professional core formed from a variety of large risk takers including financial institutions, investment funds and institutional investors, which are learning commodity markets now. If this were the case, attraction of commodity markets for asset diversification would not be lost. Finally it should be noted that since the character of commodity markets will increasingly resemble a finan- cial market at least to some degree, regulation from the viewpoint of finance will become indispensable. Of course, it is notable that we have to avoid the situation that regulations for financial markets are simply applied and commodity markets become hard to use for tradi- tional commodity users. Also, we need more cooperation among regulators. In Japan, financial activities are regu- lated by the Financial Services Agency and commodity transactions are regulated by Ministry of Economy, Trade and Industry regarding industrial commodities such as gold and oil, and by Ministry of Agriculture, Forestry and Fisheries of Japan regarding agricultural commodities such as corns and wheat. A scheme to en- courage cooperation among these regulators should be established soon. 6. Acknowledgements The author appreciates an anonymous referee for valuable comments. This research receives the Sci- ence Research Grant-in-Aid (Challenging Explora- tory Research). 7. Reference [1] G. Gorton, F. Hayashi and G. Rouwenhorst, “Commodity Futures: A Japanese Perspective,” Yale ICF Working Paper No. 05-27, February 27, 2007. [2] G. Lungarella, “Managed Futures: A Real Alternative,” Swiss Hedge, Fourth Quarter, 2002. [3] B. Büyükşahin, M. Haigh and M. Robe, “Commodities and Equities: A ‘Market of One’?” CFTC WP, June 2008. [4] N. Yamori, “Characteristics of Japan’s Commodities Index and Its Correlation with Stock Index,” Journal of Applied Research in Finance, Vol. 1, 2009, pp. 187-192. [5] R. S. Eckaus, “The Oil Price really is a Speculative Bub- ble,” Center for Energy and Environmental Policy Re- search, MIT, Working Paper 08-007, June 2008. |